1 millennium institute of astrophysics, santiago, chile
TRANSCRIPT
Draft version October 20, 2021Typeset using LATEX twocolumn style in AASTeX631
Unveiling the Nature of SN 2011fh: a Young and Massive Star Gives Rise to a Luminous SN
2009ip-like Event
Thallis Pessi,1, ∗ Jose L. Prieto,1, 2 Berto Monard,3 Christopher S. Kochanek,4, 5 Greg Bock,6
Andrew J. Drake,7 Ori D. Fox,8 and Stuart Parker9
1Nucleo de Astronomıa, Universidad Diego Portales, Av. Ejercito 441, Santiago, Chile2Millennium Institute of Astrophysics, Santiago, Chile3Klein Karoo Observatory, Calitzdorp, South Africa
4Department of Astronomy, The Ohio State University, 140 West 18th Avenue, Columbus, OH 43210, USA5Center for Cosmology and Astroparticle Physics, The Ohio State University, 191 W. Woodruff Avenue, Columbus, OH 43210, USA
6Runaway Bay, Gold Coast, Queensland, Australia7Division of Physics, Mathematics, and Astronomy, California Institute of Technology, Pasadena, CA 91125, USA
8Space Telescope Science Institute, 3700 San Martin Drive, Baltimore, MD 21218, USA9Parkdale Observatory, 225 Warren Road, RDl Oxford, Canterbury 7495, New Zealand
ABSTRACT
In recent years, many Type IIn supernovae have been found to share striking similarities with the
peculiar SN 2009ip, whose true nature is still under debate. Here, we present 10 years of observations
of SN 2011fh, an interacting transient with spectroscopic and photometric similarities to SN 2009ip.
SN 2011fh had a Mr ∼ −16 mag brightening event, followed by a brighter Mr ∼ −18 mag explosion
in August 2011. The spectra of SN 2011fh are dominated by narrow to intermediate Balmer emission
lines throughout its evolution, with P Cygni profiles indicating fast-moving material at ∼ 6400 km s−1.
HST/WFC3 observations from October of 2016 revealed a bright source with MF814W ≈ −13.3 mag,
indicating that the star might be going through an eruptive phase five years after the bright explosion
of 2011. Using HST photometry of the stellar cluster around SN 2011fh, we estimated an age of ∼ 4.5
Myr for the progenitor, which implies a stellar mass of ∼ 60 M�. VLT/MUSE observations show that
the source is located in a star-forming region with an oxygen abundance of 12 + log10(O/H) ≈ 8.39.
We also show that the progenitor of SN 2011fh exceeded the classical Eddington limit by a large factor
in the months preceding the bright explosion of 2011, suggesting strong super-Eddington winds as a
possible mechanism for the observed mass-loss. These findings favor an energetic explosion in a young
and massive star, possibly a luminous blue variable.
Keywords: supernovae: general - supernovae: individual (SN 2009ip, SN 2011fh) - stars: massive -
stars: mass-loss
1. INTRODUCTION
Most stars with a zero age main sequence (ZAMS)
mass higher than 8 M� are thought to end their lives as
a core-collapse supernova (CCSN). An important frac-
tion of these explosions happen inside a very dense envi-
ronment, formed by the material ejected by the star in
its previous mass-loss history. If the circumstellar mate-
rial (CSM) is sufficiently dense and dominated by hydro-
gen, hydrogen emission lines with multiple velocity com-
ponents appear, leading to a Type IIn supernova (SN,
∗ E-mail: [email protected]
Schlegel 1990; Filippenko 1997; Ransome et al. 2021).
If, on the other hand, the CSM is helium-rich, a Type
Ibn SN is observed (Pastorello et al. 2007, 2008). Re-
cently, Type Icn SNe have been discovered, with narrow
C and O lines, and no H and He lines (Gal-Yam et al.
2021; Fraser et al. 2021).
These events are sometimes referred to as interacting
SNe, since the characteristic emission lines in their spec-
tra come from the ionization of the CSM, by emission
from the SN shock (Smith 2017; Morgan 2020). Other
observational properties of these transients include a rel-
atively blue continuum, very diverse and prolonged light
curves (Taddia et al. 2015; Nyholm et al. 2020) and, for a
arX
iv:2
110.
0954
6v1
[as
tro-
ph.H
E]
18
Oct
202
1

2 Pessi et al.
fraction of interacting SNe, enhanced X-ray (Fox et al.
2000; Katsuda et al. 2014; Chandra et al. 2012a,b) or
radio emission (van Dyk et al. 1993; Pooley et al. 2002;
Williams et al. 2002; Chandra et al. 2009).
The fact that we observe interacting SNe indicates
that intense mass loss activity can occur in the years
preceding the collapse of the progenitor star, and we
still do not have a good physical understanding of the
mechanisms involved (see the review by Smith 2014).
Standard stellar evolution models do not account for
the amount of mass-loss needed to explain these tran-
sients, making it difficult to understand their progeni-
tors (Langer 2012). In fact, direct observations of the
progenitor stars of Type IIn/Ibn SNe have been elusive,
with only a few being confirmed (Gal-Yam et al. 2007;
Gal-Yam & Leonard 2009; Smith et al. 2010, 2011; Foley
et al. 2011).
The progenitors of interacting SNe can be diverse,
which is highlighted by the extreme diversity in their
observational properties (Taddia et al. 2015). The pro-
genitor of the Type IIn SN 2005gl was a massive lumi-
nous blue variable (LBV)-like star (Gal-Yam & Leonard
2009), so at least some of these events are generated by
LBV-like massive stars. Analysis of the environments
of these explosions, however, show that interacting SNe
happen in very similar locations to Type II SNe (An-
derson et al. 2012; Kangas et al. 2017), indicating that
they might have overlapping mass ranges, and are not
confined to very massive stars.
Some massive stars can go through very unstable
mass-loss phases, ejecting large amounts of matter in
energetic eruptions and explosions (Smith 2014). One
well-known example is the massive Galactic LBV Eta
Carinae, which went through a major eruption event
(the Great Eruption) in the 19th century reaching an
absolute magnitude of MV ∼ −14 and with properties
similar to Type IIn SNe (Rest et al. 2012; Prieto et al.
2014; Smith et al. 2018a,b). Estimates show that the
star produced ∼ 1050 ergs of kinetic energy and ejected
10− 20 M� of material (Smith et al. 2003; Smith 2006).
The main mechanism that caused the Great Eruption
of Eta Carinae is still under debate, although recent ob-
servations of its light echoes point to a possible merger
in a triple system (Smith et al. 2018a).
Some of these giant stellar eruptions happen inside a
very dense medium, and produce spectroscopically and
photometrically similar transients to interacting SNe.
Although being a non-terminal event, in the sense that
the progenitor star is still alive afterwards, these explo-
sions also interact with the CSM. Because of these sim-
ilarities, some of these explosions are mistakenly clas-
sified as SNe, originating the term ‘supernova impos-
tors’. A famous impostor associated with a massive star
progenitor is SN 1997bs, which had a peak at MV 'MR ' −14, a very slow decline in its light curve, and
a spectrum dominated by strong narrow Hα in emis-
sion (Van Dyk et al. 2000), although there is presently
no evidence that the star survived (Adams & Kochanek
2015). Another impostor, SN 2000ch, is thought to have
a progenitor similar to Eta Carinae and at its peak of
MV ' −12.7 it showed a full width at half maximum
(FWHM) of the Balmer lines up to ∼ 1550 km s−1 (Fil-
ippenko 2000; Wagner et al. 2004). It is important to
note that SN impostors can also arise from lower mass
stars, such as SN 2008S and similar events (Kochanek
et al. 2012), whose nature and that of other transients
like it is still under debate (they might have been real
CCSNe, see e.g., Kochanek 2011; Adams et al. 2016; Cai
et al. 2021). These transients have dust-enshrouded pro-
genitors and ZAMS masses of ∼ 6−10 M� (Prieto et al.
2008; Thompson et al. 2009).
A remarkable example of the confusion between real
CCSNe and impostors is SN 2009ip, whose nature is
still under debate. When discovered in 2009 (Maza
et al. 2009) it was classified as a Type IIn SN, reach-
ing an absolute magnitude of MR ∼ −14.5. One year
later, another bright eruption with similar luminosity
was detected (Pastorello et al. 2013), indicating that
the progenitor was still alive and did not experience a
core-collapse event in 2009. These eruptions had, in
fact, many similarities with LBVs, showing velocities of
a few hundred km s−1, although faster material with
thousands of km s−1 was also observed. Analysis of
pre-explosion images suggested that the progenitor star
of SN 2009ip was a very massive star with 50–80 M�,
showing LBV-like variability in the years before the 2009
eruption (Smith et al. 2010; Foley et al. 2011).
In 2012, SN 2009ip had two bright explosive events,
reaching MV ∼ −14.5 in August (usually labeled Event
A), and MR ∼ −18 in October (called Event B). Several
authors have discussed the nature of the luminous event
(Mauerhan et al. 2013; Pastorello et al. 2013; Fraser
et al. 2013). Mauerhan et al. (2013) claimed that the
high velocities detected in the explosion is evidence for
a true CCSN during an LBV-like activity. Pastorello
et al. (2013), however, argued that such high velocities
were also observed during the 2011 event, which was
clearly not a true SN. This scenario was also supported
by Fraser et al. (2013), who showed that there was no
signal of nebular emission from nucleosynthesis prod-
ucts after the 2012B eruption, although nebular emis-
sion could be hidden by the continuing interaction with
CSM.
SN 2011fh 3
In the subsequent years, new analyses and a number of
new observations have contributed to the discussion of
whether the 2012 eruptions of SN 2009ip were a termi-
nal event or not (Prieto et al. 2013; Levesque et al. 2014;
Margutti et al. 2014; Smith et al. 2014; Graham et al.
2014; Mauerhan et al. 2014; Moriya 2015; Fraser et al.
2013, 2015; Thoene et al. 2015; Smith et al. 2016a; Gra-
ham et al. 2017). A number of newly detected transients
also presented very similar behavior to SN 2009ip. SN
2010mc, classified as a Type IIn SN (Smith et al. 2014),
shows a nearly identical light curve to 2009ip, with pre-
cursor variability, a decline after peak consistent with56Co decay, and late-time flattening in the light curve
due to CSM interaction. Smith et al. (2014) claimed
that SN 2010mc was, in fact, a core-collapse event, ar-
guing that the missing nebular phase is explained by
CSM obscuration, and that a non-terminal event with
energies of ∼ 1050 erg is implausible. SN 2016bdu (Pa-
storello et al. 2017) also had spectroscopic features of
Type IIn SNe, with several similarities to SN 2009ip,
including the remarkably similar light curve for its two
explosive events. Pre-explosion images also showed pro-
genitor variability similar to that of SN 2009ip. SN
2018cnf (Pastorello et al. 2019) also had a sequence
of two bright explosions, after years of explosive vari-
ability with eruptions reaching Mr ∼ −14.7. Pastorello
et al. (2019) proposed a massive hypergiant or an LBV
star as a plausible progenitor for SN 2018cnf. More re-
cently, the event AT2016jbu/Gaia16cfr showed a vari-
able behavior followed by two bright explosions (Kil-
patrick et al. 2018; Brennan et al. 2021a,b). The avail-
ability of pre-explosion images from the Hubble Space
Telescope (HST) allowed Brennan et al. (2021a,b) to
estimate that the progenitor star had a relatively low
mass of ∼ 20 M�. Other notable SN 2009ip-like tran-
sients might include SN 2015bh (Elias-Rosa et al. 2016;
Thone et al. 2017; Boian & Groh 2018) and SNhunt151
(Elias-Rosa et al. 2018).
The growing class of SN 2009ip-like transients show
several observational similarities: i) pre-explosion vari-
ability, sometimes including LBV-like outburts; ii) two
luminous eruptive events, with the second peak reach-
ing ∼ −18 mag; and iii) the spectroscopic properties of
Type IIn SNe, including multiple velocity components
observed in the Balmer lines.
Here, we present observations of SN 2011fh, which
share many similarities to SN 2009ip. Discovered by
amateur astronomer Berto Monard on 2011 August 24
from South Africa, SN 2011fh was classified as a Type
IIn SN at peak by Prieto & Seth (2011). The source
is located in the outskirts of the nearby galaxy NGC
4806. We describe our 10 years of observations of SN
2011fh in Section 2. Section 3 describes the host galaxy
(Section 3.1), the photometric (Section 3.2) and spec-
troscopic (Section 3.3) evolution, and the environment
where SN 2011fh is located (Section 3.4). We discuss
our analysis in Section 4, and present a final summary
of our conclusions in Section 5.
2. OBSERVATIONS
SN 2011fh was discovered by amateur astronomer
Berto Monard on 2011 August 24 UT1 using unfil-
tered images from the Klein Karoo Observatory in South
Africa (Monard et al. 2011), at ∼ 14.5 mag. The source
was classified as a Type IIn SN at peak by Prieto &
Seth (2011), using observations obtained with the du
Pont 2.5-m telescope and the Wide Field reimaging CCD
camera (WFCCD) at the Las Campanas Observatory
(LCO) on 2011 August 28. A series of spectroscopic
observations were obtained after peak brightness using
the Apache Point Observatory (APO) 3.5 m telescope,
the du Pont 2.5 m telescope, and the Magellan Baade
and Magellan Clay 6.5 m telescopes. Photometric mea-
surements were obtained by the Carnegie Supernova
Project-II (CSP2, Hamuy et al. 2006; Phillips et al. 2019;
Stritzinger et al. 2020) using the Swope 1-m and du Pont
2.5-m telescopes, and archival data were retrieved from
the Catalina Real-Time Transient Survey (CRTS, Drake
et al. 2009) and amateur astronomers. We also analyze
archival images obtained by the Spitzer Space Telescope
(SST) and the Hubble Space Telescope (HST), as well
as spectroscopic observations made with the Multi-Unit
Spectroscopic Explorer (MUSE) instrument on the Very
Large Telescope (VLT).
2.1. Optical and NIR Photometry
Archival unfiltered images obtained by amateur as-
tronomers and CRTS span from 2007 to 2013 (Figure
1). Berto Monard obtained 27 unfiltered images between
2009 January 06 and 2013 January 22, using Meade
12- and 14-inch f/8 telescopes, and an SBIG ST-8 CCD
with 1.6 arcsec/pixel. Five images were obtained by Stu
Parker using a Celestron 14-inch f6.3 telescope with a
pixel scale of 1.1 arcsec/pixel, and a Celestron 11-inch
f6.3 telescope with a pixel scale of 1.6 arcsec/pixel, both
using an SBIG ST-10 3 CCD camera, between 2011 June
16 and August 09. Three images were also obtained
by Greg Bock using a Meade 14-inch telescope, and an
SBIG ST-10 Dual CCD Camera, with a pixel scale of 1.1
arcsec/pixel, between 2011 June 21 and 2012 February
17. CRTS unfiltered images were all obtained by the
1 UT dates are used throughout this paper.
4 Pessi et al.
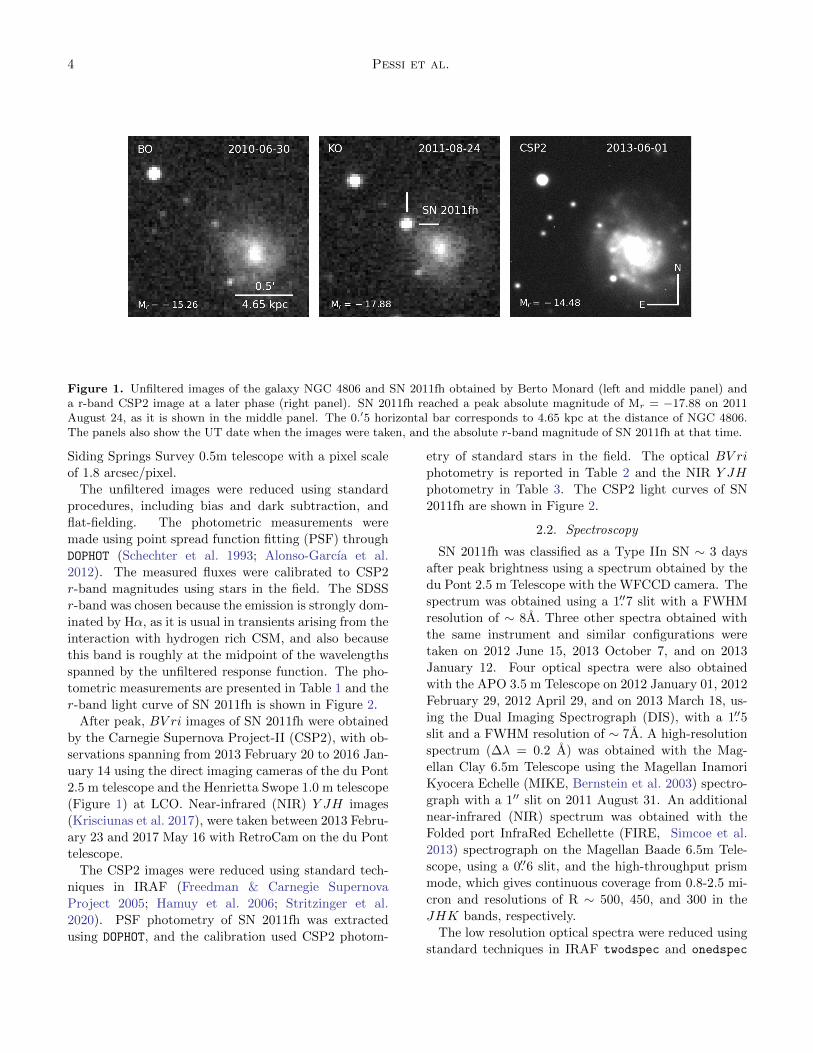
Figure 1. Unfiltered images of the galaxy NGC 4806 and SN 2011fh obtained by Berto Monard (left and middle panel) anda r-band CSP2 image at a later phase (right panel). SN 2011fh reached a peak absolute magnitude of Mr = −17.88 on 2011August 24, as it is shown in the middle panel. The 0.′5 horizontal bar corresponds to 4.65 kpc at the distance of NGC 4806.The panels also show the UT date when the images were taken, and the absolute r-band magnitude of SN 2011fh at that time.
Siding Springs Survey 0.5m telescope with a pixel scale
of 1.8 arcsec/pixel.
The unfiltered images were reduced using standard
procedures, including bias and dark subtraction, and
flat-fielding. The photometric measurements were
made using point spread function fitting (PSF) through
DOPHOT (Schechter et al. 1993; Alonso-Garcıa et al.
2012). The measured fluxes were calibrated to CSP2
r-band magnitudes using stars in the field. The SDSS
r-band was chosen because the emission is strongly dom-
inated by Hα, as it is usual in transients arising from the
interaction with hydrogen rich CSM, and also because
this band is roughly at the midpoint of the wavelengths
spanned by the unfiltered response function. The pho-
tometric measurements are presented in Table 1 and the
r-band light curve of SN 2011fh is shown in Figure 2.
After peak, BV ri images of SN 2011fh were obtained
by the Carnegie Supernova Project-II (CSP2), with ob-
servations spanning from 2013 February 20 to 2016 Jan-
uary 14 using the direct imaging cameras of the du Pont
2.5 m telescope and the Henrietta Swope 1.0 m telescope
(Figure 1) at LCO. Near-infrared (NIR) Y JH images
(Krisciunas et al. 2017), were taken between 2013 Febru-
ary 23 and 2017 May 16 with RetroCam on the du Pont
telescope.
The CSP2 images were reduced using standard tech-
niques in IRAF (Freedman & Carnegie Supernova
Project 2005; Hamuy et al. 2006; Stritzinger et al.
2020). PSF photometry of SN 2011fh was extracted
using DOPHOT, and the calibration used CSP2 photom-
etry of standard stars in the field. The optical BV ri
photometry is reported in Table 2 and the NIR Y JH
photometry in Table 3. The CSP2 light curves of SN
2011fh are shown in Figure 2.
2.2. Spectroscopy
SN 2011fh was classified as a Type IIn SN ∼ 3 days
after peak brightness using a spectrum obtained by the
du Pont 2.5 m Telescope with the WFCCD camera. The
spectrum was obtained using a 1.′′7 slit with a FWHM
resolution of ∼ 8A. Three other spectra obtained with
the same instrument and similar configurations were
taken on 2012 June 15, 2013 October 7, and on 2013
January 12. Four optical spectra were also obtained
with the APO 3.5 m Telescope on 2012 January 01, 2012
February 29, 2012 April 29, and on 2013 March 18, us-
ing the Dual Imaging Spectrograph (DIS), with a 1.′′5
slit and a FWHM resolution of ∼ 7A. A high-resolution
spectrum (∆λ = 0.2 A) was obtained with the Mag-
ellan Clay 6.5m Telescope using the Magellan Inamori
Kyocera Echelle (MIKE, Bernstein et al. 2003) spectro-
graph with a 1′′ slit on 2011 August 31. An additional
near-infrared (NIR) spectrum was obtained with the
Folded port InfraRed Echellette (FIRE, Simcoe et al.
2013) spectrograph on the Magellan Baade 6.5m Tele-
scope, using a 0.′′6 slit, and the high-throughput prism
mode, which gives continuous coverage from 0.8-2.5 mi-
cron and resolutions of R ∼ 500, 450, and 300 in the
JHK bands, respectively.
The low resolution optical spectra were reduced using
standard techniques in IRAF twodspec and onedspec
SN 2011fh 5
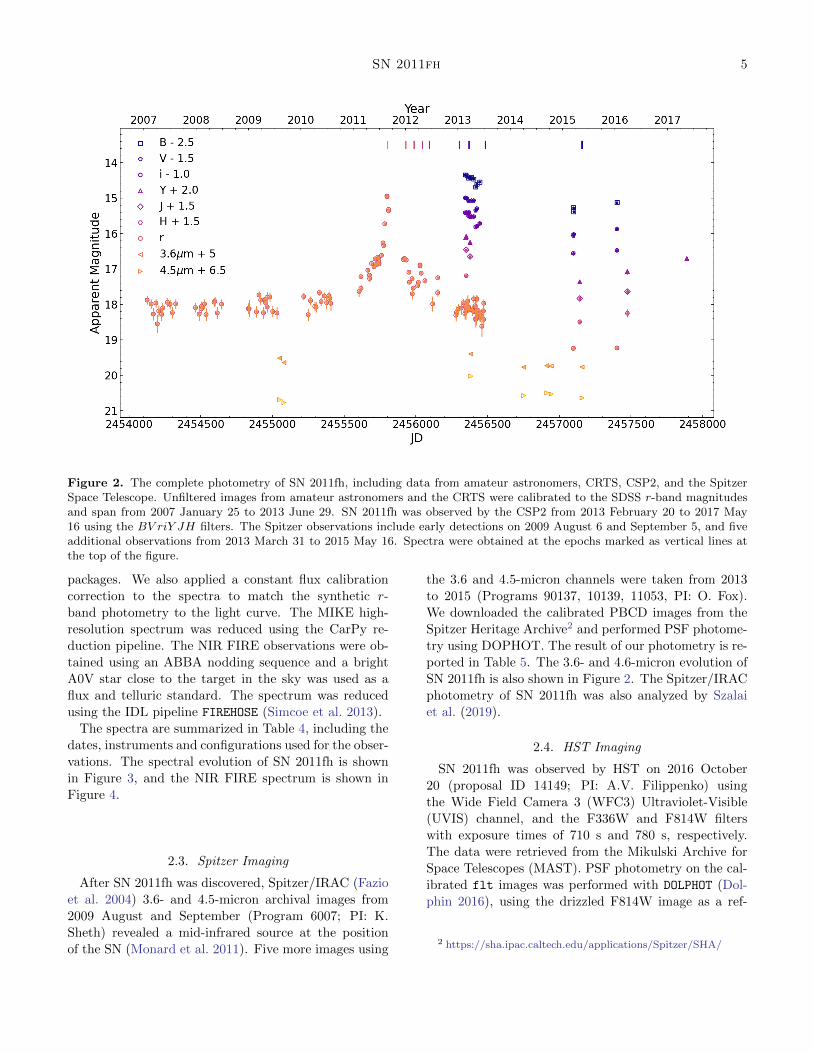
Figure 2. The complete photometry of SN 2011fh, including data from amateur astronomers, CRTS, CSP2, and the SpitzerSpace Telescope. Unfiltered images from amateur astronomers and the CRTS were calibrated to the SDSS r-band magnitudesand span from 2007 January 25 to 2013 June 29. SN 2011fh was observed by the CSP2 from 2013 February 20 to 2017 May16 using the BV riY JH filters. The Spitzer observations include early detections on 2009 August 6 and September 5, and fiveadditional observations from 2013 March 31 to 2015 May 16. Spectra were obtained at the epochs marked as vertical lines atthe top of the figure.
packages. We also applied a constant flux calibration
correction to the spectra to match the synthetic r-
band photometry to the light curve. The MIKE high-
resolution spectrum was reduced using the CarPy re-
duction pipeline. The NIR FIRE observations were ob-
tained using an ABBA nodding sequence and a brightA0V star close to the target in the sky was used as a
flux and telluric standard. The spectrum was reduced
using the IDL pipeline FIREHOSE (Simcoe et al. 2013).
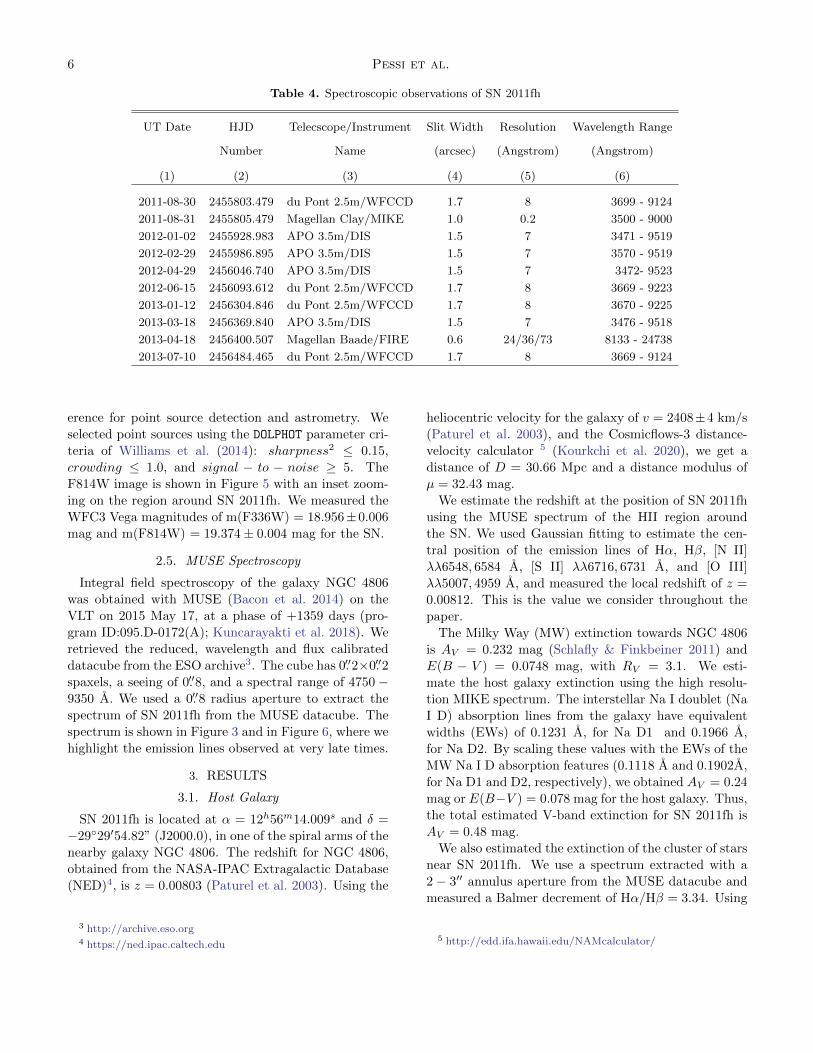
The spectra are summarized in Table 4, including the
dates, instruments and configurations used for the obser-
vations. The spectral evolution of SN 2011fh is shown
in Figure 3, and the NIR FIRE spectrum is shown in
Figure 4.
2.3. Spitzer Imaging
After SN 2011fh was discovered, Spitzer/IRAC (Fazio
et al. 2004) 3.6- and 4.5-micron archival images from
2009 August and September (Program 6007; PI: K.
Sheth) revealed a mid-infrared source at the position
of the SN (Monard et al. 2011). Five more images using
the 3.6 and 4.5-micron channels were taken from 2013
to 2015 (Programs 90137, 10139, 11053, PI: O. Fox).
We downloaded the calibrated PBCD images from the
Spitzer Heritage Archive2 and performed PSF photome-
try using DOPHOT. The result of our photometry is re-
ported in Table 5. The 3.6- and 4.6-micron evolution of
SN 2011fh is also shown in Figure 2. The Spitzer/IRAC
photometry of SN 2011fh was also analyzed by Szalai
et al. (2019).
2.4. HST Imaging
SN 2011fh was observed by HST on 2016 October
20 (proposal ID 14149; PI: A.V. Filippenko) using
the Wide Field Camera 3 (WFC3) Ultraviolet-Visible
(UVIS) channel, and the F336W and F814W filters
with exposure times of 710 s and 780 s, respectively.
The data were retrieved from the Mikulski Archive for
Space Telescopes (MAST). PSF photometry on the cal-
ibrated flt images was performed with DOLPHOT (Dol-
phin 2016), using the drizzled F814W image as a ref-
2 https://sha.ipac.caltech.edu/applications/Spitzer/SHA/
6 Pessi et al.
Table 4. Spectroscopic observations of SN 2011fh
UT Date HJD Telecscope/Instrument Slit Width Resolution Wavelength Range
Number Name (arcsec) (Angstrom) (Angstrom)
(1) (2) (3) (4) (5) (6)
2011-08-30 2455803.479 du Pont 2.5m/WFCCD 1.7 8 3699 - 9124
2011-08-31 2455805.479 Magellan Clay/MIKE 1.0 0.2 3500 - 9000
2012-01-02 2455928.983 APO 3.5m/DIS 1.5 7 3471 - 9519
2012-02-29 2455986.895 APO 3.5m/DIS 1.5 7 3570 - 9519
2012-04-29 2456046.740 APO 3.5m/DIS 1.5 7 3472- 9523
2012-06-15 2456093.612 du Pont 2.5m/WFCCD 1.7 8 3669 - 9223
2013-01-12 2456304.846 du Pont 2.5m/WFCCD 1.7 8 3670 - 9225
2013-03-18 2456369.840 APO 3.5m/DIS 1.5 7 3476 - 9518
2013-04-18 2456400.507 Magellan Baade/FIRE 0.6 24/36/73 8133 - 24738
2013-07-10 2456484.465 du Pont 2.5m/WFCCD 1.7 8 3669 - 9124
erence for point source detection and astrometry. We
selected point sources using the DOLPHOT parameter cri-
teria of Williams et al. (2014): sharpness2 ≤ 0.15,
crowding ≤ 1.0, and signal − to − noise ≥ 5. The
F814W image is shown in Figure 5 with an inset zoom-
ing on the region around SN 2011fh. We measured the
WFC3 Vega magnitudes of m(F336W) = 18.956±0.006
mag and m(F814W) = 19.374± 0.004 mag for the SN.
2.5. MUSE Spectroscopy
Integral field spectroscopy of the galaxy NGC 4806
was obtained with MUSE (Bacon et al. 2014) on the
VLT on 2015 May 17, at a phase of +1359 days (pro-
gram ID:095.D-0172(A); Kuncarayakti et al. 2018). We
retrieved the reduced, wavelength and flux calibrated
datacube from the ESO archive3. The cube has 0.′′2×0.′′2
spaxels, a seeing of 0.′′8, and a spectral range of 4750−9350 A. We used a 0.′′8 radius aperture to extract the
spectrum of SN 2011fh from the MUSE datacube. The
spectrum is shown in Figure 3 and in Figure 6, where we
highlight the emission lines observed at very late times.
3. RESULTS
3.1. Host Galaxy
SN 2011fh is located at α = 12h56m14.009s and δ =
−29◦29′54.82” (J2000.0), in one of the spiral arms of the
nearby galaxy NGC 4806. The redshift for NGC 4806,
obtained from the NASA-IPAC Extragalactic Database
(NED)4, is z = 0.00803 (Paturel et al. 2003). Using the
3 http://archive.eso.org4 https://ned.ipac.caltech.edu
heliocentric velocity for the galaxy of v = 2408±4 km/s
(Paturel et al. 2003), and the Cosmicflows-3 distance-
velocity calculator 5 (Kourkchi et al. 2020), we get a
distance of D = 30.66 Mpc and a distance modulus of
µ = 32.43 mag.
We estimate the redshift at the position of SN 2011fh
using the MUSE spectrum of the HII region around
the SN. We used Gaussian fitting to estimate the cen-
tral position of the emission lines of Hα, Hβ, [N II]
λλ6548, 6584 A, [S II] λλ6716, 6731 A, and [O III]
λλ5007, 4959 A, and measured the local redshift of z =
0.00812. This is the value we consider throughout the
paper.
The Milky Way (MW) extinction towards NGC 4806
is AV = 0.232 mag (Schlafly & Finkbeiner 2011) and
E(B − V ) = 0.0748 mag, with RV = 3.1. We esti-
mate the host galaxy extinction using the high resolu-
tion MIKE spectrum. The interstellar Na I doublet (Na
I D) absorption lines from the galaxy have equivalent
widths (EWs) of 0.1231 A, for Na D1 and 0.1966 A,
for Na D2. By scaling these values with the EWs of the
MW Na I D absorption features (0.1118 A and 0.1902A,
for Na D1 and D2, respectively), we obtained AV = 0.24
mag or E(B−V ) = 0.078 mag for the host galaxy. Thus,
the total estimated V-band extinction for SN 2011fh is
AV = 0.48 mag.
We also estimated the extinction of the cluster of stars
near SN 2011fh. We use a spectrum extracted with a
2 − 3′′ annulus aperture from the MUSE datacube and
measured a Balmer decrement of Hα/Hβ = 3.34. Using
5 http://edd.ifa.hawaii.edu/NAMcalculator/

SN 2011fh 7
Figure 3. The spectral evolution of SN 2011fh from 3 (top) to 1359 (botton) days after peak brightness. Wavelength is in therest frame, and we show log10Fλ plus an offset. Prominent lines of H, He I, Ca II, Na I, NII, and O II are highlighted withdashed lines. The first eight spectra at phases +3 d, +293 d, +505 d, and +684 d were obtained by the du Pont 2.5 m +WFCCD, and tje spectra at phases +129 d, +187 d, +246 d, and +570 d by the APO 3.5 m + DIS instrument (Table 4). Thelast spectrum, at phase +1359 d, was extracted from VLT + MUSE observations.
Levesque et al. (2010), this value implies a total E(B −V ) = 0.16 mag or AV = 0.49 mag. Since this result
is consistent with the total estimated extinction for SN
2011fh, we decided to use the same value of AV = 0.48
for the stars surrounding the SN.
3.2. Photometric Evolution
Figure 2 shows the complete photometric evolution of
SN 2011fh from 2007 to 2017. The SN reached peak
r-band brightness on 2011 August 24 (JD = 2455799),
at r = 14.94 ± 0.028 mag, or Mr = −17.88 ± 0.07 mag
(Figure 1). Before peak, a five month-long (173 days)
brightening event is observed, where the progenitor goes
from r = 17.63 ± 0.15 on 2011 February 11, to r =
16.26±0.04 on 2011 July 28. After this slow brightening,
the source shows a rapid increase to r ∼ 14.94 mag over
∼ 40 days, culminating in the August peak.
A precursor event followed by a rapid rise to peak
brightness is commonly seen in 2009ip-like transients.
For this class of transients, the initial rise is commonly
called “Event A”, and the main peak is called “Event
B”. In Figure 7, we show the r-band light curve near
peak brightness of SN 2011fh, SN 2009ip (Mauerhan
et al. 2013; Fraser et al. 2013), SN 2016bdu (Pas-
torello et al. 2017), and SN 2018cnf (Pastorello et al.
2019). The Johnson R-band magnitudes of SN 2009ip
were converted to SDSS r-band by adding 0.21 mag.
The four transients show a remarkably similar abso-
lute magnitude at peak, with Mr = −18.29 ± 0.10 for
SN 2009ip, Mr = −18.00 ± 0.17 for SN 2016bdu, and
Mr = −18.25 ± 0.04 for SN 2018cnf. SN 2009ip and
SN 2016bdu have a very similar Event A, peaking at
Mr ∼ −15.5, and lasting for ∼ 40 days. Although dif-
ferent in brightness and duration, the slow increase in
luminosity seen for SN 2011fh before peak might share a
8 Pessi et al.
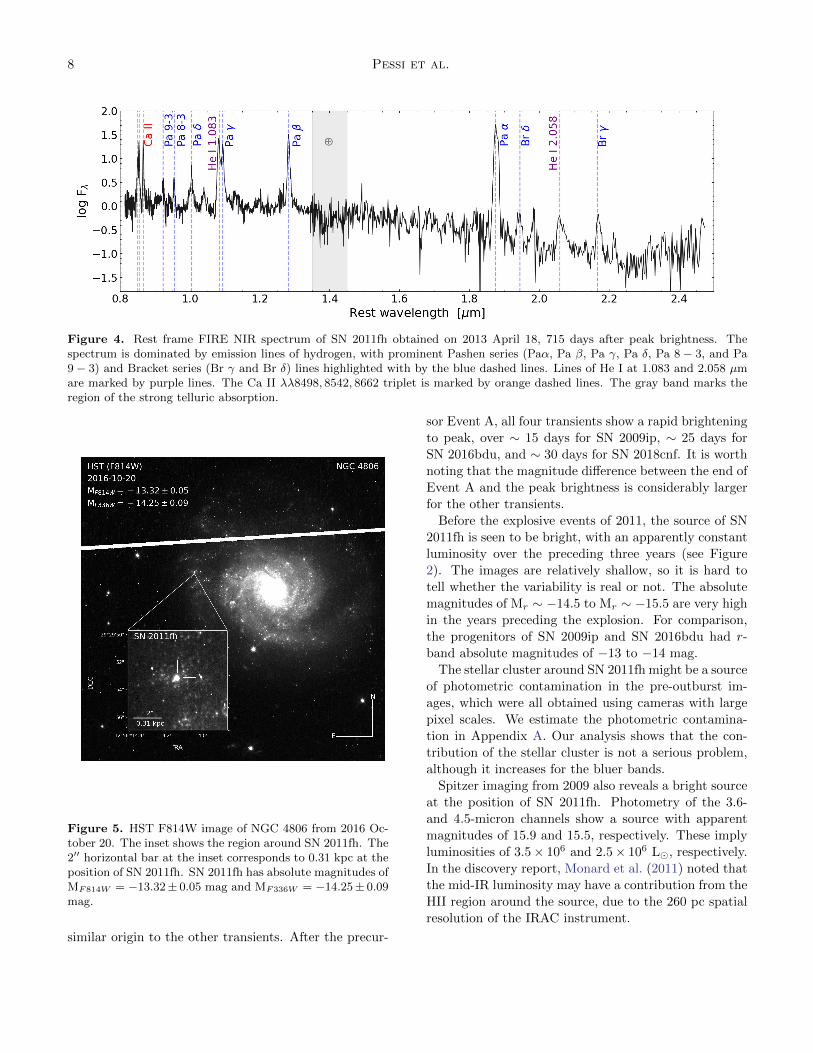
Figure 4. Rest frame FIRE NIR spectrum of SN 2011fh obtained on 2013 April 18, 715 days after peak brightness. Thespectrum is dominated by emission lines of hydrogen, with prominent Pashen series (Paα, Pa β, Pa γ, Pa δ, Pa 8 − 3, and Pa9 − 3) and Bracket series (Br γ and Br δ) lines highlighted with by the blue dashed lines. Lines of He I at 1.083 and 2.058 µmare marked by purple lines. The Ca II λλ8498, 8542, 8662 triplet is marked by orange dashed lines. The gray band marks theregion of the strong telluric absorption.
Figure 5. HST F814W image of NGC 4806 from 2016 Oc-tober 20. The inset shows the region around SN 2011fh. The2′′ horizontal bar at the inset corresponds to 0.31 kpc at theposition of SN 2011fh. SN 2011fh has absolute magnitudes ofMF814W = −13.32± 0.05 mag and MF336W = −14.25± 0.09mag.
similar origin to the other transients. After the precur-
sor Event A, all four transients show a rapid brightening
to peak, over ∼ 15 days for SN 2009ip, ∼ 25 days for
SN 2016bdu, and ∼ 30 days for SN 2018cnf. It is worth
noting that the magnitude difference between the end of
Event A and the peak brightness is considerably larger
for the other transients.
Before the explosive events of 2011, the source of SN
2011fh is seen to be bright, with an apparently constant
luminosity over the preceding three years (see Figure
2). The images are relatively shallow, so it is hard to
tell whether the variability is real or not. The absolute
magnitudes of Mr ∼ −14.5 to Mr ∼ −15.5 are very high
in the years preceding the explosion. For comparison,
the progenitors of SN 2009ip and SN 2016bdu had r-
band absolute magnitudes of −13 to −14 mag.
The stellar cluster around SN 2011fh might be a source
of photometric contamination in the pre-outburst im-
ages, which were all obtained using cameras with large
pixel scales. We estimate the photometric contamina-
tion in Appendix A. Our analysis shows that the con-
tribution of the stellar cluster is not a serious problem,
although it increases for the bluer bands.
Spitzer imaging from 2009 also reveals a bright source
at the position of SN 2011fh. Photometry of the 3.6-
and 4.5-micron channels show a source with apparent
magnitudes of 15.9 and 15.5, respectively. These imply
luminosities of 3.5× 10⁶ and 2.5× 10⁶ L�, respectively.
In the discovery report, Monard et al. (2011) noted that
the mid-IR luminosity may have a contribution from the
HII region around the source, due to the 260 pc spatial
resolution of the IRAC instrument.
SN 2011fh 9
Figure 6. The restframe VLT/MUSE spectrum of SN 2011fh obtained on 2015 May 17, 1359 days after peak brightness. Linesof H, He I, Ca II, Na I, O I, and Fe II are highlighted.
During the first days after peak, the brightness of SN
2011fh drops significantly. Unfortunately, between 7 and
110 days after peak in r-band, there were no photometric
observations of the source. After 110 days, it is signifi-
cantly fainter and slowly fading. The decay, however, is
not monotonic, with two pronounced peaks at 228 (2012
April 11, or JD = 2456029) and 350 days (2012 August
12, or JD = 2456151) after peak. Bumps and fluctu-
ations after peak brightness are common in the light
curve of SN 2009ip-like objects, but the amplitudes seen
for the other three sources shown in Figure 7 are signif-
icantly smaller. This behavior is usually interpreted as
the collision of the ejecta with different shells of CSM.
The overall evolution of SN 2011fh in the months fol-
lowing peak brightness is, however, very similar to SN
2009ip, with a slow fading probably caused by the on-
going interaction with a dense CSM.
The CSP2 optical BV ri- and NIR Y JH-band im-
ages of SN 2011fh, as well as new IR Spitzer obser-
vations, were obtained only starting ∼ 550 days after
peak (2013 February 20). The behavior in the other fil-
ters is very similar to r-band. Initially, all bands show
a slow drop in brightness, with an apparent flattening
by the beginning of 2015, 1300 days after peaking in r-
band. At this epoch the source is still quite luminous,
with Mr ∼ −13.5 mag. Surprisingly, an apparent rise
in luminosity is detected by the beginning of 2016 in
the optical BV i- and NIR Y JH-bands, although not in
the r-band. The apparent brightening in the NIR bands
is clear in the last point of the light curve where the
Y -band brightened by ∆Y ≈ 0.36 mag over 418 days.
HST observations from October 2016 show a very
bright source at the position of SN 2011fh (Figure 5),
with absolute magnitudes of MF814W = −13.32 ± 0.05
mag and MF336W = −14.25 ± 0.09 mag. This is much
more luminous than even the most luminous quies-
cent stars known (e.g., R136a1 and BAT99-98 in the
Tarantula Nebula of the Large Magellanic Cloud, with
absolute bolometric magnitudes of −12.2 and −12.0,
respectively; Bestenlehner et al. 2020; Hainich et al.
2014). Another parallel can be made with Eta Carinae,
which reached an absolute magnitude MV ∼ −14 mag
during its 19th Century Great Eruption (Smith et al.
2018a). This might indicate that we are seeing the star
in a similar LBV-like eruptive state.
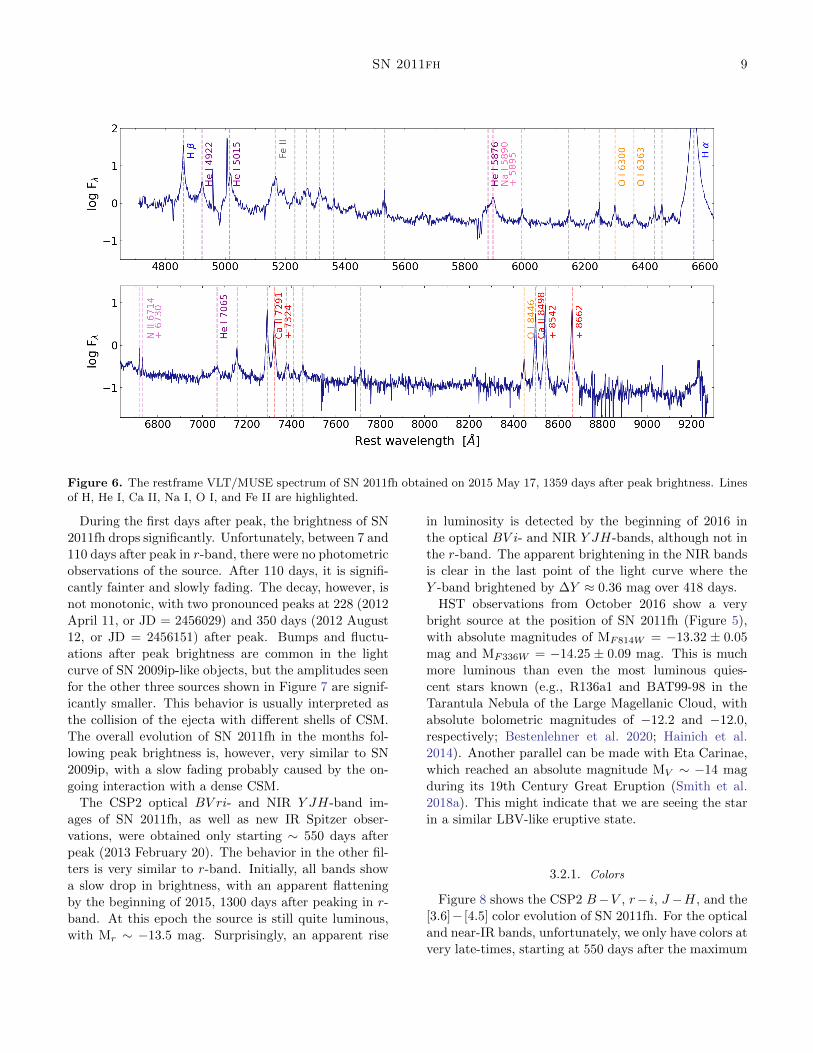
3.2.1. Colors
Figure 8 shows the CSP2 B−V , r− i, J−H, and the
[3.6]− [4.5] color evolution of SN 2011fh. For the optical
and near-IR bands, unfortunately, we only have colors at
very late-times, starting at 550 days after the maximum
10 Pessi et al.
Figure 7. Comparison of the r-band light curve near peakbrightness of SN 2011fh to SN 2009ip (Mauerhan et al. 2013;Fraser et al. 2013), SN 2016bdu (Pastorello et al. 2017) andSN 2018cnf (Pastorello et al. 2019). The phase is in daysrelative to peak brightness.
brightness. We are able to estimate the mid-IR colors
of the progenitor 750 days before peak brightness.
As commonly seen for Type IIn SNe, the B − V and
r − i evolution of SN 2011fh is very slow (Taddia et al.
2013). The B − V color becomes slightly bluer, consis-
tent with the temperature increase measured in the spec-
tra and the overall spectral energy distributions (SEDs,
see Section 3.2.2 and Section 3.3). The J − H color
becomes slightly redder, increasing from 0.22 mag, at
phase +550 days, to 0.34 mag, at phase +1676 days,
although this last value has large uncertainties.
Type IIn SNe are usually bright in the mid-IR bands,
and have very heterogeneous properties (Szalai et al.
2021). A significant color evolution is seen for SN 2011fh
in the mid-IR, if we compare the values before and after
the bright explosion of 2011. The source has [3.6] −[4.5] = 0.37 mag at phase −715 days, and [3.6]− [4.5] =
0.87 mag, 580 days after peak. After peak, the mid-
IR color becomes a little redder, decreasing slowly with
time.
We also show the B − V and R − I evolution of SN
2009ip in Figure 8 from Fraser et al. (2015). We show
the R− I colors, bacause r− i is not available for these
epochs. In B − V , SN 2011fh is significantly bluer than
SN 2009ip, although both events become redder with
time. This might be due to the fact that SN 2011fh
is located in a blue star-forming region, with the con-
Figure 8. B − V , r − i, J − H and [3.6] − [4.5]m colorevolution of SN 2011fh. Phase is in days relative to r-bandpeak. For comparison, we also show the B − V , R − I, and[3.6] − [4.5] color evolution of SN 2009ip (Fraser et al. 2015;Szalai et al. 2019). We show the R − I color, because r − idata is not available.
tamination from the cluster increasing as the SN fades
(see Appendix A). The other possible explanation is that
SN 2011fh is intrinsically hotter than SN 2009ip. The
R− I colors of SN 2009ip are redder than the r− i val-
ues for SN 2011fh. This might imply that SN 2009ip
has stronger Hα emission lines in relation to the spec-
tral continua throughout its evolution. SN 2009ip has a
very similar mid-IR color evolution to SN 2011fh. Al-
though the mid-IR estimates are uncertain at late-times,
SN 2009ip becomes a little redder after peak, and then
bluer around a phase of ∼ 1000 days (Szalai et al. 2019,
2021).
3.2.2. Spectral Energy Distribution
We use the optical, near-infrared (NIR), and infrared
(IR) photometry to constrain the spectral energy dis-
tribution (SED) of SN 2011fh after peak. We used
SN 2011fh 11
SUPERBOL (Version 1.7; Nicholl 2018) to estimate the
blackbody temperature, luminosity, and photosphere ra-
dius between phases +544 and +1602 days. Since SN
2011fh has very strong Hα emission (see Section 3.3),
we carried out this first analysis using only the optical
BV i bands. The results of the single-blackbody fits to
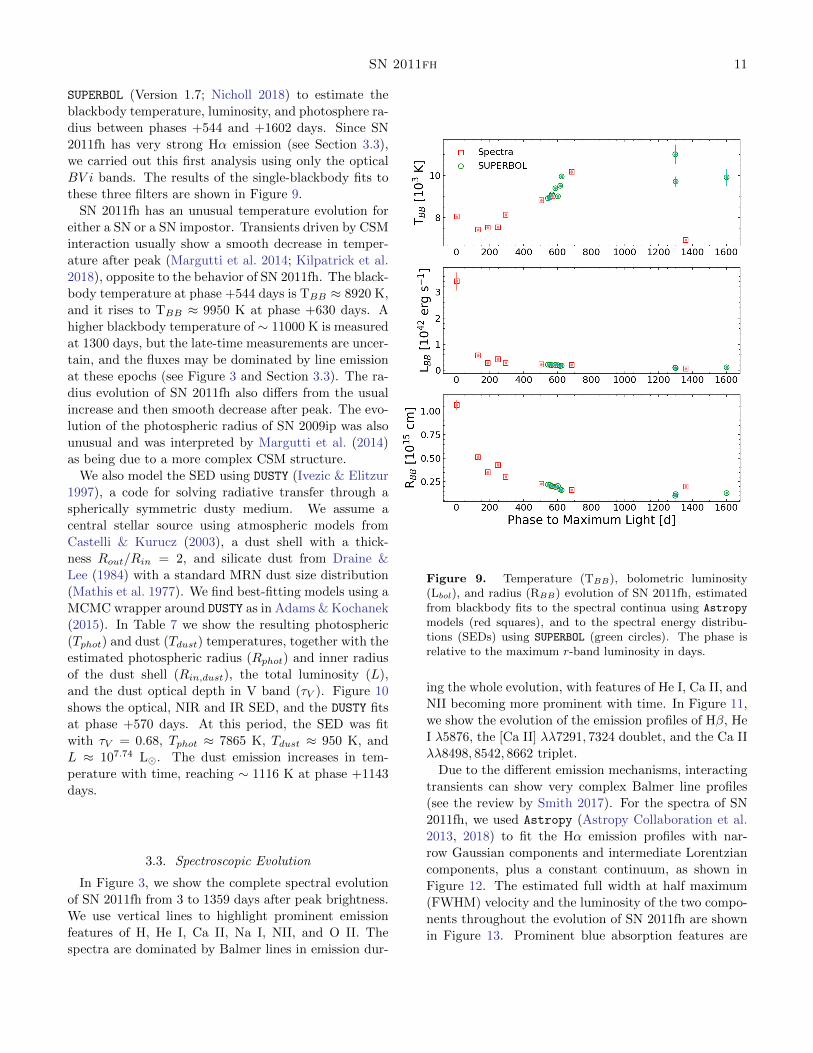
these three filters are shown in Figure 9.
SN 2011fh has an unusual temperature evolution for
either a SN or a SN impostor. Transients driven by CSM
interaction usually show a smooth decrease in temper-
ature after peak (Margutti et al. 2014; Kilpatrick et al.
2018), opposite to the behavior of SN 2011fh. The black-
body temperature at phase +544 days is TBB ≈ 8920 K,
and it rises to TBB ≈ 9950 K at phase +630 days. A
higher blackbody temperature of ∼ 11000 K is measured
at 1300 days, but the late-time measurements are uncer-
tain, and the fluxes may be dominated by line emission
at these epochs (see Figure 3 and Section 3.3). The ra-
dius evolution of SN 2011fh also differs from the usual
increase and then smooth decrease after peak. The evo-
lution of the photospheric radius of SN 2009ip was also
unusual and was interpreted by Margutti et al. (2014)
as being due to a more complex CSM structure.
We also model the SED using DUSTY (Ivezic & Elitzur
1997), a code for solving radiative transfer through a
spherically symmetric dusty medium. We assume a
central stellar source using atmospheric models from
Castelli & Kurucz (2003), a dust shell with a thick-
ness Rout/Rin = 2, and silicate dust from Draine &
Lee (1984) with a standard MRN dust size distribution
(Mathis et al. 1977). We find best-fitting models using a
MCMC wrapper around DUSTY as in Adams & Kochanek
(2015). In Table 7 we show the resulting photospheric
(Tphot) and dust (Tdust) temperatures, together with the
estimated photospheric radius (Rphot) and inner radius
of the dust shell (Rin,dust), the total luminosity (L),
and the dust optical depth in V band (τV ). Figure 10
shows the optical, NIR and IR SED, and the DUSTY fits
at phase +570 days. At this period, the SED was fit
with τV = 0.68, Tphot ≈ 7865 K, Tdust ≈ 950 K, and
L ≈ 107.74 L�. The dust emission increases in tem-
perature with time, reaching ∼ 1116 K at phase +1143
days.
3.3. Spectroscopic Evolution
In Figure 3, we show the complete spectral evolution
of SN 2011fh from 3 to 1359 days after peak brightness.
We use vertical lines to highlight prominent emission
features of H, He I, Ca II, Na I, NII, and O II. The
spectra are dominated by Balmer lines in emission dur-
Figure 9. Temperature (TBB), bolometric luminosity(Lbol), and radius (RBB) evolution of SN 2011fh, estimatedfrom blackbody fits to the spectral continua using Astropy
models (red squares), and to the spectral energy distribu-tions (SEDs) using SUPERBOL (green circles). The phase isrelative to the maximum r-band luminosity in days.
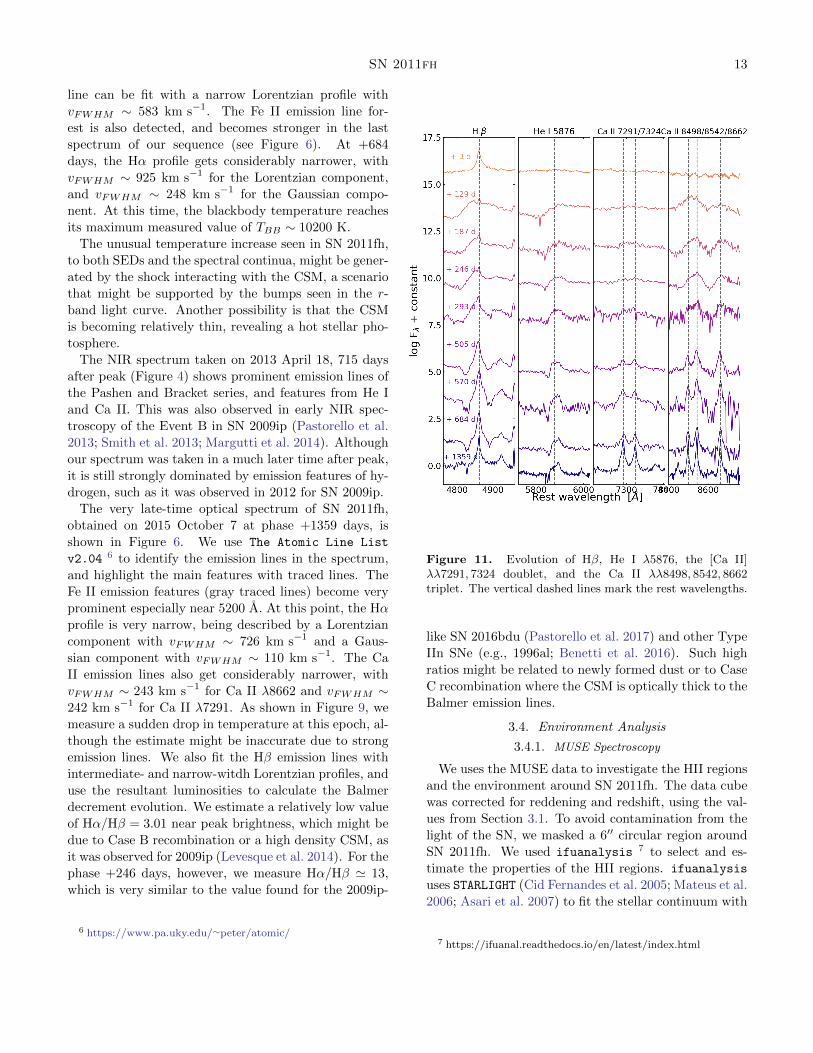
ing the whole evolution, with features of He I, Ca II, and
NII becoming more prominent with time. In Figure 11,
we show the evolution of the emission profiles of Hβ, He
I λ5876, the [Ca II] λλ7291, 7324 doublet, and the Ca II
λλ8498, 8542, 8662 triplet.
Due to the different emission mechanisms, interacting
transients can show very complex Balmer line profiles
(see the review by Smith 2017). For the spectra of SN
2011fh, we used Astropy (Astropy Collaboration et al.
2013, 2018) to fit the Hα emission profiles with nar-
row Gaussian components and intermediate Lorentzian
components, plus a constant continuum, as shown in
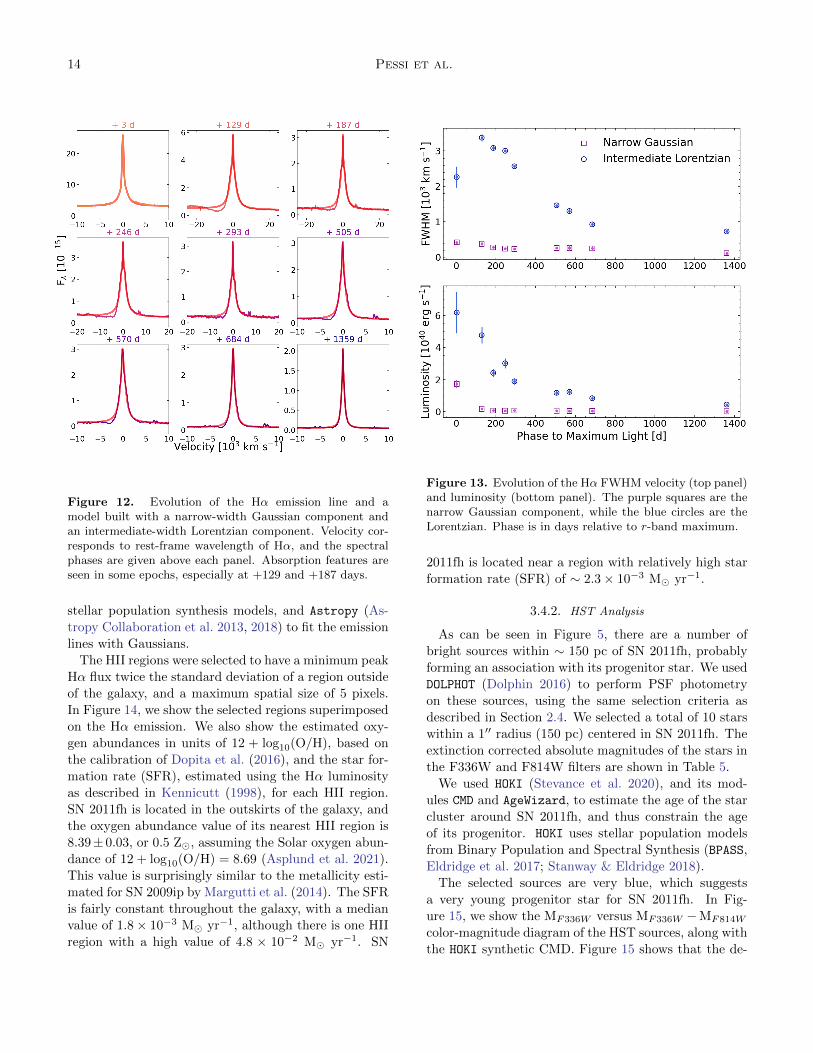
Figure 12. The estimated full width at half maximum
(FWHM) velocity and the luminosity of the two compo-
nents throughout the evolution of SN 2011fh are shown
in Figure 13. Prominent blue absorption features are

12 Pessi et al.
Table 7. DUSTY fits of the SEDs
Phase τV Tphot Tdust log L log Rphot log Rin,dust
(days) (K) (1σ error) (K) (1σ error) (L�) (1σ error) (R�) (1σ error) (cm) (1σ error)
(1) (2) (3) (4) (5) (6) (7) (8) (9) (10) (11) (12)
+570 0.68 7865 511 950 320 7.74 0.04 3.60 0.04 16.52 0.29
+1113 0.91 8321 537 903 233 7.48 0.06 3.42 0.03 16.50 0.26
+1143 0.61 8823 779 1116 240 7.48 0.05 3.37 0.05 16.38 0.18
+1300 0.78 8915 635 1006 182 7.40 0.05 3.32 0.04 16.44 0.17
Figure 10. DUSTY fit to the SED at phase +570, using theoptical and Spitzer data. The photospheric temperature is∼ 7865 K and the dust temperature is ∼ 950 K. The fitparameters are given in Table 7.
also seen at certain epochs, especially at phases +129
and +187 days. The photospheric temperature, radius
and bolometric luminosity evolution of SN 2011fh, ob-
tained from the spectral continuum fitting, also shown
in Figure 9, agree well with the SED models.
The first spectrum in our sequence, obtained 3 days af-
ter peak, is dominated by Balmer lines in emission, and
resembles a typical Type IIn SN. It has a blue contin-
uum with a blackbody temperature of TBB ∼ 8000 K.
The Hα profile can be fit with an intermediate-width
Lorentzian profile with a FWHM velocity of vFWHM ∼2263 km s−1, and a narrow Gaussian component with
vFWHM ∼ 418 km s−1. The narrow Gaussian emis-
sion is generated by the ionized dense CSM, while the
Lorentzian profile is indicative of broad electron scat-
tering in the unshocked CSM (Chugai 2001). It is im-
portant to note that the narrow emission line is always
present, but its width is close to or below instrumen-
tal resolution, making it effectively unresolved. We still
make a rough estimate of the FWHM velocity of the
Gaussian component, after correcting for the resolution.
The Hα profile becomes significantly broader in the
second spectrum at +128 days. The Lorentzian pro-
file now has vFWHM ∼ 3376 km s−1, and the narrow
Gaussian has vFWHM ∼ 376 km s−1. The line is well
described by a P-Cygni profile with a strong blueshifted
absorption feature. The blueshifted absorption wing ex-
tends to ∼ 6430 km s−1, and is probably formed by fast-
moving material along the line of sight. At this epoch,
the He I features and the Ca II triplet start to develop,
with Hβ blended into the He I λ4922 emission line. The
continuum becomes relatively redder, with a blackbody
temperature of TBB ∼ 7400 K.
The FWHM of the Hα Lorentzian begins to decrease
at +187 days, with vFWHM ∼ 3087 km s−1, and the
narrow Gaussian component has vFWHM ∼ 275 km s−1.
The blueshifted absorption feature is still present, with a
velocity of ∼ 6447 km s−1. The blackbody temperature
remains almost constant, with TBB ∼ 7500 K.
By 293 days, the P-Cygni absorption feature is
no longer easy to identify, although the Hα line
cannot be entirely described by only emission fea-
tures, as can be seen in Figure 12. We measure
vFWHM ∼ 2568 km s−1 for the Lorentzian component,
and vFWHM ∼ 231 km s−1 for the narrow Gaussian
component. This epoch is marked by a sudden in-
version in temperature to TBB ∼ 8100 K. At this
epoch, the emission features of Ca II become more
prominent, with the [Ca II] λλ7291, 7324 doublet begin-
ning to develop and the three components of the Ca II
λλ8498, 8542, 8662 triplet becoming easily distinguish-
able.
The emission features remain very similar during the
three next epochs, with He I, NII, and Ca II now very
prominent. At phase +505 days, the Ca II λ8662
SN 2011fh 13
line can be fit with a narrow Lorentzian profile with
vFWHM ∼ 583 km s−1. The Fe II emission line for-
est is also detected, and becomes stronger in the last
spectrum of our sequence (see Figure 6). At +684
days, the Hα profile gets considerably narrower, with
vFWHM ∼ 925 km s−1 for the Lorentzian component,
and vFWHM ∼ 248 km s−1 for the Gaussian compo-
nent. At this time, the blackbody temperature reaches
its maximum measured value of TBB ∼ 10200 K.
The unusual temperature increase seen in SN 2011fh,
to both SEDs and the spectral continua, might be gener-
ated by the shock interacting with the CSM, a scenario
that might be supported by the bumps seen in the r-
band light curve. Another possibility is that the CSM
is becoming relatively thin, revealing a hot stellar pho-
tosphere.
The NIR spectrum taken on 2013 April 18, 715 days
after peak (Figure 4) shows prominent emission lines of
the Pashen and Bracket series, and features from He I
and Ca II. This was also observed in early NIR spec-
troscopy of the Event B in SN 2009ip (Pastorello et al.
2013; Smith et al. 2013; Margutti et al. 2014). Although
our spectrum was taken in a much later time after peak,
it is still strongly dominated by emission features of hy-
drogen, such as it was observed in 2012 for SN 2009ip.
The very late-time optical spectrum of SN 2011fh,
obtained on 2015 October 7 at phase +1359 days, is
shown in Figure 6. We use The Atomic Line List
v2.04 6 to identify the emission lines in the spectrum,
and highlight the main features with traced lines. The
Fe II emission features (gray traced lines) become very
prominent especially near 5200 A. At this point, the Hα
profile is very narrow, being described by a Lorentzian
component with vFWHM ∼ 726 km s−1 and a Gaus-
sian component with vFWHM ∼ 110 km s−1. The Ca
II emission lines also get considerably narrower, with
vFWHM ∼ 243 km s−1 for Ca II λ8662 and vFWHM ∼242 km s−1 for Ca II λ7291. As shown in Figure 9, we
measure a sudden drop in temperature at this epoch, al-
though the estimate might be inaccurate due to strong
emission lines. We also fit the Hβ emission lines with
intermediate- and narrow-witdh Lorentzian profiles, and
use the resultant luminosities to calculate the Balmer
decrement evolution. We estimate a relatively low value
of Hα/Hβ = 3.01 near peak brightness, which might be
due to Case B recombination or a high density CSM, as
it was observed for 2009ip (Levesque et al. 2014). For the
phase +246 days, however, we measure Hα/Hβ ' 13,
which is very similar to the value found for the 2009ip-
6 https://www.pa.uky.edu/∼peter/atomic/
Figure 11. Evolution of Hβ, He I λ5876, the [Ca II]λλ7291, 7324 doublet, and the Ca II λλ8498, 8542, 8662triplet. The vertical dashed lines mark the rest wavelengths.
like SN 2016bdu (Pastorello et al. 2017) and other Type
IIn SNe (e.g., 1996al; Benetti et al. 2016). Such high
ratios might be related to newly formed dust or to Case
C recombination where the CSM is optically thick to the
Balmer emission lines.
3.4. Environment Analysis
3.4.1. MUSE Spectroscopy
We uses the MUSE data to investigate the HII regions
and the environment around SN 2011fh. The data cube
was corrected for reddening and redshift, using the val-
ues from Section 3.1. To avoid contamination from the
light of the SN, we masked a 6′′ circular region around
SN 2011fh. We used ifuanalysis 7 to select and es-
timate the properties of the HII regions. ifuanalysis
uses STARLIGHT (Cid Fernandes et al. 2005; Mateus et al.
2006; Asari et al. 2007) to fit the stellar continuum with
7 https://ifuanal.readthedocs.io/en/latest/index.html
14 Pessi et al.
Figure 12. Evolution of the Hα emission line and amodel built with a narrow-width Gaussian component andan intermediate-width Lorentzian component. Velocity cor-responds to rest-frame wavelength of Hα, and the spectralphases are given above each panel. Absorption features areseen in some epochs, especially at +129 and +187 days.
stellar population synthesis models, and Astropy (As-
tropy Collaboration et al. 2013, 2018) to fit the emission
lines with Gaussians.
The HII regions were selected to have a minimum peakHα flux twice the standard deviation of a region outside
of the galaxy, and a maximum spatial size of 5 pixels.
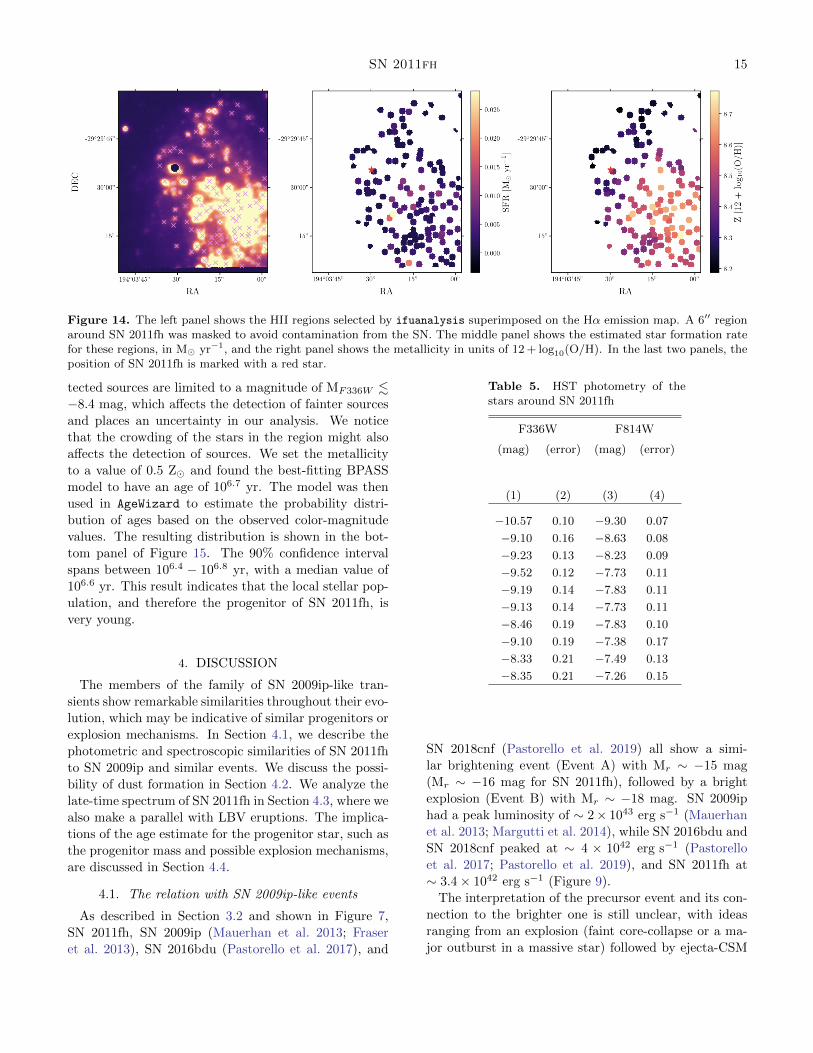
In Figure 14, we show the selected regions superimposed
on the Hα emission. We also show the estimated oxy-
gen abundances in units of 12 + log10(O/H), based on
the calibration of Dopita et al. (2016), and the star for-
mation rate (SFR), estimated using the Hα luminosity
as described in Kennicutt (1998), for each HII region.
SN 2011fh is located in the outskirts of the galaxy, and
the oxygen abundance value of its nearest HII region is
8.39± 0.03, or 0.5 Z�, assuming the Solar oxygen abun-
dance of 12 + log10(O/H) = 8.69 (Asplund et al. 2021).
This value is surprisingly similar to the metallicity esti-
mated for SN 2009ip by Margutti et al. (2014). The SFR
is fairly constant throughout the galaxy, with a median
value of 1.8× 10⁻³ M� yr−1, although there is one HII
region with a high value of 4.8 × 10⁻² M� yr−1. SN
Figure 13. Evolution of the Hα FWHM velocity (top panel)and luminosity (bottom panel). The purple squares are thenarrow Gaussian component, while the blue circles are theLorentzian. Phase is in days relative to r-band maximum.
2011fh is located near a region with relatively high star
formation rate (SFR) of ∼ 2.3× 10⁻³ M� yr−1.
3.4.2. HST Analysis
As can be seen in Figure 5, there are a number of
bright sources within ∼ 150 pc of SN 2011fh, probably
forming an association with its progenitor star. We used
DOLPHOT (Dolphin 2016) to perform PSF photometry
on these sources, using the same selection criteria as
described in Section 2.4. We selected a total of 10 stars
within a 1′′ radius (150 pc) centered in SN 2011fh. The
extinction corrected absolute magnitudes of the stars in
the F336W and F814W filters are shown in Table 5.
We used HOKI (Stevance et al. 2020), and its mod-
ules CMD and AgeWizard, to estimate the age of the star
cluster around SN 2011fh, and thus constrain the age
of its progenitor. HOKI uses stellar population models
from Binary Population and Spectral Synthesis (BPASS,
Eldridge et al. 2017; Stanway & Eldridge 2018).
The selected sources are very blue, which suggests
a very young progenitor star for SN 2011fh. In Fig-
ure 15, we show the MF336W versus MF336W −MF814W
color-magnitude diagram of the HST sources, along with
the HOKI synthetic CMD. Figure 15 shows that the de-
SN 2011fh 15
Figure 14. The left panel shows the HII regions selected by ifuanalysis superimposed on the Hα emission map. A 6′′ regionaround SN 2011fh was masked to avoid contamination from the SN. The middle panel shows the estimated star formation ratefor these regions, in M� yr−1, and the right panel shows the metallicity in units of 12 + log10(O/H). In the last two panels, theposition of SN 2011fh is marked with a red star.
tected sources are limited to a magnitude of MF336W .−8.4 mag, which affects the detection of fainter sources
and places an uncertainty in our analysis. We notice
that the crowding of the stars in the region might also
affects the detection of sources. We set the metallicity
to a value of 0.5 Z� and found the best-fitting BPASS
model to have an age of 106.7 yr. The model was then
used in AgeWizard to estimate the probability distri-
bution of ages based on the observed color-magnitude
values. The resulting distribution is shown in the bot-
tom panel of Figure 15. The 90% confidence interval
spans between 106.4 − 106.8 yr, with a median value of
106.6 yr. This result indicates that the local stellar pop-
ulation, and therefore the progenitor of SN 2011fh, is
very young.
4. DISCUSSION
The members of the family of SN 2009ip-like tran-
sients show remarkable similarities throughout their evo-
lution, which may be indicative of similar progenitors or
explosion mechanisms. In Section 4.1, we describe the
photometric and spectroscopic similarities of SN 2011fh
to SN 2009ip and similar events. We discuss the possi-
bility of dust formation in Section 4.2. We analyze the
late-time spectrum of SN 2011fh in Section 4.3, where we
also make a parallel with LBV eruptions. The implica-
tions of the age estimate for the progenitor star, such as
the progenitor mass and possible explosion mechanisms,
are discussed in Section 4.4.
4.1. The relation with SN 2009ip-like events
As described in Section 3.2 and shown in Figure 7,
SN 2011fh, SN 2009ip (Mauerhan et al. 2013; Fraser
et al. 2013), SN 2016bdu (Pastorello et al. 2017), and
Table 5. HST photometry of thestars around SN 2011fh
F336W F814W
(mag) (error) (mag) (error)
(1) (2) (3) (4)
−10.57 0.10 −9.30 0.07
−9.10 0.16 −8.63 0.08
−9.23 0.13 −8.23 0.09
−9.52 0.12 −7.73 0.11
−9.19 0.14 −7.83 0.11
−9.13 0.14 −7.73 0.11
−8.46 0.19 −7.83 0.10
−9.10 0.19 −7.38 0.17
−8.33 0.21 −7.49 0.13
−8.35 0.21 −7.26 0.15
SN 2018cnf (Pastorello et al. 2019) all show a simi-
lar brightening event (Event A) with Mr ∼ −15 mag
(Mr ∼ −16 mag for SN 2011fh), followed by a bright
explosion (Event B) with Mr ∼ −18 mag. SN 2009ip
had a peak luminosity of ∼ 2× 1043 erg s−1 (Mauerhan
et al. 2013; Margutti et al. 2014), while SN 2016bdu and
SN 2018cnf peaked at ∼ 4 × 1042 erg s−1 (Pastorello
et al. 2017; Pastorello et al. 2019), and SN 2011fh at
∼ 3.4× 1042 erg s−1 (Figure 9).
The interpretation of the precursor event and its con-
nection to the brighter one is still unclear, with ideas
ranging from an explosion (faint core-collapse or a ma-
jor outburst in a massive star) followed by ejecta-CSM

16 Pessi et al.
Figure 15. The top panel shows the color magnitude di-agram (CMD) of the bright stars within 1′′ (150 pc) of SN2011fh, along with a HOKI CMD with an age of 106.7. Thebottom panel shows the AgeWizard probability distribution.The 90 percent confidence interval of the distribution is high-lighted in the red region, and the median is marked as thedashed line.
interaction (Moriya 2015; Elias-Rosa et al. 2016; Pas-
torello et al. 2017), an outburst preceding a SN (Ofek
et al. 2013; Pastorello et al. 2017), or the result of binary
interactions (Kashi et al. 2013; Levesque et al. 2014;
Goranskij et al. 2016). The slow brightening seen for
SN 2011fh in the months before peak might indicate
an LBV-like eruptive state shortly before a major ex-
plosion, as it is commonly observed for SN impostors
(Smith et al. 2011), or even Type IIn SNe (Ofek et al.
2014; Strotjohann et al. 2021). The mechanism behind
Event B, in this case, could be either the shock generated
by a real core-collapse of the progenitor star, or some
energetic eruption originating in instabilities that are
thought to operate in massive stars, such as pulsational
pair-instability (Woosley et al. 2007), unsteady burning
or interaction with other stars (Smith 2014; Smith & Ar-
nett 2014). We cannot rule out the possibility that the
first brightening was in fact the main explosive event,
and that the following event was generated by its shock
interacting with CSM shells. This scenario was invoked
by Pastorello et al. (2017) in the case of SN 2016bdu,
and by Elias-Rosa et al. (2016) for SN 2015bh. Moriya
(2015) described a similar scenario in which the Event
B observed in SN 2009ip was generated by shell-shell
collisions. Unfortunately, the slow brightening event of
SN 2011fh was only observed in r-band, and the lack
of other colors or spectroscopic observations during this
period makes it hard to constrain its true nature.
Pre-explosion images of SN 2009ip and SN 2016bdu
have shown LBV-like variability for their progenitors,
with observed outbursts reaching Mr ∼ −14 mag
(Mauerhan et al. 2013; Pastorello et al. 2017). In Fig-
ure 2 we have shown that nearly five years before the
bright explosions of 2011 the source ranged between
Mr ∼ −14.5 mag and Mr ∼ −15.5 mag. We note, how-
ever, that these observations are relatively shallow. For
this reason, it is not possible to conclude if such behavior
is related to a physical process in the progenitor star.
In the days following peak brightness, SN 2009ip, SN
2016bdu, and SN 2018cnf all show a very similar “shoul-
der” in their light curve (see Figure 7), probably caused
by a collision between CSM shells (Mauerhan et al. 2013;
Fraser et al. 2013; Pastorello et al. 2017; Pastorello et al.
2019). Although photometry of SN 2011fh is not avail-
able at this period, bumps in its r-band light curve are
seen ∼ 228 and ∼ 350 days after peak, probably gener-
ated by the same mechanism. The late-time brightness
evolution of SN 2009ip and SN 2016bdu is very slow,
probably due to ongoing interaction with a dense CSM
(Graham et al. 2017; Pastorello et al. 2017). SN 2011fh
also shows a slow evolution at later times, with an ap-
parent flattening of the light curve after 2014. The 2016
October 20 HST observations revealed a source with an
absolute magnitude of MF814W = −13.32 at the position
of SN 2011fh. This might indicate that its progenitor
star is not in a quiescent state, and is probably going
through an LBV-like eruptive state. Such a late-time
observation of an active source has never been obtained
for any other SN 2009ip-like transient.
Besides their photometric correspondences, SN
2009ip-like events also show remarkable similarities in
their spectroscopic evolution. In Figure 16, we show the
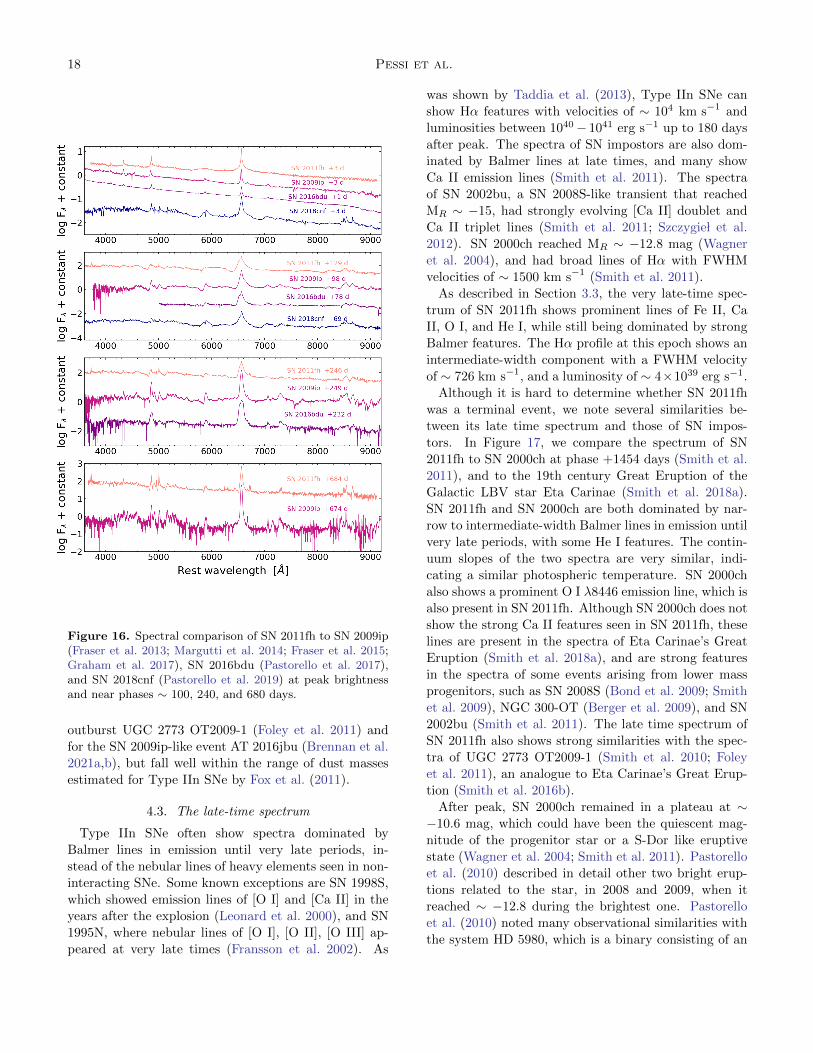
comparison of the spectral evolution of SN 2011fh to SN
2009ip (Fraser et al. 2013; Margutti et al. 2014; Fraser
et al. 2015; Graham et al. 2017), SN 2016bdu (Pastorello
et al. 2017), and SN 2018cnf (Pastorello et al. 2019).
The four objects are very similar near peak brightness,
with blue continua and prominent narrow to interme-
SN 2011fh 17
diate width Balmer emission features. SN 2011fh and
SN 2018cnf, however, have lower blackbody tempera-
tures, with a measured ∼ 8.3 × 10³ K for the latter,
while SN 2009ip and SN 2016bdu show temperatures of
∼ 1.2× 10⁴ K and ∼ 1.7× 10⁴ K, respectively (Graham
et al. 2014; Pastorello et al. 2017).
At +129 days, SN 2011fh has a very distinctive P-
Cygni absorption feature, which indicate the presence
of fast-moving material at ∼ 6430 km s−1. A similar
feature with a velocity of ∼ 5000 km s−1 was seen for SN
2009ip at similar epochs (Margutti et al. 2014). At +78
days, SN 2016bdu also shows a prominent absorption
feature at ∼ 3800 km s−1 (Pastorello et al. 2017).
For spherical symmetry, it is possible to estimate
the mass-loss rate of the progenitor star assuming that
ejecta-CSM shock interaction powers the light curve
(e.g., Smith 2013). Using the CSM luminosity, LCSM ,
the velocity of the cold dense shell, VCDS , and the veloc-
ity of the unshocked CSM, VCSM , and assuming 100%
efficiency of converting shock kinetic energy into radia-
tion,
M = 2 LCSMVCSM
V 3CDS
. (1)
Using VCDS ≈ 3000 km s−1, VCSM ≈ 100 km s−1, and
LCSM ' Lpeak ≈ 3 × 1042 erg s−1, we get M ∼ 4 ×10⁻² M� yr−1. This value is fully consistent with the
estimated mass-loss rate for the progenitor of SN 2009ip
of ∼ 10−2−10−1 M� yr−1 (Fraser et al. 2013; Margutti
et al. 2014). The observed mass-loss rate of SN 2011fh
also falls within the observed range of mass-loss rates
for Type IIn SNe of 10−4−10−2 M� yr−1 (Taddia et al.
2013).
As noted by Brennan et al. (2021a), 2009ip-like tran-
sients often show asymmetries in their Hα emission pro-file. The line in AT 2016jbu was very asymmetric, in
SN 2009ip it was very symmetric, and in SN 2016bdu it
was somewhat asymmetric. SN 2011fh shows a degree
of Hα symmetry somewhat similar to SN 2016bdu, with
a clearly asymmetrical shape until phase +293 (See Fig-
ure 3 and Figure 12). This behavior of the Hα profile
might be related to asymmetries in the CSM
At late-times (∼ 240 days after peak), SN 2011fh, SN
2009ip, and SN 2016bdu are still dominated by emis-
sion lines of H and He, which indicates the ongoing in-
teraction with a dense CSM. All three objects show Ca
II emission at this phase, and both SN 2009ip and SN
2016bdu show He I λ7065 emission, which will develop
later in SN 2011fh. The Fe emission line forest is also vis-
ible for the three events, and is particularly strong for SN
2009ip. Pastorello et al. (2017) noted that SN 2016bdu
shows nebular lines of [O I] at this epoch, and that those
lines are expected for core-collapse SNe. The same was
true for SN 2011fh. Although differing in some details,
the Hα profile of all the three events around this epoch
can be described by a narrow feature superimposed on
an intermediate width feature.
As noted by Graham et al. (2017) for SN 2009ip, SN
2011fh also shows a distinctive O I λ8446 emission line
but no O I λ7774 at very late-times. This suggests that
O I λ8446 is being created by Bowen Ly-β fluorescence,
which is consistent with a very dense and optically thick
medium. As seen in Figure 16, SN 2011fh and SN 2009ip
also show other similarities at phase ∼ +680, such as
the presence of strong Ca II features and the Fe II emis-
sion line forest. The Hα/Hβ flux ratio for SN 2009ip
of around 40 at this epoch is very high (Graham et al.
2017), while we estimate Hα/Hβ ≈ 7 for SN 2011fh.
4.2. The presence of dust
In Section 3.2.2, we found that the spectral energy
distribution (SED) of SN 2011fh has a significant IR
excess that can be described by dust emission with a
temperature of ∼ 950 K at phase +570 days, and ∼1116 K at phase +1143 days.
The dust emission is located at ∼ 1016.52 cm at phase
+570, and decreases to ∼ 1016.44 cm at later epochs
(see Table 7). Dust emission is quite common for inter-
acting transients (Prieto et al. 2008; Berger et al. 2009;
Foley et al. 2011; Fox et al. 2011), but distinguishing
between pre-existing or newly formed dust is not easy.
SN 2011fh shows a similar mid-IR color evolution to sev-
eral Type IIn SNe and other interacting transients, such
as SN 2009ip (Szalai et al. 2021). Asymmetries in the
Hα caused by the suppression of the red wing relative
to the blue wing are often used as an indicator for the
detection of newly formed dust (e.g., Fox et al. 2011).Although SN 2011fh has small asymmetries, it is hard
to conclude whether it is caused by dust formed in the
explosion. The dust inner radius of ∼ 1016.5 cm is larger
than the photospheric radius of ∼ 1014 cm. This indi-
cates that dust is expanding slowly, if at all, and show
little optical depth evolution, all of which suggests that
dust is pre-existing.
The dust mass is
Mdust =4πτVR
2dust
κV, (2)
where κV ≈ 2000 cm2/g is the dust visual opacity for
silicate dust (Fox et al. 2010). Using the properties es-
timated at +570 days, we get ∼ 2 × 10⁻³ M�. For a
typical gas to dust mass ratio of ∼ 100, the total mass
associated with the dust shell is of ∼ 0.2 M�. These
values are much larger than were estimated for the LBV
18 Pessi et al.
Figure 16. Spectral comparison of SN 2011fh to SN 2009ip(Fraser et al. 2013; Margutti et al. 2014; Fraser et al. 2015;Graham et al. 2017), SN 2016bdu (Pastorello et al. 2017),and SN 2018cnf (Pastorello et al. 2019) at peak brightnessand near phases ∼ 100, 240, and 680 days.
outburst UGC 2773 OT2009-1 (Foley et al. 2011) and
for the SN 2009ip-like event AT 2016jbu (Brennan et al.
2021a,b), but fall well within the range of dust masses
estimated for Type IIn SNe by Fox et al. (2011).
4.3. The late-time spectrum
Type IIn SNe often show spectra dominated by
Balmer lines in emission until very late periods, in-
stead of the nebular lines of heavy elements seen in non-
interacting SNe. Some known exceptions are SN 1998S,
which showed emission lines of [O I] and [Ca II] in the
years after the explosion (Leonard et al. 2000), and SN
1995N, where nebular lines of [O I], [O II], [O III] ap-
peared at very late times (Fransson et al. 2002). As
was shown by Taddia et al. (2013), Type IIn SNe can
show Hα features with velocities of ∼ 104 km s−1 and
luminosities between 1040− 1041 erg s−1 up to 180 days
after peak. The spectra of SN impostors are also dom-
inated by Balmer lines at late times, and many show
Ca II emission lines (Smith et al. 2011). The spectra
of SN 2002bu, a SN 2008S-like transient that reached
MR ∼ −15, had strongly evolving [Ca II] doublet and
Ca II triplet lines (Smith et al. 2011; Szczygie l et al.
2012). SN 2000ch reached MR ∼ −12.8 mag (Wagner
et al. 2004), and had broad lines of Hα with FWHM
velocities of ∼ 1500 km s−1 (Smith et al. 2011).
As described in Section 3.3, the very late-time spec-
trum of SN 2011fh shows prominent lines of Fe II, Ca
II, O I, and He I, while still being dominated by strong
Balmer features. The Hα profile at this epoch shows an
intermediate-width component with a FWHM velocity
of ∼ 726 km s−1, and a luminosity of ∼ 4×1039 erg s−1.
Although it is hard to determine whether SN 2011fh
was a terminal event, we note several similarities be-
tween its late time spectrum and those of SN impos-
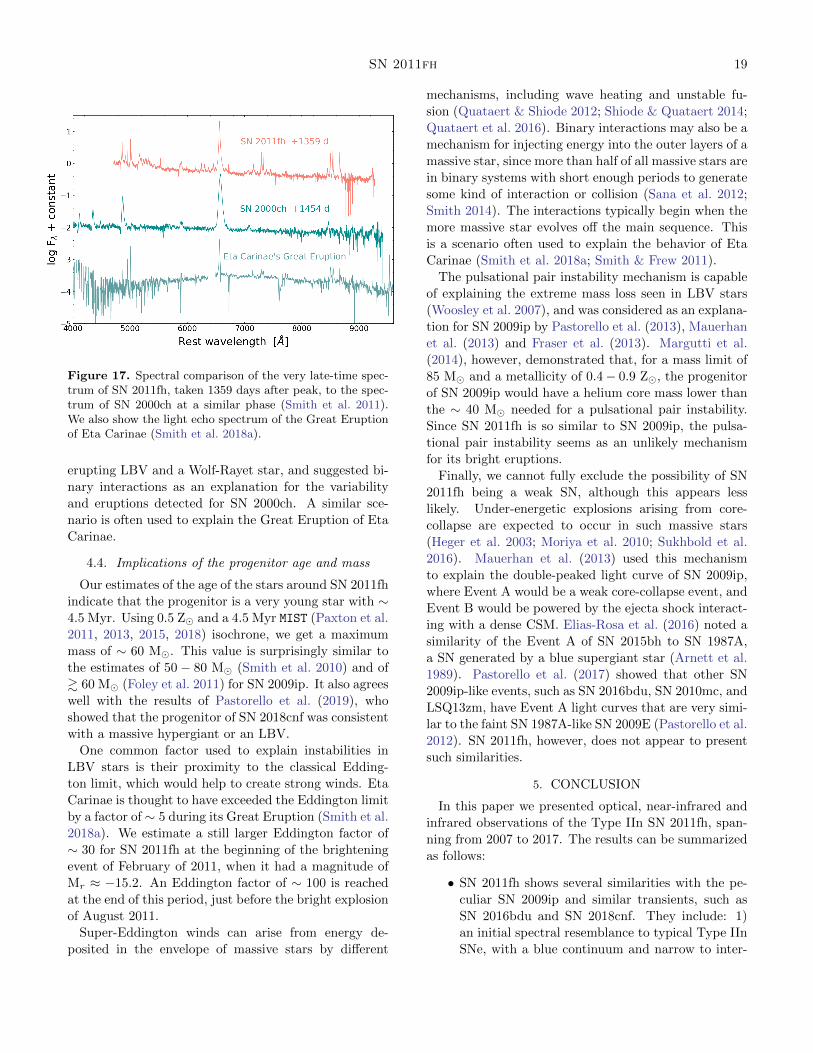
tors. In Figure 17, we compare the spectrum of SN
2011fh to SN 2000ch at phase +1454 days (Smith et al.
2011), and to the 19th century Great Eruption of the
Galactic LBV star Eta Carinae (Smith et al. 2018a).
SN 2011fh and SN 2000ch are both dominated by nar-
row to intermediate-width Balmer lines in emission until
very late periods, with some He I features. The contin-
uum slopes of the two spectra are very similar, indi-
cating a similar photospheric temperature. SN 2000ch
also shows a prominent O I λ8446 emission line, which is
also present in SN 2011fh. Although SN 2000ch does not
show the strong Ca II features seen in SN 2011fh, these
lines are present in the spectra of Eta Carinae’s Great
Eruption (Smith et al. 2018a), and are strong features
in the spectra of some events arising from lower mass
progenitors, such as SN 2008S (Bond et al. 2009; Smith
et al. 2009), NGC 300-OT (Berger et al. 2009), and SN
2002bu (Smith et al. 2011). The late time spectrum of
SN 2011fh also shows strong similarities with the spec-
tra of UGC 2773 OT2009-1 (Smith et al. 2010; Foley
et al. 2011), an analogue to Eta Carinae’s Great Erup-
tion (Smith et al. 2016b).
After peak, SN 2000ch remained in a plateau at ∼−10.6 mag, which could have been the quiescent mag-
nitude of the progenitor star or a S-Dor like eruptive
state (Wagner et al. 2004; Smith et al. 2011). Pastorello
et al. (2010) described in detail other two bright erup-
tions related to the star, in 2008 and 2009, when it
reached ∼ −12.8 during the brightest one. Pastorello
et al. (2010) noted many observational similarities with
the system HD 5980, which is a binary consisting of an
SN 2011fh 19
Figure 17. Spectral comparison of the very late-time spec-trum of SN 2011fh, taken 1359 days after peak, to the spec-trum of SN 2000ch at a similar phase (Smith et al. 2011).We also show the light echo spectrum of the Great Eruptionof Eta Carinae (Smith et al. 2018a).
erupting LBV and a Wolf-Rayet star, and suggested bi-
nary interactions as an explanation for the variability
and eruptions detected for SN 2000ch. A similar sce-
nario is often used to explain the Great Eruption of Eta
Carinae.
4.4. Implications of the progenitor age and mass
Our estimates of the age of the stars around SN 2011fh
indicate that the progenitor is a very young star with ∼4.5 Myr. Using 0.5 Z� and a 4.5 Myr MIST (Paxton et al.
2011, 2013, 2015, 2018) isochrone, we get a maximum
mass of ∼ 60 M�. This value is surprisingly similar to
the estimates of 50− 80 M� (Smith et al. 2010) and of
& 60 M� (Foley et al. 2011) for SN 2009ip. It also agrees
well with the results of Pastorello et al. (2019), who
showed that the progenitor of SN 2018cnf was consistent
with a massive hypergiant or an LBV.
One common factor used to explain instabilities in
LBV stars is their proximity to the classical Edding-
ton limit, which would help to create strong winds. Eta
Carinae is thought to have exceeded the Eddington limit
by a factor of ∼ 5 during its Great Eruption (Smith et al.
2018a). We estimate a still larger Eddington factor of
∼ 30 for SN 2011fh at the beginning of the brightening
event of February of 2011, when it had a magnitude of
Mr ≈ −15.2. An Eddington factor of ∼ 100 is reached
at the end of this period, just before the bright explosion
of August 2011.
Super-Eddington winds can arise from energy de-
posited in the envelope of massive stars by different
mechanisms, including wave heating and unstable fu-
sion (Quataert & Shiode 2012; Shiode & Quataert 2014;
Quataert et al. 2016). Binary interactions may also be a
mechanism for injecting energy into the outer layers of a
massive star, since more than half of all massive stars are
in binary systems with short enough periods to generate
some kind of interaction or collision (Sana et al. 2012;
Smith 2014). The interactions typically begin when the
more massive star evolves off the main sequence. This
is a scenario often used to explain the behavior of Eta
Carinae (Smith et al. 2018a; Smith & Frew 2011).
The pulsational pair instability mechanism is capable
of explaining the extreme mass loss seen in LBV stars
(Woosley et al. 2007), and was considered as an explana-
tion for SN 2009ip by Pastorello et al. (2013), Mauerhan
et al. (2013) and Fraser et al. (2013). Margutti et al.
(2014), however, demonstrated that, for a mass limit of
85 M� and a metallicity of 0.4− 0.9 Z�, the progenitor
of SN 2009ip would have a helium core mass lower than
the ∼ 40 M� needed for a pulsational pair instability.
Since SN 2011fh is so similar to SN 2009ip, the pulsa-
tional pair instability seems as an unlikely mechanism
for its bright eruptions.
Finally, we cannot fully exclude the possibility of SN
2011fh being a weak SN, although this appears less
likely. Under-energetic explosions arising from core-
collapse are expected to occur in such massive stars
(Heger et al. 2003; Moriya et al. 2010; Sukhbold et al.
2016). Mauerhan et al. (2013) used this mechanism
to explain the double-peaked light curve of SN 2009ip,
where Event A would be a weak core-collapse event, and
Event B would be powered by the ejecta shock interact-
ing with a dense CSM. Elias-Rosa et al. (2016) noted a
similarity of the Event A of SN 2015bh to SN 1987A,
a SN generated by a blue supergiant star (Arnett et al.
1989). Pastorello et al. (2017) showed that other SN
2009ip-like events, such as SN 2016bdu, SN 2010mc, and
LSQ13zm, have Event A light curves that are very simi-
lar to the faint SN 1987A-like SN 2009E (Pastorello et al.
2012). SN 2011fh, however, does not appear to present
such similarities.
5. CONCLUSION
In this paper we presented optical, near-infrared and
infrared observations of the Type IIn SN 2011fh, span-
ning from 2007 to 2017. The results can be summarized
as follows:
• SN 2011fh shows several similarities with the pe-
culiar SN 2009ip and similar transients, such as
SN 2016bdu and SN 2018cnf. They include: 1)
an initial spectral resemblance to typical Type IIn
SNe, with a blue continuum and narrow to inter-

20 Pessi et al.
mediate width Balmer emission lines; 2) a bright-
ening event that lasts ∼ 5 months and reaches
Mr ∼ −16 mag, followed by a bright explosion
with Mr ∼ −18 mag at peak; 3) a very similar
light curve, with bumps and a slow fading with
time; and 4) a very similar spectroscopic evolu-
tion, with signals of CSM interaction until very
late times, distinctive P-Cygni features indicating
a fast-moving material, and the presence of Ca II
and Fe II lines.
• The estimated progenitor mass-loss rate of ∼ 4 ×10⁻² M� yr−1 is consistent with mass-loss rate
estimates for SN 2009ip and Type IIn SNe.
• SN 2011fh shows a significant IR excess that can
be described by warm dust emission with Tdust ≈1000 K and Rdust ≈ 3 × 1016 cm. The emission
was probably created by pre-existing dust with a
mass of Mdust ∼ 2× 10⁻³ M�.
• The very late-time spectrum of SN 2011fh shows
strong similarities with some SN impostors ob-
served at a same phase. The detection of narrow
Ca II features and Balmer emission lines is also
similar to the Great Eruption of Eta Carinae.
• SN 2011fh is located in a region with relatively
rapid star formation (∼ 2 × 10⁻³ M� yr−1). The
H II region oxygen abundance of 12 + log(O/H) =
8.39 (∼ 0.5 Z�) is similar to what was estimated
at the location of SN 2009ip.
• The local stellar population has an age of ∼4.5 Myr, which corresponds to a progenitor with
an initial main-sequence mass of ∼ 60 M�. This
mass estimate is similar to the estimates for SN2009ip’s progenitor, and consistent with LBV
stars.
• SN 2011fh exceeded the classical Eddington limit
by a large factor in the months before the bright
explosion of 2011. This suggests that a possible
mechanism behind the bright event is related to
strong supper-Eddington winds.
Although it is hard to conclude whether SN 2011fh
was a core-collapse or a non-terminal event, the tran-
sient shows many similarities with impostors and LBV-
like eruptions. The lack of observational signatures re-
lated to a core-collapse, such as broad Balmer and O I
lines at late times, makes the scenario of a true SN less
likely. Our results therefore imply that at least a frac-
tion of SN 2009ip-like events arise from non-terminal
eruptions in massive and young stars. The discovery
and follow up observations of new transients similar to
SN 2009ip will certainly help in the understanding of
the mechanisms behind this unique class of events.
We would like to thank Andrea Pastorello and Melissa
Graham for kindly sharing their data on SN 2016bdu,
SN 2018cnf, and SN 2009ip. We thank the Carnegie
Supernova Project-II for obtaining several photometric
observations presented in the paper, and in particular
Carlos Contreras, Mark Phillips, Nidia Morrell and Eric
Hsiao. We are also extremely thankful to Heloise Ste-
vance for all the help on understanding and interpreting
the results from HOKI and AgeWizard. TP is supported
by CONICYT’s Programa de Astronomıa through the
ALMA-CONICYT 2019 grant 31190017. Support for
JLP is provided in part by ANID through the Fondecyt
regular grant 1191038 and through the Millennium Sci-
ence Initiative grant ICN12009, awarded to The Millen-
nium Institute of Astrophysics, MAS. CSK is supported
by NSF grants AST-1814440 and AST-1907570. This
paper includes optical and NIR photometry obtained by
the Carnegie Supernova Project, which was generously
supported by NSF grants AST-1008343, AST-1613426,
AST-1613455, and AST-1613472.

SN 2011fh 21
REFERENCES
Adams, S. M., & Kochanek, C. S. 2015, MNRAS, 452,
2195, doi: 10.1093/mnras/stv1409
Adams, S. M., Kochanek, C. S., Prieto, J. L., et al. 2016,
MNRAS, 460, 1645, doi: 10.1093/mnras/stw1059
Alonso-Garcıa, J., Mateo, M., Sen, B., et al. 2012, AJ, 143,
70, doi: 10.1088/0004-6256/143/3/70
Anderson, J. P., Habergham, S. M., James, P. A., &
Hamuy, M. 2012, MNRAS, 424, 1372,
doi: 10.1111/j.1365-2966.2012.21324.x
Arnett, W. D., Bahcall, J. N., Kirshner, R. P., & Woosley,
S. E. 1989, ARA&A, 27, 629,
doi: 10.1146/annurev.aa.27.090189.003213
Asari, N. V., Cid Fernandes, R., Stasinska, G., et al. 2007,
MNRAS, 381, 263, doi: 10.1111/j.1365-2966.2007.12255.x
Asplund, M., Amarsi, A. M., & Grevesse, N. 2021, arXiv
e-prints, arXiv:2105.01661.
https://arxiv.org/abs/2105.01661
Astropy Collaboration, Robitaille, T. P., Tollerud, E. J.,
et al. 2013, A&A, 558, A33,
doi: 10.1051/0004-6361/201322068
Astropy Collaboration, Price-Whelan, A. M., Sipocz, B. M.,
et al. 2018, AJ, 156, 123, doi: 10.3847/1538-3881/aabc4f
Bacon, R., Vernet, J., Borisova, E., et al. 2014, The
Messenger, 157, 13
Benetti, S., Chugai, N. N., Utrobin, V. P., et al. 2016,
MNRAS, 456, 3296, doi: 10.1093/mnras/stv2811
Berger, E., Soderberg, A. M., Chevalier, R. A., et al. 2009,
ApJ, 699, 1850, doi: 10.1088/0004-637X/699/2/1850
Bernstein, R., Shectman, S. A., Gunnels, S. M., Mochnacki,
S., & Athey, A. E. 2003, in Society of Photo-Optical
Instrumentation Engineers (SPIE) Conference Series,
Vol. 4841, Instrument Design and Performance for
Optical/Infrared Ground-based Telescopes, ed. M. Iye &
A. F. M. Moorwood, 1694–1704, doi: 10.1117/12.461502
Bestenlehner, J. M., Crowther, P. A., Caballero-Nieves,
S. M., et al. 2020, MNRAS, 499, 1918,
doi: 10.1093/mnras/staa2801
Boian, I., & Groh, J. H. 2018, A&A, 617, A115,
doi: 10.1051/0004-6361/201731794
Bond, H. E., Bedin, L. R., Bonanos, A. Z., et al. 2009,
ApJL, 695, L154, doi: 10.1088/0004-637X/695/2/L154
Brennan, S. J., Fraser, M., Johansson, J., et al. 2021a,
arXiv e-prints, arXiv:2102.09572.
https://arxiv.org/abs/2102.09572
—. 2021b, arXiv e-prints, arXiv:2102.09576.
https://arxiv.org/abs/2102.09576
Cai, Y. Z., Pastorello, A., Fraser, M., et al. 2021, arXiv
e-prints, arXiv:2108.05087.
https://arxiv.org/abs/2108.05087
Castelli, F., & Kurucz, R. L. 2003, in Modelling of Stellar
Atmospheres, ed. N. Piskunov, W. W. Weiss, & D. F.
Gray, Vol. 210, A20.
https://arxiv.org/abs/astro-ph/0405087
Chandra, P., Chevalier, R. A., Chugai, N., et al. 2012a,
ApJ, 755, 110, doi: 10.1088/0004-637X/755/2/110
Chandra, P., Chevalier, R. A., Irwin, C. M., et al. 2012b,
ApJL, 750, L2, doi: 10.1088/2041-8205/750/1/L2
Chandra, P., Stockdale, C. J., Chevalier, R. A., et al. 2009,
ApJ, 690, 1839, doi: 10.1088/0004-637X/690/2/1839
Chugai, N. N. 2001, MNRAS, 326, 1448,
doi: 10.1111/j.1365-2966.2001.04717.x
Cid Fernandes, R., Mateus, A., Sodre, L., Stasinska, G., &
Gomes, J. M. 2005, MNRAS, 358, 363,
doi: 10.1111/j.1365-2966.2005.08752.x
Dolphin, A. 2016, DOLPHOT: Stellar photometry.
http://ascl.net/1608.013
Dopita, M. A., Kewley, L. J., Sutherland, R. S., & Nicholls,
D. C. 2016, Ap&SS, 361, 61,
doi: 10.1007/s10509-016-2657-8
Draine, B. T., & Lee, H. M. 1984, ApJ, 285, 89,
doi: 10.1086/162480
Drake, A. J., Djorgovski, S. G., Mahabal, A., et al. 2009,
ApJ, 696, 870, doi: 10.1088/0004-637X/696/1/870
Eldridge, J. J., Stanway, E. R., Xiao, L., et al. 2017, PASA,
34, e058, doi: 10.1017/pasa.2017.51
Elias-Rosa, N., Pastorello, A., Benetti, S., et al. 2016,
MNRAS, 463, 3894, doi: 10.1093/mnras/stw2253
Elias-Rosa, N., Benetti, S., Cappellaro, E., et al. 2018,
MNRAS, 475, 2614, doi: 10.1093/mnras/sty009
Fazio, G. G., Hora, J. L., Allen, L. E., et al. 2004, ApJS,
154, 10, doi: 10.1086/422843
Filippenko, A. V. 1997, ARA&A, 35, 309,
doi: 10.1146/annurev.astro.35.1.309
—. 2000, IAUC, 7421, 3
Foley, R. J., Berger, E., Fox, O., et al. 2011, ApJ, 732, 32,
doi: 10.1088/0004-637X/732/1/32
Fox, D. W., Lewin, W. H. G., Fabian, A., et al. 2000,
MNRAS, 319, 1154,
doi: 10.1046/j.1365-8711.2000.03941.x
Fox, O. D., Chevalier, R. A., Dwek, E., et al. 2010, ApJ,
725, 1768, doi: 10.1088/0004-637X/725/2/1768
Fox, O. D., Chevalier, R. A., Skrutskie, M. F., et al. 2011,
ApJ, 741, 7, doi: 10.1088/0004-637X/741/1/7
Fransson, C., Chevalier, R. A., Filippenko, A. V., et al.
2002, ApJ, 572, 350, doi: 10.1086/340295
Fraser, M., Inserra, C., Jerkstrand, A., et al. 2013, Monthly
Notices of the Royal Astronomical Society, 433, 1312,
doi: 10.1093/mnras/stt813
22 Pessi et al.
Fraser, M., Inserra, C., Jerkstrand, A., et al. 2013,
MNRAS, 433, 1312, doi: 10.1093/mnras/stt813
Fraser, M., Kotak, R., Pastorello, A., et al. 2015, MNRAS,
453, 3886, doi: 10.1093/mnras/stv1919
Fraser, M., Stritzinger, M. D., Brennan, S. J., et al. 2021,
arXiv e-prints, arXiv:2108.07278.
https://arxiv.org/abs/2108.07278
Freedman, W. L., & Carnegie Supernova Project. 2005, in
Astronomical Society of the Pacific Conference Series,
Vol. 339, Observing Dark Energy, ed. S. C. Wolff & T. R.
Lauer, 50. https://arxiv.org/abs/astro-ph/0411176
Gal-Yam, A., & Leonard, D. C. 2009, Nature, 458, 865,
doi: 10.1038/nature07934
Gal-Yam, A., Yaron, O., Pastorello, A., et al. 2021,
Transient Name Server AstroNote, 76, 1
Gal-Yam, A., Leonard, D. C., Fox, D. B., et al. 2007, ApJ,
656, 372, doi: 10.1086/510523
Goranskij, V. P., Barsukova, E. A., Valeev, A. F., et al.
2016, Astrophysical Bulletin, 71, 422,
doi: 10.1134/S1990341316040052
Graham, M. L., Sand, D. J., Valenti, S., et al. 2014, ApJ,
787, 163, doi: 10.1088/0004-637X/787/2/163
Graham, M. L., Bigley, A., Mauerhan, J. C., et al. 2017,
MNRAS, 469, 1559, doi: 10.1093/mnras/stx948
Hainich, R., Ruhling, U., Todt, H., et al. 2014, A&A, 565,
A27, doi: 10.1051/0004-6361/201322696
Hamuy, M., Folatelli, G., Morrell, N. I., et al. 2006, PASP,
118, 2, doi: 10.1086/500228
Heger, A., Fryer, C. L., Woosley, S. E., Langer, N., &
Hartmann, D. H. 2003, ApJ, 591, 288,
doi: 10.1086/375341
Ivezic, Z., & Elitzur, M. 1997, MNRAS, 287, 799,
doi: 10.1093/mnras/287.4.799
Kangas, T., Portinari, L., Mattila, S., et al. 2017, A&A,
597, A92, doi: 10.1051/0004-6361/201628705
Kashi, A., Soker, N., & Moskovitz, N. 2013, MNRAS, 436,
2484, doi: 10.1093/mnras/stt1742
Katsuda, S., Maeda, K., Nozawa, T., Pooley, D., & Immler,
S. 2014, ApJ, 780, 184,
doi: 10.1088/0004-637X/780/2/184
Kennicutt, Robert C., J. 1998, ARA&A, 36, 189,
doi: 10.1146/annurev.astro.36.1.189
Kilpatrick, C. D., Foley, R. J., Drout, M. R., et al. 2018,
MNRAS, 473, 4805, doi: 10.1093/mnras/stx2675
Kochanek, C. S. 2011, ApJ, 741, 37,
doi: 10.1088/0004-637X/741/1/37
Kochanek, C. S., Szczygie l, D. M., & Stanek, K. Z. 2012,
ApJ, 758, 142, doi: 10.1088/0004-637X/758/2/142
Kourkchi, E., Courtois, H. M., Graziani, R., et al. 2020, AJ,
159, 67, doi: 10.3847/1538-3881/ab620e
Krisciunas, K., Contreras, C., Burns, C. R., et al. 2017, AJ,
154, 211, doi: 10.3847/1538-3881/aa8df0
Kuncarayakti, H., Anderson, J. P., Galbany, L., et al. 2018,
A&A, 613, A35, doi: 10.1051/0004-6361/201731923
Langer, N. 2012, ARA&A, 50, 107,
doi: 10.1146/annurev-astro-081811-125534
Leonard, D. C., Filippenko, A. V., Barth, A. J., &
Matheson, T. 2000, ApJ, 536, 239, doi: 10.1086/308910
Levesque, E. M., Berger, E., Kewley, L. J., & Bagley, M. M.
2010, AJ, 139, 694, doi: 10.1088/0004-6256/139/2/694
Levesque, E. M., Stringfellow, G. S., Ginsburg, A. G.,
Bally, J., & Keeney, B. A. 2014, AJ, 147, 23,
doi: 10.1088/0004-6256/147/1/23
Margutti, R., Milisavljevic, D., Soderberg, A. M., et al.
2014, ApJ, 780, 21, doi: 10.1088/0004-637X/780/1/21
Mateus, A., Sodre, L., Cid Fernandes, R., et al. 2006,
MNRAS, 370, 721, doi: 10.1111/j.1365-2966.2006.10565.x
Mathis, J. S., Rumpl, W., & Nordsieck, K. H. 1977, ApJ,
217, 425, doi: 10.1086/155591
Mauerhan, J., Williams, G. G., Smith, N., et al. 2014,
MNRAS, 442, 1166, doi: 10.1093/mnras/stu730
Mauerhan, J. C., Smith, N., Filippenko, A. V., et al. 2013,
MNRAS, 430, 1801, doi: 10.1093/mnras/stt009
Maza, J., Hamuy, M., Antezana, R., et al. 2009, Central
Bureau Electronic Telegrams, 1928, 1
Monard, L. A. G., Prieto, J. L., & Seth, K. 2011, Central
Bureau Electronic Telegrams, 2799, 1
Morgan, F. 2020, R. Soc. open sci, 200467,
doi: http://doi.org/10.1098/rsos.200467
Moriya, T., Tominaga, N., Tanaka, M., et al. 2010, ApJ,
719, 1445, doi: 10.1088/0004-637X/719/2/1445
Moriya, T. J. 2015, ApJL, 803, L26,
doi: 10.1088/2041-8205/803/2/L26
Nicholl, M. 2018, Research Notes of the American
Astronomical Society, 2, 230,
doi: 10.3847/2515-5172/aaf799
Nyholm, A., Sollerman, J., Tartaglia, L., et al. 2020, A&A,
637, A73, doi: 10.1051/0004-6361/201936097
Ofek, E. O., Sullivan, M., Cenko, S. B., et al. 2013, Nature,
494, 65, doi: 10.1038/nature11877
Ofek, E. O., Sullivan, M., Shaviv, N. J., et al. 2014, ApJ,
789, 104, doi: 10.1088/0004-637X/789/2/104
Pastorello, A., Smartt, S. J., Mattila, S., et al. 2007,
Nature, 447, 829, doi: 10.1038/nature05825
Pastorello, A., Mattila, S., Zampieri, L., et al. 2008,
MNRAS, 389, 113, doi: 10.1111/j.1365-2966.2008.13602.x
Pastorello, A., Botticella, M. T., Trundle, C., et al. 2010,
MNRAS, 408, 181, doi: 10.1111/j.1365-2966.2010.17142.x
Pastorello, A., Pumo, M. L., Navasardyan, H., et al. 2012,
A&A, 537, A141, doi: 10.1051/0004-6361/201118112
SN 2011fh 23
Pastorello, A., Cappellaro, E., Inserra, C., et al. 2013, ApJ,
767, 1, doi: 10.1088/0004-637X/767/1/1
Pastorello, A., Kochanek, C. S., Fraser, M., et al. 2017,
Monthly Notices of the Royal Astronomical Society, 474,
197, doi: 10.1093/mnras/stx2668
Pastorello, A., Reguitti, A., Morales-Garoffolo, A., et al.
2019, A&A, 628, A93, doi: 10.1051/0004-6361/201935420
Paturel, G., Theureau, G., Bottinelli, L., et al. 2003, A&A,
412, 57, doi: 10.1051/0004-6361:20031412
Paxton, B., Bildsten, L., Dotter, A., et al. 2011, ApJS, 192,
3, doi: 10.1088/0067-0049/192/1/3
Paxton, B., Cantiello, M., Arras, P., et al. 2013, ApJS, 208,
4, doi: 10.1088/0067-0049/208/1/4
Paxton, B., Marchant, P., Schwab, J., et al. 2015, ApJS,
220, 15, doi: 10.1088/0067-0049/220/1/15
Paxton, B., Schwab, J., Bauer, E. B., et al. 2018, ApJS,
234, 34, doi: 10.3847/1538-4365/aaa5a8
Phillips, M. M., Contreras, C., Hsiao, E. Y., et al. 2019,
PASP, 131, 014001, doi: 10.1088/1538-3873/aae8bd
Pooley, D., Lewin, W. H. G., Fox, D. W., et al. 2002, ApJ,
572, 932, doi: 10.1086/340346
Prieto, J. L., Brimacombe, J., Drake, A. J., & Howerton, S.
2013, ApJL, 763, L27, doi: 10.1088/2041-8205/763/2/L27
Prieto, J. L., & Seth, K. 2011, Central Bureau Electronic
Telegrams, 2799, 2
Prieto, J. L., Kistler, M. D., Thompson, T. A., et al. 2008,
ApJL, 681, L9, doi: 10.1086/589922
Prieto, J. L., Rest, A., Bianco, F. B., et al. 2014, ApJL,
787, L8, doi: 10.1088/2041-8205/787/1/L8
Quataert, E., Fernandez, R., Kasen, D., Klion, H., &
Paxton, B. 2016, MNRAS, 458, 1214,
doi: 10.1093/mnras/stw365
Quataert, E., & Shiode, J. 2012, MNRAS, 423, L92,
doi: 10.1111/j.1745-3933.2012.01264.x
Ransome, C. L., Habergham-Mawson, S. M., Darnley,
M. J., et al. 2021, MNRAS, 506, 4715,
doi: 10.1093/mnras/stab1938
Rest, A., Prieto, J. L., Walborn, N. R., et al. 2012, Nature,
482, 375, doi: 10.1038/nature10775
Sana, H., de Mink, S. E., de Koter, A., et al. 2012, Science,
337, 444, doi: 10.1126/science.1223344
Schechter, P. L., Mateo, M., & Saha, A. 1993, PASP, 105,
1342, doi: 10.1086/133316
Schlafly, E. F., & Finkbeiner, D. P. 2011, ApJ, 737, 103,
doi: 10.1088/0004-637X/737/2/103
Schlegel, E. M. 1990, MNRAS, 244, 269
Shiode, J. H., & Quataert, E. 2014, ApJ, 780, 96,
doi: 10.1088/0004-637X/780/1/96
Simcoe, R. A., Burgasser, A. J., Schechter, P. L., et al.
2013, PASP, 125, 270, doi: 10.1086/670241
Smith, N. 2006, ApJ, 644, 1151, doi: 10.1086/503766
—. 2013, MNRAS, 429, 2366, doi: 10.1093/mnras/sts508
—. 2014, ARA&A, 52, 487,
doi: 10.1146/annurev-astro-081913-040025
—. 2017, Interacting Supernovae: Types IIn and Ibn
(Springer), 403, doi: 10.1007/978-3-319-21846-5 38
Smith, N., Andrews, J. E., & Mauerhan, J. C. 2016a,
MNRAS, 463, 2904, doi: 10.1093/mnras/stw2190
Smith, N., Andrews, J. E., Mauerhan, J. C., et al. 2016b,
MNRAS, 455, 3546, doi: 10.1093/mnras/stv2507
Smith, N., & Arnett, W. D. 2014, ApJ, 785, 82,
doi: 10.1088/0004-637X/785/2/82
Smith, N., & Frew, D. J. 2011, MNRAS, 415, 2009,
doi: 10.1111/j.1365-2966.2011.18993.x
Smith, N., Gehrz, R. D., Hinz, P. M., et al. 2003, AJ, 125,
1458, doi: 10.1086/346278
Smith, N., Li, W., Silverman, J. M., Ganeshalingam, M., &
Filippenko, A. V. 2011, MNRAS, 415, 773,
doi: 10.1111/j.1365-2966.2011.18763.x
Smith, N., Mauerhan, J. C., Kasliwal, M. M., & Burgasser,
A. J. 2013, MNRAS, 434, 2721,
doi: 10.1093/mnras/stt944
Smith, N., Mauerhan, J. C., & Prieto, J. L. 2014, MNRAS,
438, 1191, doi: 10.1093/mnras/stt2269
Smith, N., Ganeshalingam, M., Chornock, R., et al. 2009,
ApJL, 697, L49, doi: 10.1088/0004-637X/697/1/L49
Smith, N., Miller, A., Li, W., et al. 2010, AJ, 139, 1451,
doi: 10.1088/0004-6256/139/4/1451
Smith, N., Andrews, J. E., Rest, A., et al. 2018a, MNRAS,
480, 1466, doi: 10.1093/mnras/sty1500
Smith, N., Rest, A., Andrews, J. E., et al. 2018b, MNRAS,
480, 1457, doi: 10.1093/mnras/sty1479
Stanway, E. R., & Eldridge, J. J. 2018, MNRAS, 479, 75,
doi: 10.1093/mnras/sty1353
Stevance, H., Eldridge, J., & Stanway, E. 2020, The
Journal of Open Source Software, 5, 1987,
doi: 10.21105/joss.01987
Stritzinger, M. D., Taddia, F., Fraser, M., et al. 2020,
A&A, 639, A103, doi: 10.1051/0004-6361/202038018
Strotjohann, N. L., Ofek, E. O., Gal-Yam, A., et al. 2021,
ApJ, 907, 99, doi: 10.3847/1538-4357/abd032
Sukhbold, T., Ertl, T., Woosley, S. E., Brown, J. M., &
Janka, H. T. 2016, ApJ, 821, 38,
doi: 10.3847/0004-637X/821/1/38
Szalai, T., Zsıros, S., Fox, O. D., Pejcha, O., & Muller, T.
2019, ApJS, 241, 38, doi: 10.3847/1538-4365/ab10df
Szalai, T., Fox, O. D., Arendt, R. G., et al. 2021, arXiv
e-prints, arXiv:2106.12427.
https://arxiv.org/abs/2106.12427
24 Pessi et al.
Szczygie l, D. M., Kochanek, C. S., & Dai, X. 2012, ApJ,
760, 20, doi: 10.1088/0004-637X/760/1/20
Taddia, F., Stritzinger, M. D., Sollerman, J., et al. 2013,
A&A, 555, A10, doi: 10.1051/0004-6361/201321180
Taddia, F., Sollerman, J., Fremling, C., et al. 2015, A&A,
580, A131, doi: 10.1051/0004-6361/201525989
Thoene, C., de Ugarte Postigo, A., Leloudas, G., Cano, Z.,
& Maeda, K. 2015, The Astronomer’s Telegram, 8417, 1
Thompson, T. A., Prieto, J. L., Stanek, K. Z., et al. 2009,
ApJ, 705, 1364, doi: 10.1088/0004-637X/705/2/1364
Thone, C. C., de Ugarte Postigo, A., Leloudas, G., et al.
2017, A&A, 599, A129,
doi: 10.1051/0004-6361/201629968
Van Dyk, S. D., Peng, C. Y., King, J. Y., et al. 2000,
PASP, 112, 1532, doi: 10.1086/317727
van Dyk, S. D., Weiler, K. W., Sramek, R. A., & Panagia,
N. 1993, ApJL, 419, L69, doi: 10.1086/187139
Wagner, R. M., Vrba, F. J., Henden, A. A., et al. 2004,
PASP, 116, 326, doi: 10.1086/382997
Williams, B. F., Lang, D., Dalcanton, J. J., et al. 2014,
ApJS, 215, 9, doi: 10.1088/0067-0049/215/1/9
Williams, C. L., Panagia, N., Van Dyk, S. D., et al. 2002,
ApJ, 581, 396, doi: 10.1086/344087
Woosley, S. E., Blinnikov, S., & Heger, A. 2007, Nature,
450, 390, doi: 10.1038/nature06333
SN 2011fh 25
APPENDIX
A. CONTAMINATION
SN 2011fh is located in a relatively crowded region of the galaxy NGC 4806, with several bright stars near it (see
Figure 5). These stars lie within 150 pc (1′′) around SN 2011fh, with several more bright sources within 300 pc
(2′′). Since the pixel scale of the pre SN observations were limited up to 2′′, we decided to estimate the possible
contamination of the stellar cluster to our photometric measurements.
To quantify the amount of contamination in the optical bands, we first performed aperture photometry of the stars
around SN 2011fh in the HST F336W and F814W images, using the Astropy (Astropy Collaboration et al. 2013, 2018)
package Photutils in a 2′′ region. After subtracting the flux of SN 2011fh, we obtained a contribution from the stars
in this aperture of 20.67 and 20.05 mag, in the F336W and F814W filters, respectively. By assuming a flat spectrum
for the stellar cluster, we then interpolated between the F336W and F814W filter fluxes and performed synthetic
photometry in the resulting line with PYPHOT8, to obtain the estimates of V ≈ 20.17, r ≈ 20.18, and i ≈ 20.18. If we
compare these values with the PSF photometry of SN 2011fh presented in Tables 1 and 2, the estimated contribution
from the cluster is significantly lower than the flux of SN 2011fh throughout its photometric evolution. ]
B. TABLES
Table 1. Amateur astronomers data and CRTS r-
band photometry of SN 2011fh
UT Date JD r
(mag) (error)
(1) (2) (3) (4)
2007-1-25 2454126.20298 17.879 0.12
2007-2-22 2454154.20024 17.988 0.13
2007-3-9 2454169.17404 18.272 0.178
2007-3-27 2454187.19841 17.961 0.125
2007-4-6 2454197.17815 18.547 0.25
2007-4-16 2454207.0734 18.184 0.16
2007-5-7 2454228.04447 18.278 0.177
2007-5-14 2454235.05647 18.097 0.143
2007-6-16 2454267.97322 17.943 0.131
2007-7-4 2454285.85462 17.999 0.134
2007-7-20 2454301.85781 18.232 0.166
2007-8-12 2454324.88361 17.985 0.129
2007-12-28 2454463.18063 18.09 0.136
2008-1-22 2454488.1978 18.273 0.182
2008-2-7 2454504.25914 18.057 0.135
2008-2-8 2454505.25765 18.121 0.148
2008-2-29 2454526.17647 17.988 0.135
2008-3-11 2454537.18612 18.286 0.179
Table 1 continued
8 https://mfouesneau.github.io/docs/pyphot/
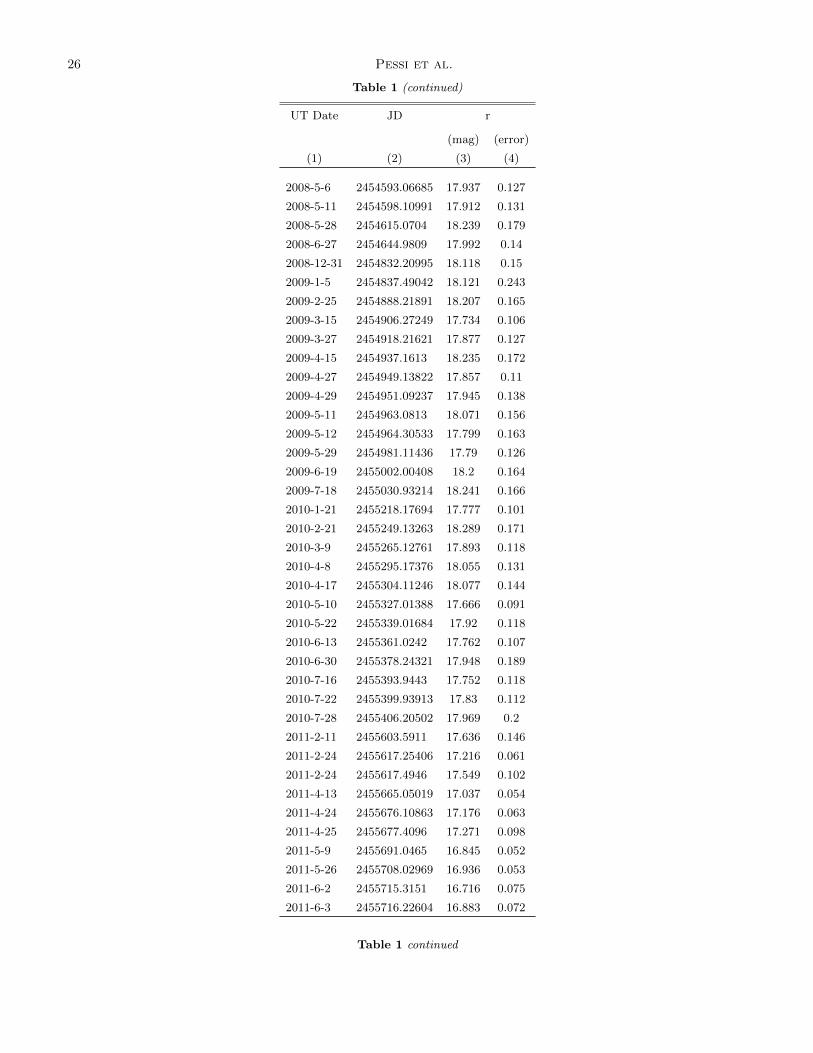
26 Pessi et al.
Table 1 (continued)
UT Date JD r
(mag) (error)
(1) (2) (3) (4)
2008-5-6 2454593.06685 17.937 0.127
2008-5-11 2454598.10991 17.912 0.131
2008-5-28 2454615.0704 18.239 0.179
2008-6-27 2454644.9809 17.992 0.14
2008-12-31 2454832.20995 18.118 0.15
2009-1-5 2454837.49042 18.121 0.243
2009-2-25 2454888.21891 18.207 0.165
2009-3-15 2454906.27249 17.734 0.106
2009-3-27 2454918.21621 17.877 0.127
2009-4-15 2454937.1613 18.235 0.172
2009-4-27 2454949.13822 17.857 0.11
2009-4-29 2454951.09237 17.945 0.138
2009-5-11 2454963.0813 18.071 0.156
2009-5-12 2454964.30533 17.799 0.163
2009-5-29 2454981.11436 17.79 0.126
2009-6-19 2455002.00408 18.2 0.164
2009-7-18 2455030.93214 18.241 0.166
2010-1-21 2455218.17694 17.777 0.101
2010-2-21 2455249.13263 18.289 0.171
2010-3-9 2455265.12761 17.893 0.118
2010-4-8 2455295.17376 18.055 0.131
2010-4-17 2455304.11246 18.077 0.144
2010-5-10 2455327.01388 17.666 0.091
2010-5-22 2455339.01684 17.92 0.118
2010-6-13 2455361.0242 17.762 0.107
2010-6-30 2455378.24321 17.948 0.189
2010-7-16 2455393.9443 17.752 0.118
2010-7-22 2455399.93913 17.83 0.112
2010-7-28 2455406.20502 17.969 0.2
2011-2-11 2455603.5911 17.636 0.146
2011-2-24 2455617.25406 17.216 0.061
2011-2-24 2455617.4946 17.549 0.102
2011-4-13 2455665.05019 17.037 0.054
2011-4-24 2455676.10863 17.176 0.063
2011-4-25 2455677.4096 17.271 0.098
2011-5-9 2455691.0465 16.845 0.052
2011-5-26 2455708.02969 16.936 0.053
2011-6-2 2455715.3151 16.716 0.075
2011-6-3 2455716.22604 16.883 0.072
Table 1 continued
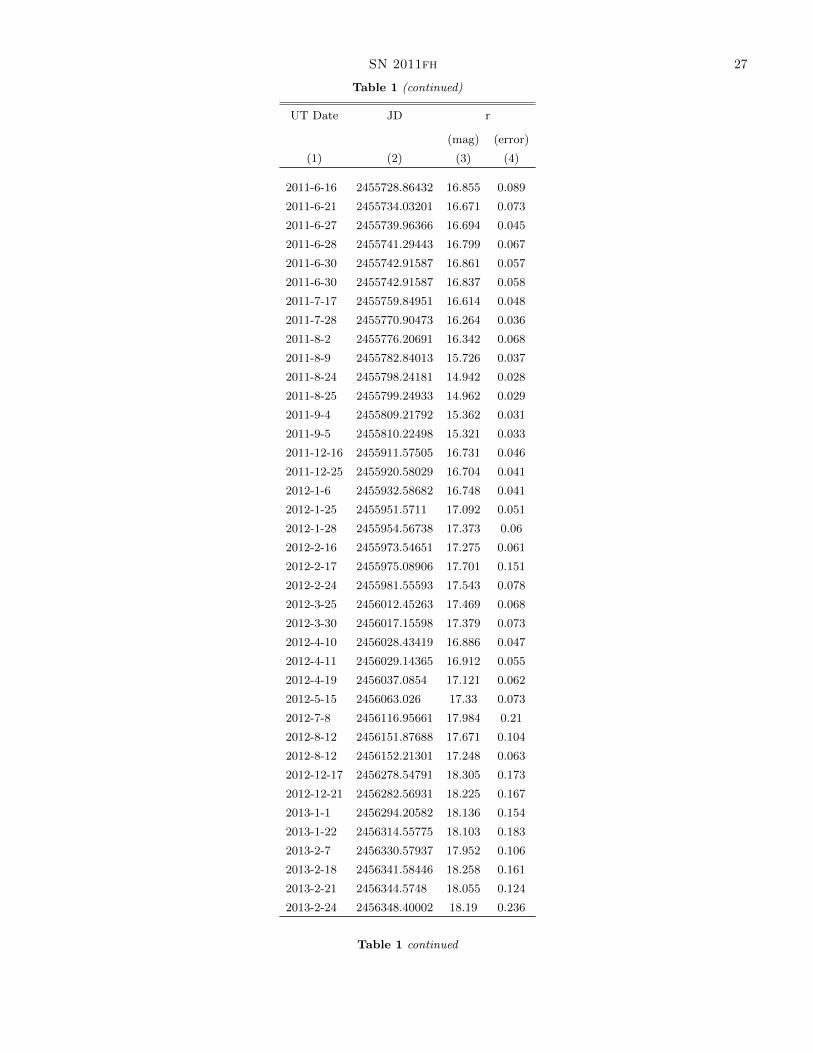
SN 2011fh 27
Table 1 (continued)
UT Date JD r
(mag) (error)
(1) (2) (3) (4)
2011-6-16 2455728.86432 16.855 0.089
2011-6-21 2455734.03201 16.671 0.073
2011-6-27 2455739.96366 16.694 0.045
2011-6-28 2455741.29443 16.799 0.067
2011-6-30 2455742.91587 16.861 0.057
2011-6-30 2455742.91587 16.837 0.058
2011-7-17 2455759.84951 16.614 0.048
2011-7-28 2455770.90473 16.264 0.036
2011-8-2 2455776.20691 16.342 0.068
2011-8-9 2455782.84013 15.726 0.037
2011-8-24 2455798.24181 14.942 0.028
2011-8-25 2455799.24933 14.962 0.029
2011-9-4 2455809.21792 15.362 0.031
2011-9-5 2455810.22498 15.321 0.033
2011-12-16 2455911.57505 16.731 0.046
2011-12-25 2455920.58029 16.704 0.041
2012-1-6 2455932.58682 16.748 0.041
2012-1-25 2455951.5711 17.092 0.051
2012-1-28 2455954.56738 17.373 0.06
2012-2-16 2455973.54651 17.275 0.061
2012-2-17 2455975.08906 17.701 0.151
2012-2-24 2455981.55593 17.543 0.078
2012-3-25 2456012.45263 17.469 0.068
2012-3-30 2456017.15598 17.379 0.073
2012-4-10 2456028.43419 16.886 0.047
2012-4-11 2456029.14365 16.912 0.055
2012-4-19 2456037.0854 17.121 0.062
2012-5-15 2456063.026 17.33 0.073
2012-7-8 2456116.95661 17.984 0.21
2012-8-12 2456151.87688 17.671 0.104
2012-8-12 2456152.21301 17.248 0.063
2012-12-17 2456278.54791 18.305 0.173
2012-12-21 2456282.56931 18.225 0.167
2013-1-1 2456294.20582 18.136 0.154
2013-1-22 2456314.55775 18.103 0.183
2013-2-7 2456330.57937 17.952 0.106
2013-2-18 2456341.58446 18.258 0.161
2013-2-21 2456344.5748 18.055 0.124
2013-2-24 2456348.40002 18.19 0.236
Table 1 continued
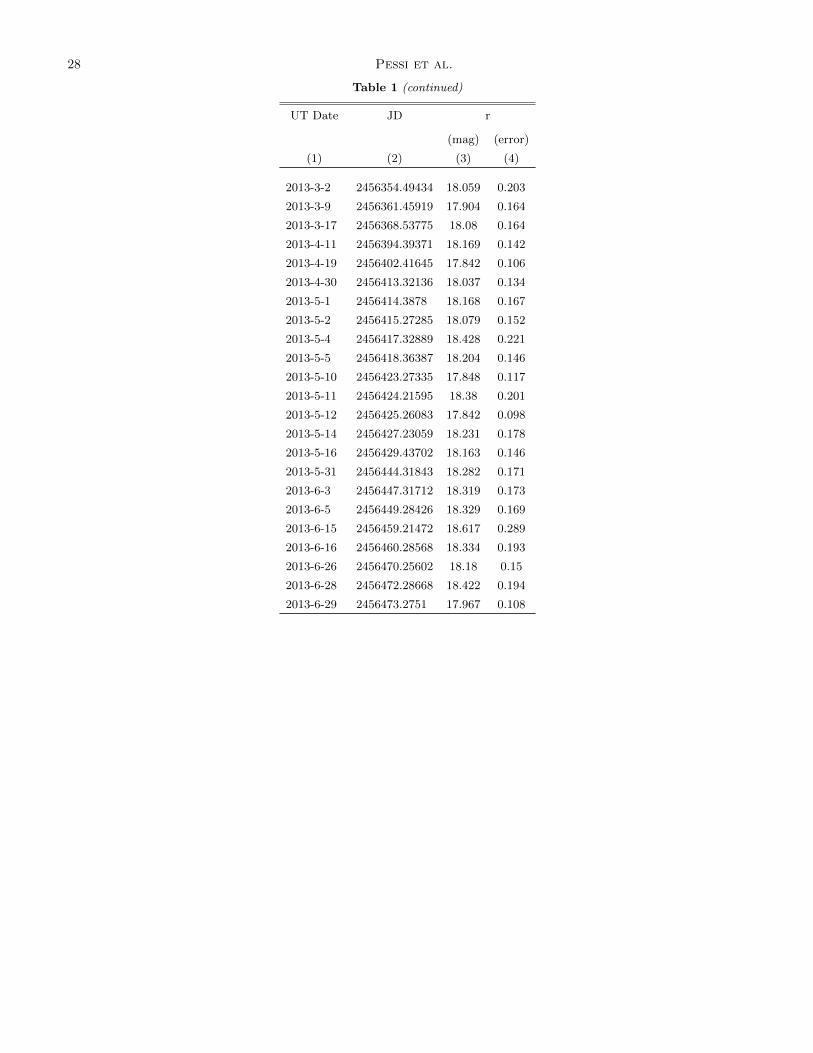
28 Pessi et al.
Table 1 (continued)
UT Date JD r
(mag) (error)
(1) (2) (3) (4)
2013-3-2 2456354.49434 18.059 0.203
2013-3-9 2456361.45919 17.904 0.164
2013-3-17 2456368.53775 18.08 0.164
2013-4-11 2456394.39371 18.169 0.142
2013-4-19 2456402.41645 17.842 0.106
2013-4-30 2456413.32136 18.037 0.134
2013-5-1 2456414.3878 18.168 0.167
2013-5-2 2456415.27285 18.079 0.152
2013-5-4 2456417.32889 18.428 0.221
2013-5-5 2456418.36387 18.204 0.146
2013-5-10 2456423.27335 17.848 0.117
2013-5-11 2456424.21595 18.38 0.201
2013-5-12 2456425.26083 17.842 0.098
2013-5-14 2456427.23059 18.231 0.178
2013-5-16 2456429.43702 18.163 0.146
2013-5-31 2456444.31843 18.282 0.171
2013-6-3 2456447.31712 18.319 0.173
2013-6-5 2456449.28426 18.329 0.169
2013-6-15 2456459.21472 18.617 0.289
2013-6-16 2456460.28568 18.334 0.193
2013-6-26 2456470.25602 18.18 0.15
2013-6-28 2456472.28668 18.422 0.194
2013-6-29 2456473.2751 17.967 0.108
SN 2011fh 29
Table 2. BV ri-CSP2 photometry of SN 2011fh
UT Date JD B V r i
(mag) (error) (mag) (error) (mag) (error) (mag) (error)
(1) (2) (3) (4) (5) (6) (7) (8) (9) (10)
2013-2-20 2456343.85 18.843 0.0215 18.493 0.0173 18.063 0.0132 18.4135 0.0151
2013-3-3 2456354.78 18.8695 0.0226 18.5055 0.0193 18.0805 0.0142 18.41 0.0185
2013-3-15 2456366.71 18.9345 0.0244 18.576 0.0193 18.1375 0.0154 18.5 0.0202
2013-3-18 2456369.91 - - - - 18.15 0.0155 18.407 0.0324
2013-3-25 2456376.76 - - - - 18.155 0.0146 18.529 0.0213
2013-4-5 2456387.68 18.913 0.0193 18.573 0.0195 18.1565 0.0132 18.525 0.0171
2013-4-20 2456402.73 18.962 0.0265 18.5725 0.0244 18.193 0.0182 18.522 0.0324
2013-5-4 2456416.68 19.1855 0.0273 18.8505 0.0245 18.1565 0.0132 18.816 0.0232
2013-5-12 2456424.75 19.103 0.0233 18.795 0.0243 18.3765 0.0151 18.795 0.0251
2013-6-1 2456444.68 19.046 0.0254 - - 18.341 0.0192 18.717 0.0291
2015-3-16 2457097.76 19.7675 0.0205 19.559 0.0165 18.341 0.0192 19.558 0.0177
2015-3-18 2457099.80 19.883 0.0266 19.5225 0.0167 - - - -
2016-1-14 2457401.80 19.625 0.0341 19.3705 0.0306 19.229 0.0342 19.475 0.03815
Table 3. Y JH-CSP2 photometry of SN 2011fh
UT Date JD Y J H
(mag) (error) (mag) (error) (mag) (error)
(1) (2) (3) (4) (5) (6) (7) (8)
2013-2-23 2456346.86 17.62 0.031 - - - -
2013-2-27 2456350.81 17.58 0.03 17.457 0.026 17.19 0.037
2013-3-26 2456377.75 17.75 0.023 17.649 0.021 - -
2015-4-30 2457142.58 18.865 0.044 18.833 0.051 18.491 0.0788
2016-3-27 2457474.70 18.575 0.075 18.64 0.085 18.25 0.113
2017-5-16 2457889.50 18.208 0.043 - - - -
30 Pessi et al.
Table 5. Spitzer photometry of SN 2011fh
UT Date JD Channel 1 (3.6 µm) Channel 2 (4.5 µm)
(mag) (error) (mag) (error)
(1) (2) (3) (4) (5) (6)
2009-8-6 2455050.094 16.019 0.047 15.686 0.045
2009-9-5 2455080.09 16.142 0.043 15.77 0.047
2013-3-31 2456383.113 15.899 0.045 15.024 0.04
2014-4-4 2456752.49 16.27 0.048 15.572 0.04
2014-9-12 2456913.073 16.228 0.059 15.492 0.045
2014-10-12 2456943.206 16.24 0.052 15.529 0.044
2015-5-16 2457158.625 16.265 0.052 15.64 0.045