1 monitoring of crop growth and development conditions in romania using integrated weather and...
TRANSCRIPT

1
Monitoring of crop growth and development conditions in Romania using integrated
weather and satellite-derived data
Dr. G. STANCALIE, Dr. A. MARICA, Dr. E. SAVIN,
A. NERTAN, C. FLUERARU National Meteorological Administration
Bucharest, RomaniaCAgM Expert Team on Weather, Climate and Farmer, Geneva, 15 - 18
November 2004

2
IntroductionIntroduction
The agrometeorological activity undergoing within National Meteorological Administration (NMA), integrates complex issues concerning the current and future evolution of the vegetation state of the crops and water supply of soils with respect to the meteorological parameters evolution, being a particularly important activity whose final objective is to elaborate/edit the agrometeorological bulletins and disseminate information at the level of the decision making factors in agriculture and private farmers.
Since orbital sensing technologies have undergone unprecedented development, the use of multispectral satellite data in conjunction with traditional means is able to ensure the improvement of the classical determination methods of the agrometeorological parameters, greatly contributing to improve management of agrometeorological phenomena, like the drought. The paper presents the important modernization achievements of the Romanian meteorological infrastructure, obtained by the implementation of the National Integrated Meteorological System (SIMIN project) and the development trend of the Romanian agrometeorological monitoring system. The new possibilities for the monitoring of crop growth and development conditions based on integrated weather and satellite-derived data are also presented.

3
The Actual Romanian The Actual Romanian Agrometeorological Monitoring SystemAgrometeorological Monitoring System
AGROMONITORING- Module of reception, selection and extraction of meteorological data for interested stations and parameters (Synop Programme)- Module of high processing of data on information structures (air temperatures, soil temperatures, precipitations, evapotranspiration, soil humidity);- Module of data storing and manipulation used as input for agrometeorological- models
Processed data (outputs):- Agrometeorological indices (thermal and hydric)- Monotoring of the vegetation state of the crops - Dynamic of the soil humidity (deficits/excess)
- Potential and real evapotranspiration - Elaboration/editing agrometeorological bulletins
Agrometeorological stations
- Primary data:- Agro-meteo observations and measurements. - Automatic data pick-up - Data primary processing
Meteorological stations Sinoptic/Automatic
- Air temperatures min./max. - Precipitations, - Relative humidity- Sunshine duration- Wind speed
Real-time monitoring of meteorological and agrometeorological
parameters
ServerMeteorological database
(Oracle)
ServerAgrometeorological
database
DISEMINATION

4
The improved integrated support system for the agrometeorological warning and the identification
of the areas with agricultural risk in Romania
In the last period an important modernization of the Romanian meteorological infrastructure, based on high technology, has been achieved by the implementation of the National Integrated Meteorological System (SIMIN project), conceived as an integrated system, receiving and processing the data coming from multiple observation sub-systems (surface, radar, satellite sub-systems, etc.) and a lot of types of equipment. Within this project several systems with major significance have been provided: meteorological DOPPLER Radar Network, automatic Weather Network, lightning detection network, satellite reception stations for Meteosat Second Generation, telecommunication networks, visualization system (Nex-REAP) integrating all available information, etc.
The main benefit of this investment is relevant for weather forecasting, allowing the detection, surveillance and anticipation of severe meteorological phenomena, which have also an important impact on the agriculture. SIMIN includes a quasi-real time dissemination components of the meteorological information, so that the local authorities and the other users could be promptly informed about the occurrence of severe meteorological events, being able to take, in time, the necessary steps to avoid disasters and damages.

5Highly motivated decisionsHighly motivated decisions
Avoiding parallel expensesAvoiding parallel expensesA useful systemA useful system
Infrastructure improvementInfrastructure improvementA major contributionA major contribution
High precisionHigh precision
Prompt detectionPrompt detection
Efficient anticipationEfficient anticipation
Permanent surveillancePermanent surveillance
Extended parametricsExtended parametrics
Hazard reducingHazard reducingA vital serviceA vital service
Performance and reliability growthPerformance and reliability growthA national demandA national demand
Life and property protectionLife and property protectionA public interestA public interest
GENERAL GENERAL OBJECTIVESOBJECTIVES

6
Module 1: Module 1: Surface measurement networkSurface measurement networkModule 1: Module 1: Surface measurement networkSurface measurement network
LEGEND
Weather station
Automatic weather stationSIMIN automatic weather station
60 new automatic weather stations, out of which 46 with soil
temperature sensors
COMPONENTSCOMPONENTS
53 weather stations with agrometeorological
program

7
Module 3: Module 3: Satellite numerical dataSatellite numerical dataModule 3: Module 3: Satellite numerical dataSatellite numerical data
COMPONENTSCOMPONENTS
METEOSAT/NOAA data METEOSAT/NOAA data reception and processing stationreception and processing station
• MET 7 (operational program )MET 7 (operational program )
• MSG (next generation)MSG (next generation)
METEOSAT/NOAA data METEOSAT/NOAA data reception and processing stationreception and processing station
• MET 7 (operational program )MET 7 (operational program )
• MSG (next generation)MSG (next generation)
BucharestBucharest
• Continue data (Continue data (5 Km resolution5 Km resolution))• Continue data (Continue data (5 Km resolution5 Km resolution))
• Permanent data (every 30 min)Permanent data (every 30 min)• Permanent data (every 30 min)Permanent data (every 30 min)
• Panoramic (hemispheric) dataPanoramic (hemispheric) data• Panoramic (hemispheric) dataPanoramic (hemispheric) data
• Multispectral (3 channel) dataMultispectral (3 channel) data• Multispectral (3 channel) dataMultispectral (3 channel) data
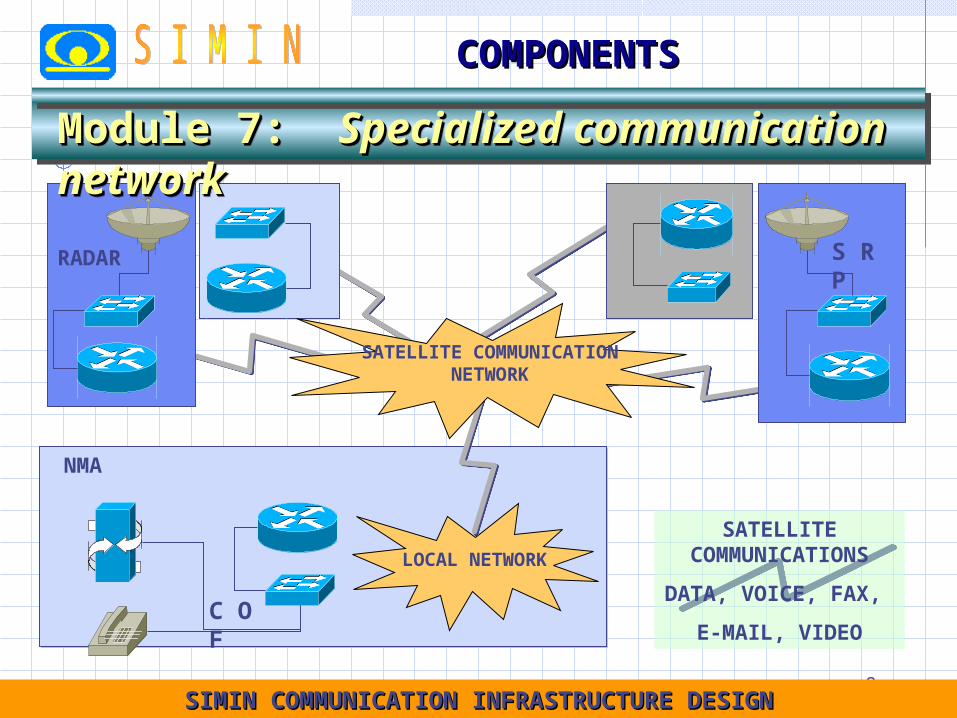
8SIMIN COMMUNICATION INFRASTRUCTURE DESIGNSIMIN COMMUNICATION INFRASTRUCTURE DESIGN
NMA
SATELLITE COMMUNICATIONS
DATA, VOICE, FAX,
E-MAIL, VIDEO
Module 7: Module 7: Specialized communication networkSpecialized communication networkModule 7: Module 7: Specialized communication networkSpecialized communication network
LOCAL NETWORK
SATELLITE COMMUNICATION
NETWORK
RADAR S R P
C O F
COMPONENTSCOMPONENTS

9
National Forecasting Centre
- Bucharest - ROU
Regional Forecasting Centres
- Bucharest - MUN - Constanta - DOB - Bacau - MOL - Cluj - TRN - Sibiu - TRS - Arad - BAC - Craiova - OLT
MUN
TRN
DOBOLT
TRS
BACMOL
Bucharest
Module 6.1: Module 6.1: Forecasting networkForecasting networkModule 6.1: Module 6.1: Forecasting networkForecasting network
11 T
MS an
d 41 C
MS
11 T
MS an
d 41 C
MS
connec
tions
connec
tions
Territorial Meteorological Station (TMS) • County Meteorological Station (CMS)
COMPONENTSCOMPONENTS
10
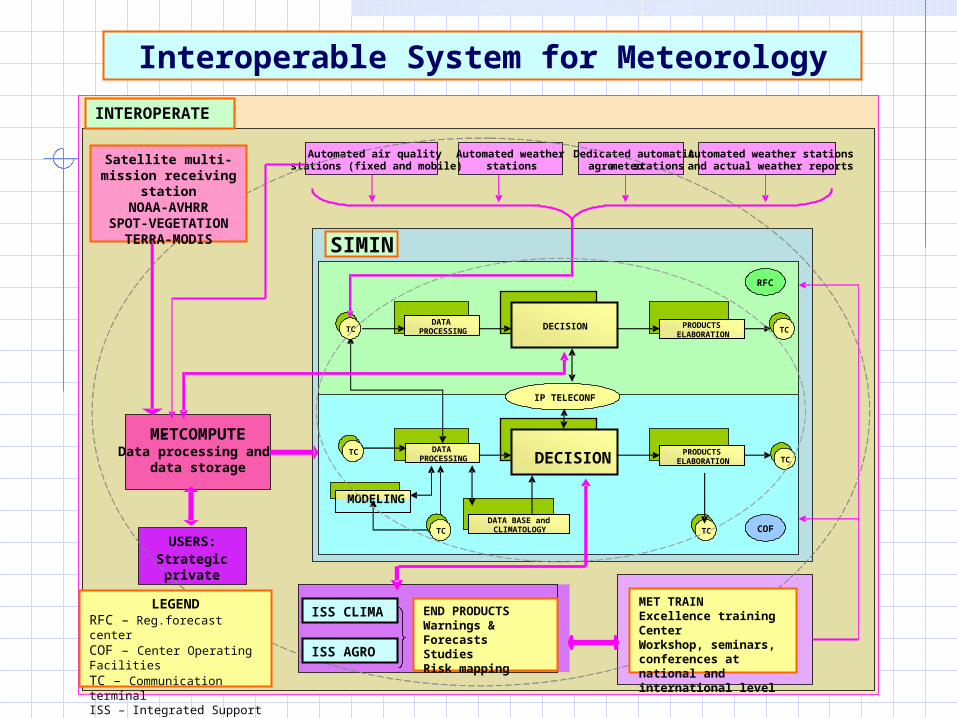
Interoperable System for Meteorology
DATA PROCESSING
DECISION PRODUCTS ELABORATION
IP TELECONF
COF
DATA PROCESSING DECISION PRODUCTS
ELABORATIONTC
TC
DATA BASE and CLIMATOLOGY
RFC
-METCOMPUTEData processing and
data storage
USERS:Strategicprivate
Automated weather stationsand actual weather reports
Automated weather stations
Dedicated automaticagro-meteostations
Automated air qualitystations (fixed and mobile)
TC
TC
MODELING
TC
TC
SIMIN
INTEROPERATE
ISS CLIMA
ISS AGRO
END PRODUCTSWarnings & ForecastsStudiesRisk mapping
MET TRAINExcellence training Center Workshop, seminars, conferences at national and international level
LEGENDRFC – Reg.forecast centerCOF – Center Operating FacilitiesTC – Communication terminalISS – Integrated Support System
Satellite multi-mission receiving stationNOAA-AVHRR
SPOT-VEGETATIONTERRA-MODIS

11
The information flowchart of the integrated support The information flowchart of the integrated support system for agrometeorological warning and system for agrometeorological warning and identification of agricultural hazard areasidentification of agricultural hazard areas
Satellite multi-mission receiving stationNOAA-AVHRRSPOT-VEGETATIONTERRA-MODIS
Agrometeorological Stations (fixed and mobile)
Automatic meteorological
stations
Regional Meteorological Centers
Subsystem for the management of the agrometeorological database
- Main function: data storage, analyzing and data updating. - The input data for the analysis procedures will allow to determine a certain number of hazard indicators of the territory in various agro-climatic conditions.
ServerUsers- strategic - private
Subsystem for the management of the thematic, cartographic database
-The GIS info-plans and the required information to a structural analysis of the territory.
-The GIS database can be personalized and completed through introducing new layers in view to update meta-data associated to each thematic info-plan.
Subsystem for displaying the structural vulnerability- Better knowledge of the agroclimatic vulnerability structure;- Crisis management and long term planning having in view the definition of the vulnerability context and its dynamics at various spatial scales (regional, national);- Elaborated results in map-drawing format.

12
Agrometeorological database interrogation

13
Useful Satellite Sensors Useful Satellite Sensors for Afor Agrometeorological
MonitoringMonitoring NOAA-AVHRR (optical, 4 or 5 channel, broad band scanner, visible to
thermal IR, 2400 km swath, 1 km at nadir); Terra/Aqua-MODIS (optical, 250 m, 1330 km swath, 36 spectral bands:
an imaging spectrometer, same orbit as Landsat 7, sees every point on Earth every 1-2 days);
SPOT/VEGETATION (Optical, 1km, broad band scanner, visible to near IR, spectral bands, synthesis 10-days products);
Landsat-ETM+ (optical, visible and near infrared (VNIR) bands - bands 1,2,3,4,and 8 (PAN) with a spectral range between 0.4 and 1.0 micrometer; 15 m (PAN only) and 30 m resolution, Swath width is 185 km);
Terra/Aqua-ASTER (optical, 10 m, 14 channels, swath of 60 km at nadir, spatial resolution: VNIR-15 m, SWIR-30 m, TIR-90 m).
MED
IUM
& H
IGH
RES
OLU
TIO
N
AMSR-E (radar, 6 frequency channels (6.9 to 89.0 GHz), spatial resolution 5.4 to 56 Km, swath 1445 Km); SeaWinds-QuikSCAT (Ku-band active radar scatterometer, resolution 25 km x 25 km, swath of 1800 km (for a vertical polarization at an incidence angle of 54o) or 1400 km (for a horizontal polarization at incidence angle of 46o), visit period every 2.5 days regardless of cloud cover.
CO
AR
SE
RE
SO
LUTIO
N

14
Assimilation of remotely sensed data into numerical prediction models (e.g. SWAT, crop models)
Prediction Monitoring and early warning Assessment of impacts for extreme meteo events
Land use type Intensity and areal extent Use of satellite data as input for crop model yield estimates.
Earth Observations from satellites are highly complementary to those collected by in-situ systems.
Satellites are often necessary for the provision of synoptic, wide-area coverage and provision of the frequent information required to put in-situ information into broader spatial monitoring of drought conditions.
CRAIOVA
00.5
11.5
22.5
33.5
44.5
55.5
ET
c (m
m/d
ay)
-50
-40
-30-20
-10
0
10
2030
40
50
Re
l. e
rro
r (%
)
ETc(CROPWAT)
ETc(RS)
Rel. error (%).
Satellite – Derived Information for Satellite – Derived Information for Agricultural MonitoringAgricultural Monitoring
15
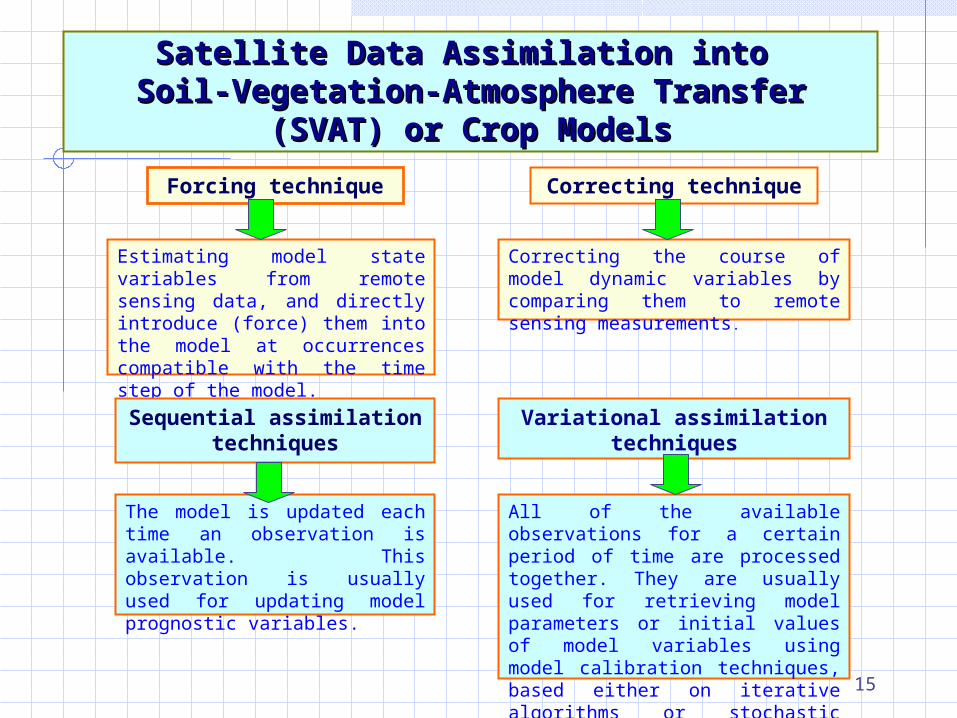
Satellite Data Assimilation into Satellite Data Assimilation into Soil-Vegetation-Atmosphere Transfer Soil-Vegetation-Atmosphere Transfer
(SVAT)(SVAT) or Crop Modelsor Crop Models
Forcing technique
Estimating model state variables from remote sensing data, and directly introduce (force) them into the model at occurrences compatible with the time step of the model.
Correcting technique
Correcting the course of model dynamic variables by comparing them to remote sensing measurements.
Sequential assimilation techniques
The model is updated each time an observation is available. This observation is usually used for updating model prognostic variables.
Variational assimilation techniques
All of the available observations for a certain period of time are processed together. They are usually used for retrieving model parameters or initial values of model variables using model calibration techniques, based either on iterative algorithms or stochastic methods.

16
Satellite – Derived Information for Satellite – Derived Information for AgrometeorologyAgrometeorology
The geo-referenced information, obtained from optical and radar images could be used in determination of certain parameters required for agrometeorology and for agricultural drought monitoring:
• the land surface temperature;• the actual evapotranspiration;• land (vegetation) albedo• soil moisture;• snow cover;• fraction of green vegetation, land cover/land use features; • vegetation state;• biophysical crop parameters (LAI, FPAR, etc.)

17
LLand and SSurface urface TTemperatureemperature (LST) (LST)
For agrometeorology and vegetation monitoring it is important to have access to reliable estimates of surface temperature over large spatial and temporal scales.
As it is practically impossible to obtain such information from ground-based measurements, the use of satellite measurements in the thermal infrared (TIR) can give access to global and uniform estimates of surface temperature.
The TIR signature received by satellite sensors is determined by surface temperature, surface emissivity/reflectivity, atmospheric emission, absorption and scattering actions upon thermal radiation from the surface and the solar radiation in daytime.
The LST is associated with the thermal emission from the landscape “surface” including the top of the canopy for vegetated surfaces as well as other surfaces such as bare soil. Incoming solar radiation, but also variables associates with the substrate and atmospheric conditions, such as thermal inertia, soil moisture and albedo, mostly determine surface temperature response. Over vegetated surfaces, the surface canopy temperature is also indirectly controlled by available water in the root zone and more directly by evapotranspiration.
Satellite-derived LST have a lot of applications such a evapotranspiration estimation, frost detection, monitoring water-stress in crops and thermal inertia studies and may be used to improve agrometeorological models.

18
LST derived from NOAA/AVHRR by the
« split window” split window” methodmethod
17, July 1999
6 July 2000
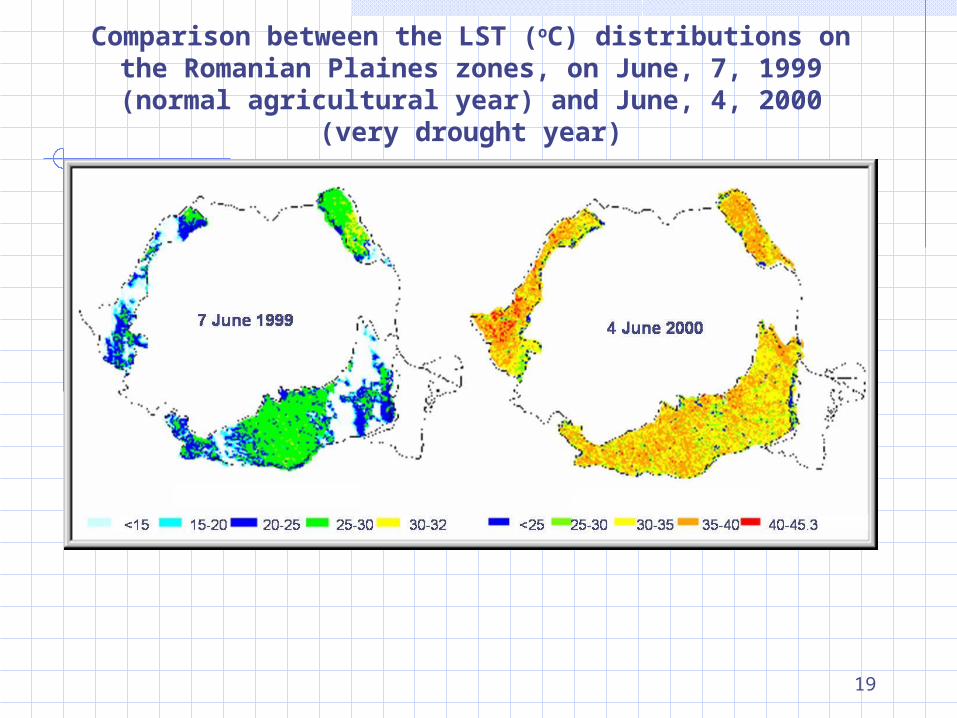
19
Comparison between the LST (oC) distributions on the Romanian Plaines zones, on June, 7, 1999 (normal agricultural
year) and June, 4, 2000 (very drought year)

20
Particular advantage of satellite RS:• Not influenced by water re-distribution (e.g., irrigation);• Strong at phenology;• Good accuracy;• Good spatial coverage;
E.g. AQUA/MODIS: - Frequent global coverage (every day + combination with
Terra/MODIS)- Afternoon overpass … dry condition becomes clearer than
morning- Moderate spatial resolution (1km) cf. Microwave remote sensing- High-precision of temperature and vegetation indices - Albedo and emissivity are available. - Atmospheric information is available from other sensors on Aqua
EvapotranspirationEvapotranspiration ((ETET))

21
Method for the Assessment of Method for the Assessment of the Crop Actual ET Using RS the Crop Actual ET Using RS
DataData
The method used for the computation of daily actual crop evapotranspiration, (ETcj), is based on the energy balance of the surface expressed in two simple versions.
The method uses the connection between evapotranspiration, net radiation and the difference between surface (Ts) and air (Ta) temperature measured around 1400 hrs. L.T. (the time of the satellite passage, e.g. NOAA-AVHRR).
The air temperature around local noon is well approximated by the daily air temperature maximum (Tamax)

22
Evaporation Fraction - EFEvaporation Fraction - EF
Potential for coupling with Terra-MODIS (AM overpass)
Q
ETEF GRQ n
Net radiation (radiation absorbed on the land)
Ground heat transferAvailable Energy
- Fractional value is representative for “wetness”.
- Scalability of instantaneous observation to longer period.
- Accurate estimate of Q is difficult.
From: Crago, 1996, “Scaling up in Hydrology using Remote Sensing”

23
- Vegetation Index …NDVI or EVI (S)
- Temperature on vegetation: Tveg (S)
- Incoming solar radiation: PAR (T)
-VI-Ts diagram (S)
Note: (S) …. Derived from Satellite
(T) …. Estimated theoretically
Algorithm for EF Algorithm for EF EvaluationEvaluation
Qveg Qbare
EF = fveg EFveg + (1 – fveg) EFbare
Q Q
- radiative transfer of atmosphere (T)

24
LST derived from NOAA AVHRR
image of 6 July 2000
Actual evapotranspiration estimated from the NOAA AVHRR
Image of 6 July 2000
20 25 30 35 40 45 C
1 2 3 4 5 mm

25
Spectral Vegetation IndicesSpectral Vegetation Indices
The Normalized Difference Vegetation Index (NDVI) is defined as:
NDVI = [(red – NIR)/(red + NIR)]
Where: red and NIR are the sensor’s channel operating in the red or NIR spectral region;
The NDVI could be used to follow seasonal dynamics of vegetation. Inferences can be made regarding phenology and crop growth development, analyzing the temporal shape of the NDVI. Parameters such as beginning of leaf growth, green peak, growing season could also be estimated based on temporal profile analysis.
Spectral Vegetation Indices (SVI) are various linear and non-linear combinations of spectral bands, maximizing sensitivity of the indices to the canopy characteristic of interest (e.g., Fraction of Photosynthetically Active Radiation Absorbed (Fapar)) while minimizing the sensitivity to the unknown and unwanted canopy characteristic (e.g., background reflectance).

26
The Modified Soil Vegetation Index (MSAVI) is defined as:
MSAVI = [(red – NIR)/(red + NIR + A)](1 + A)Where: red and NIR are the sensor’s channel operating in the red or NIR sectral
region; A is a self-adjusting factor defined to adapt the soil noise correction to
the proportion of soil seen by the sensor, given by the expression:
A = 1 – [2(NIR – red)/(NIR + red)]x(red – 1.06NIR)
MSAVI is less sensitive to soil brightness variations including shadows than other spectral vegetation indices.
The soil heat flux (G), is a significant component of net radiation. For bare soil, the relationship between the net radiation Rn and G depends on the surface soil moisture, while for vegetated surface, the ratio G/Rn can be obtained from visible and near-infrared reflectance. G could be formulated in terms of the MSAVI as:
G/Rn = 0.50 exp(-2.13 MSAVI)
Observations: The expression between Rn and G is valid only for clear sky conditions.The relationship between net radiation and soil heat flux depends on the type of surface (bare versus vegetated surface) and on the distribution of the vegetation within the surface.
Spectral Vegetation Indices Spectral Vegetation Indices (cont.)(cont.)

27
The soil moisture index (SMI), useful to characterize the actual drought or desertification status of the ground, is defined as:
SMI = LE / LEp 1.25 LE/In
Where:LE is the actual evapotranspiration; Lep is the potential evapotranspiration; In is the net radiation.
The Stress Degree Day (SDD) is defined by:
SDD = (Ts - Ta)
Where: Ts is the soil surface temperature, Ta is the air temperature.
SDD index adds the daily hydric deficits, expresses by (Ts - Ta), offering good
information about the soil water deficit and related early crop stress, for whole
the vegetative period. ( (Ts - Ta) 0, for a surface with water deficit).
The Water Deficit Index (DFI), is based on a daily relationship between
(Ts - Ta) and the vegetation cover degree of the terrain expressed by the NDVI,
vegetation index.
Spectral Vegetation Indices Spectral Vegetation Indices (cont.)(cont.)

28
Color composite image
NOAA AVHRR 6 July 2000
NDVI derived from NOAA AVHRR of 6 July 2000
clouds

29
>0.2>0.1 >0.3 >0.4 >0.5cloud
NDVI 6 June 2000 NDVI 6 June 2000 –agricultural zones
Vegetation state monitoring using NDVI derived Vegetation state monitoring using NDVI derived
from NOAA AVHRR imagesfrom NOAA AVHRR images

30
SPOT/VEGETATION - derived products SPOT/VEGETATION - derived products ApplicationsApplications
Applications of NDVI values derived from S10 Spot-Vegetation imagery:
analysis of multi-year NDVI values for various locations; deriving complex indices: MSAVI (Modified soil advanced vegetation index), VCI (Vegetation crop index), etc.; correlations with various agro-meteorological parameters using datasets provided by agro-meteo models and agro-meteo observation platforms.
VGT-S10 products (ten day synthesis) are compiled by merging segments acquired in a ten days. These products provide data from all spectral bands, the NDVI and auxiliary data on image acquisition parameters. A MVC synthesis can be obtained with several spatial resolution (1*1 km2 or 4*4 km2 or 8*8 km2).

31
SPOT-VEGETATION - SPOT-VEGETATION - Normalized Difference Vegetation IndexNormalized Difference Vegetation Index (NDVI) (NDVI)

32
SPOT-VEGETATION - SPOT-VEGETATION - Normalized Difference Vegetation IndexNormalized Difference Vegetation Index (NDVI) (NDVI)

33

34
IIntegrated ntegrated agro-meteorologicalagro-meteorological and and satellite-derived datasatellite-derived data for crop condition for crop condition
monitoringmonitoring
CALARASI
0
20
40
60
80
100
120
140
160
Ian Feb Mar Apr Mai Iun Iul Aug Sep Oct Nov Dec
% o
f T
AM
0
20
40
60
80
100
120
140
160
180
ND
VI
Soil moisture (% of TAM) -2003 NDVI 2003
Soil Moisture Deficit - CROPWAT(mm)

35
Soil moisture measured data and SPOT-VEGETATION - NDVI values for maize condition monitoring in 2003 in 2
test-areas situated in the Romanian Plane.
0
10
20
30
40
50
60
70
80
90
100
Apr Mai Iun Iul Aug
Soi
l moi
stur
e (%
of T
AM
)
50
70
90
110
130
150
170
190
210
230
250
ND
VI
Soil moisture (%of TAM)
NDVI 2003
0
10
20
30
40
50
60
70
80
90
100
Apr Mai Iun Iul Aug
So
il m
ois
ture
(%
of
TA
M)
50
70
90
110
130
150
170
190
210
230
250
ND
VI
Soil moisture (% of TAM)
NDVI 2003 CalarasiCraiova
36
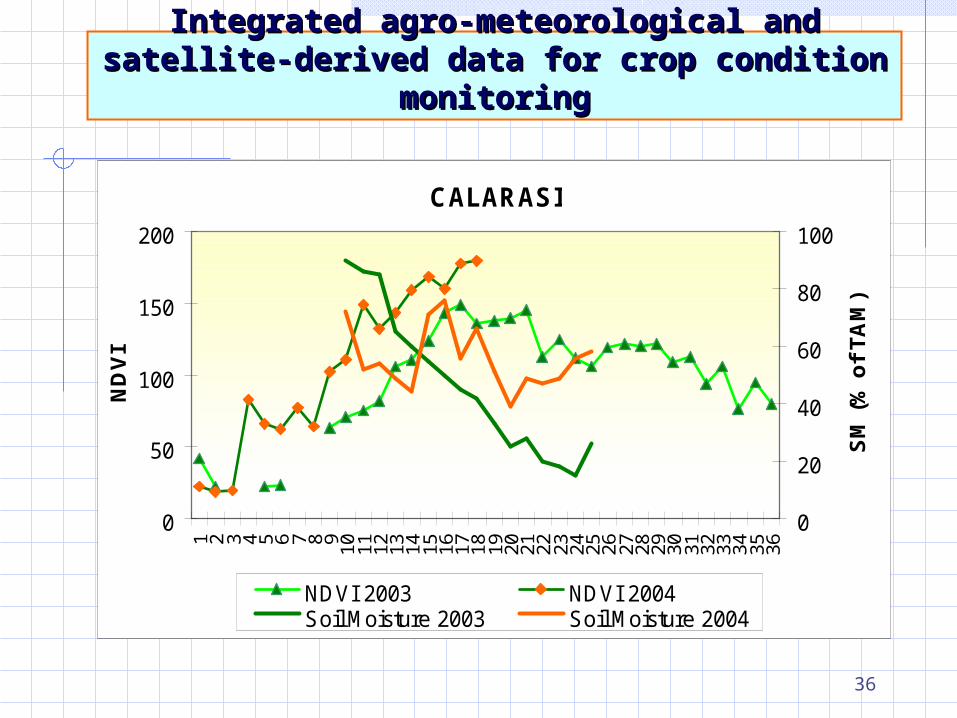
IIntegrated ntegrated agro-meteorologicalagro-meteorological and and satellite-derived datasatellite-derived data for crop condition for crop condition
monitoringmonitoring
CALARASI
0
50
100
150
200
1 2 3 4 5 6 7 8 9 10 11 12 13 14 15 16 17 18 19 20 21 22 23 24 25 26 27 28 29 30 31 32 33 34 35 36
ND
VI
0
20
40
60
80
100
SM
(%
of
TA
M)
NDVI 2003 NDVI 2004Soil Moisture 2003 Soil Moisture 2004

37
MSAVI derived from SPOT-Vegetation 10 days MSAVI derived from SPOT-Vegetation 10 days composite data on Romaniacomposite data on Romania

38
FFraction of raction of GGreen reen VVegetationegetation, , Land Cover/land Use Land Cover/land Use FeaturesFeatures
Landsat-TM from 12.06.2000 on the Oltenia Plaine (Caracal)
ASTER from 4.10.2000 on Baragan Plaine (Fundulea)

39
Snow cover derived from AQUA/MODIS Snow cover derived from AQUA/MODIS 8 days composite data8 days composite data

40
ConclusionsConclusions
The new investments in the Romanian meteorological integrated system will contribute to improving the monitoring system of the agrometeorological parameters, using highly efficient methodologies and techniques (mathematical modeling, GIS, remote sensing), in order to evaluate the vegetation state of the crops, of the moisture and soil water deficit dynamics, for the optimization of the agricultural management.
The results, such as the agrometeorological bulletins (diagnosis and forecasts) will be disseminate via Internet at different customers including the decision making factors in agriculture, extension services, insurance companies, farmers, media, etc.
The assessment and quasi-real time monitoring of the risk agrometeorological factors (drought, heat, water excess/deficit in the soil, etc.) and their zoning over the country’s agricultural territory, during vegetation season of crops will allow timely identification of the agricultural areas the most vulnerable and the dissemination of the information to the users (farmers, decision makers) for taking adequate measures (irrigation, fertilizing, agrotechnics to preserve the water in the soil, etc.).