1 multi-core debug platform for noc-based systems shan tang and qiang xu eda&testing laboratory
Post on 20-Dec-2015
217 views
TRANSCRIPT
1
Multi-Core Debug Platform for NoC-Based Systems
Shan Tang and Qiang XuEDA&Testing Laboratory
2
Background

3
Silicon Debug for Single Core Run Control Interface (e.g., JTAG)
Widely used in practice Not enough for tricky bugs Not applicable for certain real-time applications
Trace + Trigger Effective in most cases
Challenging yet Well Studied Problem!

4
Multi-Core Debug - Requirements Concurrent debug access to interacting cores a
nd their transactions
System-level triggering and trace
Debug event synchronization for cores from multiple clock domains
Limited DfD cost in terms of silicon area, routing and device pins.

5
Multi-Core Debug Architecture - ARM CoreSight
Core
Cro
ss-t
rigge
r In
terf
ace
(CT
I)
HTM
TPIU ETB
Funnel
Deb
ug A
cces
s P
ort (
DA
P)
Debug APB
Trace ATB
AMBA AXI/AHB
Cross Trigger Matrix(CTM)
Core
ETMETM
TracePort
JTAGPort
Replicator
SoC
Cro
ss-t
rigge
r In
terf
ace
(CT
I)
6
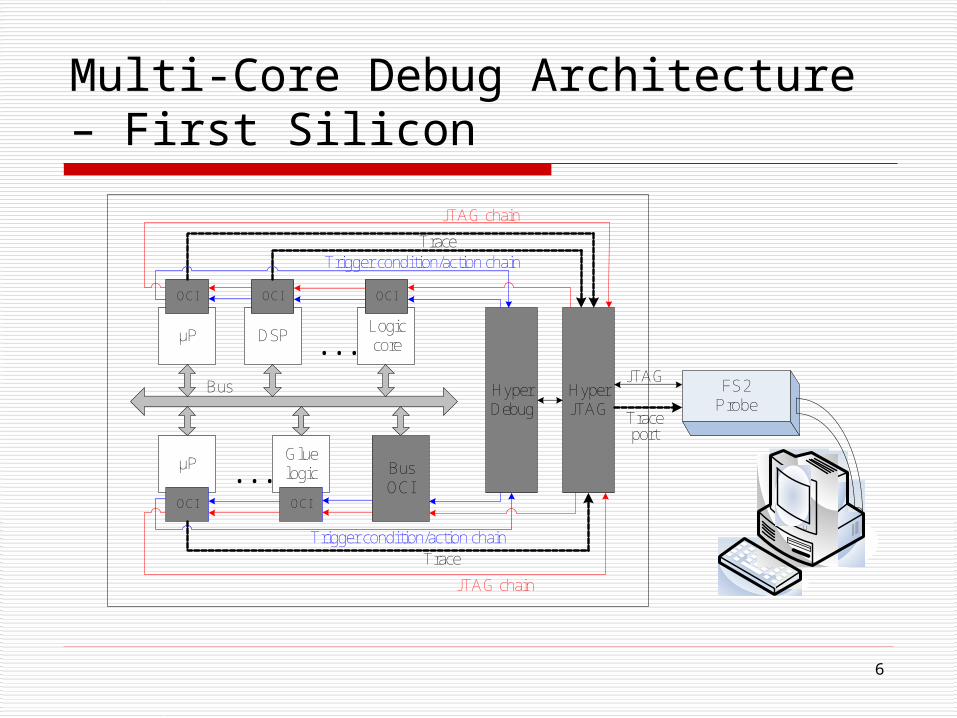
Multi-Core Debug Architecture – First Silicon
μP
OCI
DSP
OCI
Logic core
OCI
μP
OCI
Glue logic
OCI
Bus OCI
HyperDebug
HyperJTAG
...
...
JTAG chain
Trigger condition/action chainTrace
JTAG chain
Trigger condition/action chainTrace
Bus
`
FS2Probe
JTAG
Trace port

7
Network-on-Chip Most promising communication sche
me for future giga-scale SoCs
NoC generally contains: Network interface Router Physical link
Need debug support as a new design paradigm
RR
R
R
NI
μP
R
NI
DSP
RN
I
Mem
NI
Logic core
NI
μP
link

8
NoC Monitoring Service Ciordas et al. TODAES’05, IES’06
Monitoring probe attached at routers Effective identifying bit-level errors Costly in terms of NoC bandwidth at transaction level Monitor instead of Debug

9
Multi-Core Debug Platform for NoC-Based Systems

10
Rationale How to achieve concurrent debug access?
Reuse NoC to transfer debug data Insert debug probe between core and NI
How to monitor inter-core transactions in NoC-based systems Not shared mechanism – cannot simply listen
How to deal with the latency problem? Use QoS guaranteed service for debug connections Two-pass debug strategy

11
Proposed Platform
On-Chip Debug Architecture Off-Chip Debug Controller Supporting Debug Software
NoC
NoC based SoC
CU
D
DP
OC
P
DAJTAG
CU
D
DP
NoC Configuration
NI
NI
R R
R R
NINI
OC
P
D
Port
C Port
Multi-core Debug Driver
DebuggerFor Cores
Hardware Debug Controller
Off-chip Debug Controller
JTA
G
TransactionDebugger
Cross-Trigger
T
Port
Trace
C
Port
T Port
DebugSoftware
PC Interface
D
Port
C
Port
Tra
ce
JTA
G
MSACtr
nC port: Communication Port nD port: Debug Port nT port: Trace Port nMSA: Monitor Service Access

12
On-Chip Debug Architecture Core-Level Debug Probe
Between core and NI Monitor transactions Control/observe core’s debug interface
System-level Debug Agent JTAG (+ trace port) Controlled by off-chip debug controller

13
Debug Probe Design
Trigger & Trace
Transaction Trace Buffer
OCP Slave IF
JTAGControl
Core Trace Buffer
NIOCP
JTAG(Debug port)
CoreTrace
OCP Slave IF
Delay Control
OCP
Transaction Trace Module
Debug Access Module
Core Debug Module
Core Trace Module
NoC
CUD
NI
DebugConnection
TraceConnection
Trace Port

14
Trigger & Trace Unit Design
Detector 1
Detector n
Detector 2MUX
Tra
ce C
ontr
ol
ShadowBufferT
imer
Trigger
signals
Register W/R interface
OCP
Buffer Write
BufferfullTrigger Control
RecordsGeneration
Inpu
t Sw
itch
Trigger Unit Trace Unit
15
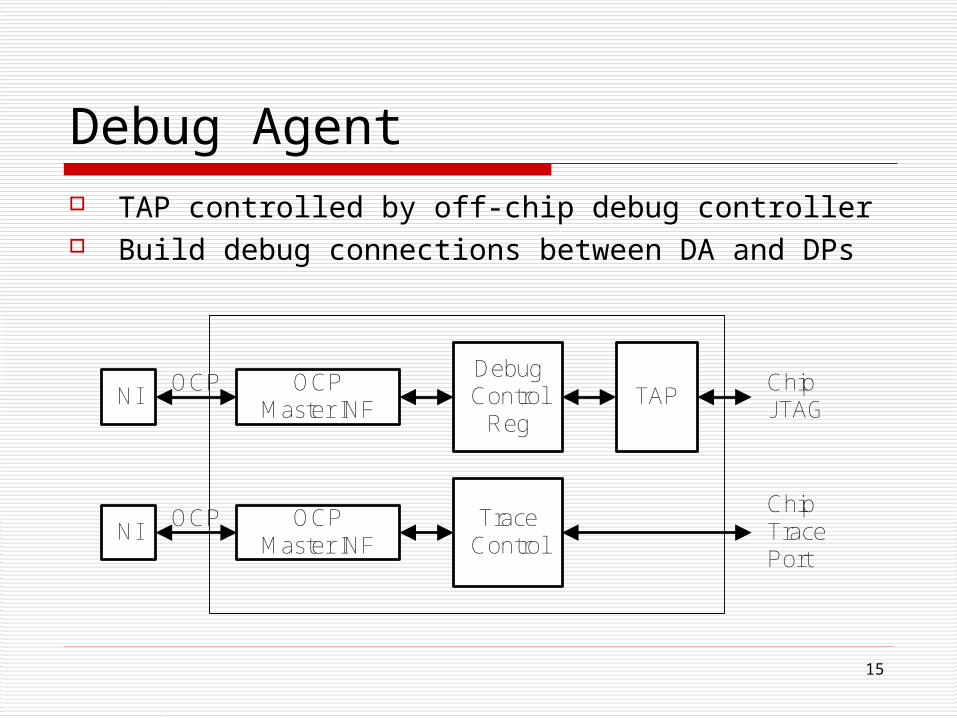
Debug Agent TAP controlled by off-chip debug controller Build debug connections between DA and DPs
NI
NI
OCP
OCP OCP Master INF
OCP Master INF
DebugControl
Reg
TraceControl
TAPChipJTAG
ChipTracePort

16
Control On-Chip Debug Registers through DA

17
Supporting Debug Software Provide GUI or command line interface
3-layer architecture: Cross debugger Core debugger and Transaction debugger Multi-core debug driver (PC interfaces)

18
Off-Chip Debug Controller Translation layer between debuggers and on-chip debug
architecture Schedule debug commands/data transfer
All debug resources in DPs and CUDs are mapped into addressable registers
Core C Stop C
Core B
Core A
JTAG Stop A Stop B Stop C
Td_core_reg_wrA TdelayA
Td_core_reg_wrB
TdelayCTd_core_reg_wrC
Stop A
Stop B
ExpectedTrigger Time
TdelayB

19
Debug Access Delay
NoC
OCP Slave
Deb
ug C
ontr
ol
DP
DA
DebugChannel
JTA
GTAP
Td_core_reg_wr
Td_DP_OCP Td_NoC Td_DA
Debug Regs
Trace Buffer
JTAG
CUD
CUD
Td_DP_reg_wr
Td_DP
Debug Regs
DP
CUD DP

20
Experimental Results
22
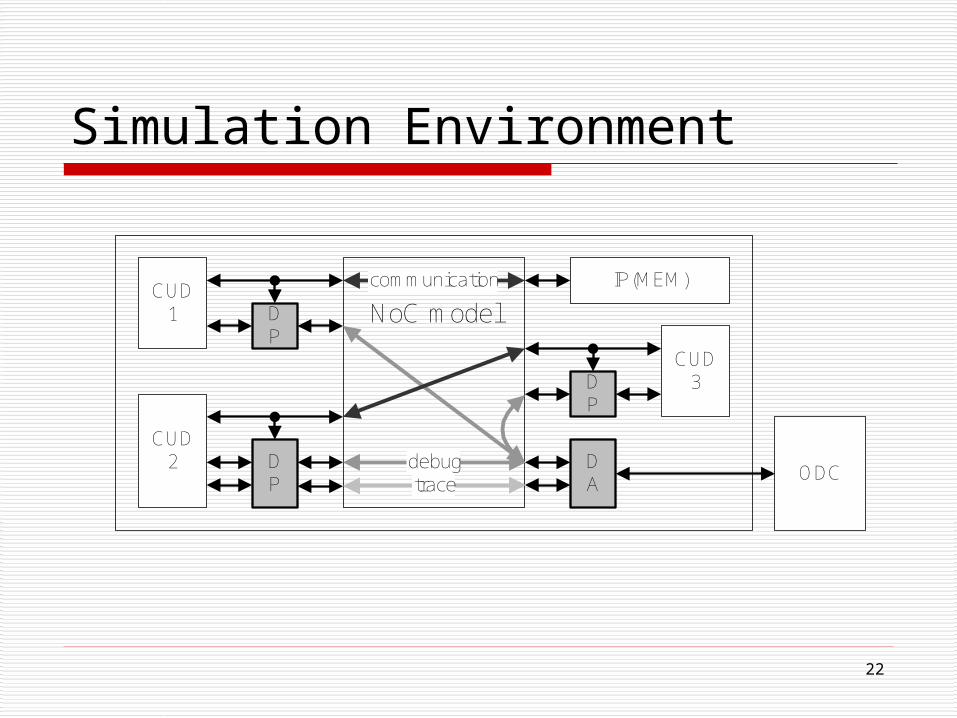
Simulation Environment
CUD2 D
PDA
CUD1 D
P
debug
communication IP(MEM)
ODC
DP
CUD3
NoC model
trace

23
Simulation Results – Multi-core Concurrent Debug
setting DP1's delay counter
setting DP2's delay counter
setting DP3's delay counter DP2 received ‘write’ operation
DP2 received ‘write’ operation
setting 3 CUDs’ debug registers at the same time
pre-calculated delay value
delay counter counting down
debug access on chip-level debug port
NoC link delay
DP1 received ‘write’ operation
Pre-calculated delay can be inserted Multiple cores can be concurrently debugged

24
Simulation Results – Transaction Trace
Configurable trigger and trace conditions Transactions are recorded when trigger event
happens
detector hit
transaction analyzer hit
configure the trigger and trace module
transaction record generatedOCP transactions

25
DfD Area Cost – Debug Probe

27
Conclusion

28
Q & A