1 multiple-use water services mary renwick, winrock international grubs planning workshop nairobi,...
TRANSCRIPT

1
Multiple-Use Water Services
Mary Renwick, Winrock InternationalGRUBS Planning Workshop
Nairobi, KenyaNovember, 2008

2
Multiple-Use Services: Background
Photo Credit: Ronald Loeve
Photo credit: Ronald Rospigliosi
Photo credit: Kande Matungulu
Photo credit: Menno Houtstra
Photo credit: Charles Batchelor
Photo Credit: IRC
Home Gardens Livestock Small-scale Enterprises
Domestic uses of Irrigation Systems

3
Multiple-use services can cost-effectively maximize poverty impacts of investments in water services while enhancing sustainability
Potential clients: over 1 billion people
Where: rural South Asia and sub-Saharan Africa
How: Upgrading service levels within existing domestic and irrigation systemsNew domestic multiple-use services
Key Findings

44
Study Goal: to help inform prospective investments in the water sector by assessing the potential of multiple-use water services to sustainably meet the water needs of the poor.
Question 1: What are the incremental costs and benefits of multiple-use approaches over single-use approaches?
Question 2: Where do multiple-use approaches apply and who are the main beneficiaries?
Identify potential opportunity areas
Assess incremental costs, benefits and poverty impacts
Evaluate the potential market for multiple use water services
Develop a framework for multiple use services—defining service levels
Methods
Research Goal, Questions, and Methods

5
Water Service Levels Defined
No services
Highest-level multiple use services
Intermediate-level multiple use services
Basic-level multiple use services
Basic domestic / basic irrigation
cc
most domestic and productive needs
many domestic and productive needs
limited domestic and productive needs
single use – either domestic and irrigation
Level 0
Level 1
Level 2
Level 3
Level 4
Incremental improvements in water service to support domestic and productive uses

6
6
Determinants of water service levels
Domestic Multiple Use Irrigation
Quantity
Quality
Reliability
Distance(physical, social and economic barriers to access)
Reducing distance between water source and homestead to support productive uses
Reducing distance to homestead, improving physical access to canals
Making water availability more reliable to support non-irrigation uses
Increasing water quantity to support productive uses
Improving water quality to support domestic uses
Water Service Levels Required to Support Multiple Uses
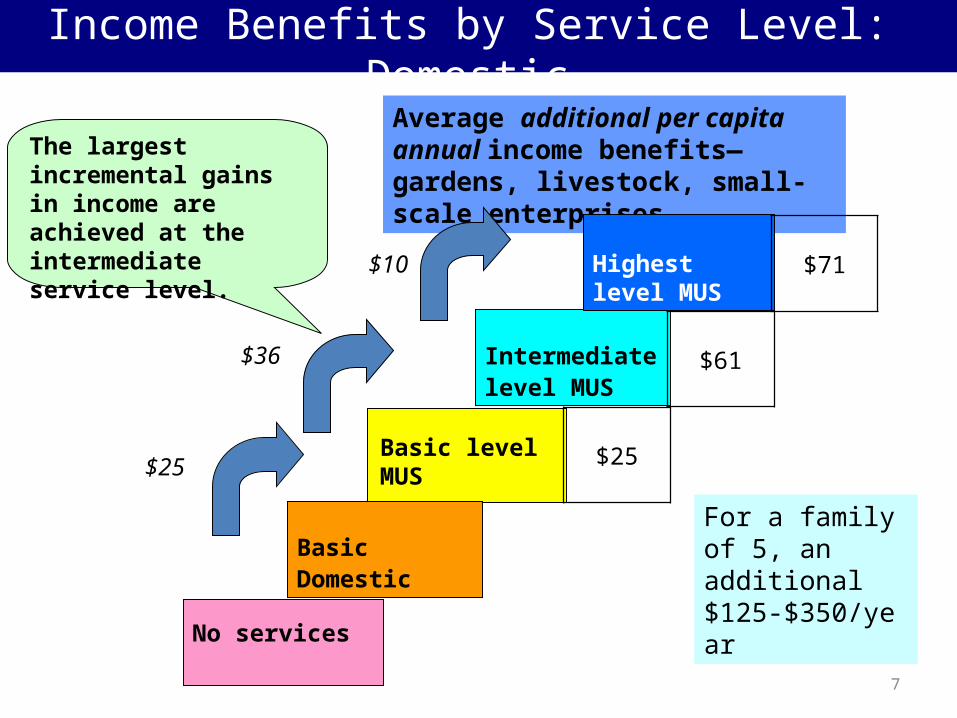
7
Average additional per capita annual income benefits—gardens, livestock, small-scale enterprises
Basic level MUS
Intermediate level MUS
Highest level MUS
$71$10
The largest incremental gains in income are achieved at the intermediate service level.
$61
$25
Basic Domestic
No services
$36
$25
Income Benefits by Service Level: Domestic
For a family of 5, an additional $125-$350/year

8
• Health
• Food security and nutrition
• Diversifying livelihoods and reduced vulnerability
• Social equity and empowerment
Poverty Impacts: Non Financial Benefits
Photo credit: Umgeni Water

9
Basic level MUS
Intermediate level MUS
Highest level MUS $140
Basic Domestic
No services
1.3
Cost BCR
3 - 8$56-105
Cost BCR
$98 - 116 .67
Cost BCR
Cost BCR
$63 - 91 (neg)
Costs and Benefits: New Domestic Services
Per capita investment costs include software and hardware
Benefit-cost ratios include: • Full Investment costs
• Re-current annual costs (O&M, source protection and capital maintenance fund)

10
Basic level MUS
Intermediate level MUS
Highest level MUS
Basic Domestic
No services
Costs and Benefits: Upgrading Services

11
Where: Mapping the potential market for multiple use services
Incremental Costs & Benefits By Service Level & Technology
Assess Economic Feasibility of Multiple Use Services
Assess Potential Client BaseSize, Location & Characteristics
Potential Market
Enabling Conditions
Disaggregate Populations By Technology/Water Source For Water Service LevelsEstimate Populations By Water Service LevelsMap Socio-Economic Characteristics Using Available Data Opportunity action areas

12
Example: Mapping Market for New Piped Domestic Multiple Use Services
Sources: JMP, 2004. CIESIN, 2004.

13Sources: IWMI, GIAM, 2006. CIESIN, 2004.
Example: Mapping Market for Upgrading Irrigation Systems to Support Multiple Use Services

14
1. New piped multiple use services for currently unserved at the intermediate service level
137 million $56-$105 3.4-7.8 13-30
2. Upgrading existing domestic piped systems to intermediate multiple uses service level
185 million $84 4.7 22
3. Boreholes with hand pumps: upgrading services to basic multiple use service level through communal add-ons to support multiple uses
280 million $25 5.4 12
4. Upgrading existing household hand-dug wells to the intermediate multiple use service level through well protection and improved lifting devices
74 million $39 - $102 3.4-8.6 9-26
5. Upgrading existing irrigation systems to basic and intermediate service levels: communal add-ons, domestic storage and home water treatment
447 million $10 - $110 2.9 - 27 3-24
Opportunity Action Area Market
Capital investment costs(capita)
Benefit-cost ratio
Repayment Period(months)

15
Summary and Implications for H2.0 Initiative
• Multiple-use water services cost more but generate greater income and poverty impacts …enhanced sustainability
• Income generation … new opportunities for financing water services
• Large potential market (>1 billion)
• Significant opportunities for leveraging—interest among practitioners, policymakers, donors …
knowledge gaps exist

16
H2.0 Initiative: Objectives and Outputs
Goal: integrate MUS into the h2.0 Initiative to support the design of an improved monitoring approach for the water sector that is responsive to poor communities’ multiple water needs and geared towards results-based reporting on sector performance.
Objective 1: Develop an analytical frameworkOutputs: Analytical framework to guide phase I activities; identification of survey tools and project partners for technical assistance. Objective 2: Provide direct technical assistance to selected project partners Outputs: Project implementing partners are able to use improved metrics to track and analyze MUS and represent communities’ multiple water needs in an accessible, geo-referenced database Objective 3: Lead a MUS knowledge management and dissemination strategyOutputs: Stakeholders are better informed on MUS and able to integrate a MUS perspective into Phase II roll-out activities; h2.0 activities related to MUS are better linked to existing MUS-related activities, galvanizing a broader network of stakeholders to catalyze growth in the knowledge base overtime.

17
Thank you
Your thoughts?
For more information:Mary Renwick
Full report: www.winrockwater.org