1 national level food security mission executive committee 8 th meeting 16.01.2012 department of...
TRANSCRIPT

1
NATIONAL LEVEL FOOD SECURITY MISSION EXECUTIVE COMMITTEE
8TH MEETING
16.01.2012
DEPARTMENT OF AGRICULTURE TAMILNADU

2
AGRICULTURE SCENARIO IN TAMILNADU Land Area - 4% : Water Resources - 3% :
Population - 7% of the Nation
Average Rainfall - 930.7 mm
Geographical area - 130.31 L. ha.
Gross area sown - 55.72 L. ha.
Net area sown - 48.92 L. ha.(37.5%)
Gross Area Irrigated - 32.38 L. ha.
Net Area Irrigated - 28.64 L. ha (59%)
Rainfed Area - 20.28 L. ha (41%)
No.of land holdings - 81.93 L. Nos.
Average size of holding - 0.83 Ha.
SF/MF - 91%(operating 58% of the total Land holdings)
Other Farmers - 9% (operating 42% of the total land
holdings)
Source: Season and Crop Report 2009-10

3
RAINFALL – COMPARISON (mm)

4
NFSM IMPLEMENTING DISTRICTS
Inception - October 2007
NFSM Rice
Five districts -Nagapattinam, Thiruvarur, Sivaganga, Ramnad and Pudukottai
NFSM Pulses
It is implemented in all the 30 districts of Tamil Nadu from 2010-11
A3P
Implemented in 7 Units in the selected districts

5
Anticipated Area, Production and Productivity -2011-12
2011-12
Districts
Area Prodn Prodty
(L.Ha) (L.M.T) (Kgs/ha)
Rice
NFSM 6.420 20.544 3200
Non-NFSM 13.850 52.630 3800
Total 20.270 73.174 3610
PulsesNFSM 9.200 3.910 425
Total 9.200 3.910 425

6
NFSM RICE AND PULSES- AREA, PRODUCTION AND PRODUCTIVITY - 2007-08 TO 2010-11
Year Districts Rice Pulses
Area Prodn Prodty Area Prodn Prodty(L.Ha) (L.M.T) (Kgs/ha) (L.Ha) (L.M.T) (Kgs/ha)
2006-07 NFSM 6.478 18.33 2830 3.541 1.906 538
Base yearNon-NFSM 12.836 47.73 3718 1.824 0.999 547
Total 19.314 66.106 3422 5.365 2.905 541
2007-08NFSM 5.948 8.69 1461 4.149 1.181 285Non-NFSM 11.943 41.709 3492 1.860 0.668 317Total 17.891 50.399 2817 6.009 1.849 301
2008-09NFSM 6.548 9.467 1445 3.814 1.046 274Non-NFSM 12.768 42.367 3318 1.544 0.628 406Total 19.316 51.834 2683 5.358 1.674 312
2009-10 NFSM 6.306 14.766 3448 3.735 1.305 350Non-NFSM 12.149 41.887 2341 1.623 0.738 455Total 18.455 56.653 3070 5.358 2.043 381
2010-11 (Final Estimate)
NFSM 6.245 14.985 23996.367 2.459 386
Non NFSM 12.812 42.939 3351
Total 19.057 57.924 3039 6.367 2.459 386

7
NFSM FINANCIAL STATEMENT -2011-12(up to Dec-11)
SchemesAmount
Sanctioned by GOI
Amount Released
by GOI
Unspent Balance of
Previous year
Total Release Expenditure Percentage of
expenditure
1 2 3 4 5(3+4) 6
NFSM Rice 2144.190 2158.000 0.000 2158.000
1646.579
77%
NFSM Pulses 1144.688 1105.130 39.982 1145.112 585.553 51 %
Total 3288.878 3263.13 39.982 3303.112 2232.132
68 %
Rs. in lakhs

8
NFSM (RICE) – FINANCIAL PERFORMANCE (Rs in Lakhs)
Year` Amount sanctioned
Amount released incl.
Unspent
Expenditure % of achmt w.r.t.
release
Unspent balance as
on 01st April
NFSM Rice
2010-11 2600.260 2043.979 2251.601 >100 (-) 207.621
2011- 12(Dec-11)
2144.190 2158.000 1646.579 77

9
NFSM (PULSES) –FINANCIAL PERFORMANCE Rs.in lakhs
YearAmount
sanctioned
Amount released incl.
UnspentExpenditure
% of achmt w.r.t.
release
Unspent balance as
on 01st April
NFSM-Pulses
2010-11 1533.263 1038.802 998.818 96 39.982
2011-12 1144.688 1145.112 585.553(Dec-11) 51

10
NFSM – A3P -FINANCIAL PERFORMANCE (Rs. in Lakhs)
YearAmount
sanctioned
Amount released incl.
UnspentExpenditure
% of achmt w.r.t.
release
Unspent balance as
on 01st April
A3P2010-11 710.580 710.580 693.232 98 17.348
2011-12 348.000 347.348 263.039(Dec-11)
76

11
NFSM – RICE PROGRESS-Dec-2011
Sl. No
InterventionsApproved Rate of Assistance Unit
Physical Finance
TargetAchmt
TargetAchmt
1
Demonstrations on System of Rice Intensification (SRI) (One Demon. Of 0.4 ha @ every 100 Ha of rice area.)
Rs. 3000/-per Dem.
Nos. 2000 2000 60.000 60.000
2Demonstrations on Hybrid Rice Technology (One dem. Of 0.4 ha at every 100 ha of Rice)
Rs. 3000/-per Dem.
Nos. 800 800 24.000 24.000
3Support for Promotion of Hybrid Rice:
(a) Assistance for production of Hybrid Rice Seed.
Rs. 1000/-per Qtl.
Qtls 100 45.14 1.000 0.451
(b) Assistance for Distribution of Hybrid Rice Seed.
Rs. 2000/-per Qtl.
Qtls 500 278 10.000 5.276
4Assistance for Distribution of HYVs Seeds.
Rs. 500/-per Qtl. Qtls 150000 139156 750.000 695.780
5 Seed Minikits of HYVs Full Cost Nos 2184 2184 6 Seed Minikits of Hybrid Rice Full Cost Nos 2000 2000 7 Incentive for Micro-Nutrients. Rs. 500/-per ha Ha 40000 32044 200.000 160.220
8a.Incentive for Conoweeder and
other Farm Implements.
Rs. 3000/-per farmer per implement.
Nos 6500 2345 195.000 52.930
9 Distribution of pumpset Rs.10000/No Nos 3000 2000 300.000 200.000
(Rs. in Lakhs)

12
NFSM – RICE PROGRESS-Dec-2011Sl. No
InterventionsApproved Rate of Assistance Unit
Physical Finance
TargetAchmt
TargetAchmt
10 Distribution of Rotovator Rs.30000/No Nos 300 257 90.000 77.100
11Distribution of Power operated conoweeder
Rs.15000/No Nos 20 0 3.000 0.000
12 Distribution of knap sack sprayer Rs.3000/No Nos 7000 14456 210.000 161.493
13Distribution of Laser land leveller
Rs 1.5 Lakhs / Group
Nos. 5 0 7.500 0.000
14Assistance for Plant Protection Chemical and bio-agents.
Rs. 500/-per ha. Ha 25000 14870 125.000 74.000
15 Farmers Trainings at FFS Pattern.Rs. 17000/-per Training.
Nos. 106 106 18.020 18.020
16 Award for best performing DistrictsRs 5.00 Lakhs per year
Nos 0 0 5.000 0.000
17 Miscellaneous Expenses.
(a) Project Management Team and other Miscellaneous expenses at district Level.
Rs. 6.36 lakh per district.
No. of dist. 0 0 31.800 17.309
(b) Project Management Team and other Miscellaneous expenses at State Level.
Rs. 13.87 lakh per State.
0 0 13.870 5.000
18 Local Initiatives
Distribution of Power Tiller Rs.45000/ No Nos. 200 200 90.000 90.000 Distribution of Transplanter Rs1.00 L / No Nos. 10 5 10.000 5.000 Grand Total 2144.190 1646.579
(Rs. in Lakhs)

13
Sl.No.
InterventionsApproved Rate of Assistance
UnitPhy
TargetPhy
AchmtFin
TargetFin Achmt
1 Seeds:
(b) Purchase of Breeder Seeds of Pulses
Full cost as per 5234/- per Qtl.
Qtl. 200 235 10.468 12.306
(c) Production of Foundation Seeds Rs.1000/-per Qtl. 2655 2527 26.550 25.272 (d) Production of Certified Seeds Rs.1000/-per Qtl. 15000 7823 150.000 78.227 (e) Distribution of Certified Seeds Rs.1200/-per Qtl. 18000 6787 216.000 81.4412 Integrated Nutrient Management: (a) Lime/Gypsum Rs.750/- per Ha. Ha. 6000 0 45.000 0.000 (b) Micro-nutrients Rs.500/- per Ha. Ha. 6000 2622 30.000 13.1083 Assistance for Rhizobium Culture Rs. 100/ Ha Ha. 15000 12000 15.000 12.0004 Integrated Pest Management (IPM) Rs.750/- per Ha. Ha. 10000 2010 75.000 15.0775 Distribution of PP Chemicals Rs.500/ Ha 10000 6000 50.000 30.0006 Assistance for Weedicides Rs.500 per Ha Ha. 2000 612 10.000 3.0607 Distribution of Sprinkler Sets Rs.7500/-per Ha. 130 76 9.750 5.7008 Distribution of Rotavators Rs.30,000/- Nos. 200 102 60.000 30.6009 Incentive for Pump sets Rs.10,000/- Nos. 150 67 15.000 6.700
10 Assistance for pipes carrying waterRs. 15000/ for 800 meters
Meters 400 289 60.000 43.350
11 Incentive for Knap Sack Sprayers Rs. 3000/No Nos. 500 500 15.000 15.000
NFSM – PULSES PROGRESS-Dec-2011(Rs. in Lakhs)

14
Sl.No.
InterventionsApproved Rate of Assistance
UnitPhy
TargetPhy
AchmtFin Target
Fin Achmt
12Distribution of Laser land leveller
Rs 1.5 Lakhs / Group Nos. 5 1 7.500 1.500
(a) Extension, Training including Award to
(i) Training on Pattern of FFS Rs.17,000/- Nos. 150 120 25.500 20.400
(ii) State Level Trainings for Trainers
Rs.1.00 lakh Nos. 1 0 1.000 0.000
(iii) Award for best performing District
5.00lakhs/Dt Nos. 1 0 5.000 0.000
13 Miscellaneous Expenses relating to PMT
(a) District Level:
Rs. 4.47 Lakhs/ District
12 53.640 20.151
(b) State Level: Rs. 6.28 Lakhs/ state 1 6.280 0.000
14Miscellaneous expenses to other districts
Rs. 1.00 lakhs / District
18 18.000 3.061
15 Local Initiatives(Activity-wise) Distribution of Power Tiller Rs.45000/ No Nos. 520 368 234.000 165.600
Distribution of Mobile Sprinkler / Rain gun
Rs. 10000/ Ha Nos. 60 30 6.000 3.000
Grand Total 1144.688 585.553
NFSM – PULSES PROGRESS-Dec-2011(Rs. in Lakhs)
15
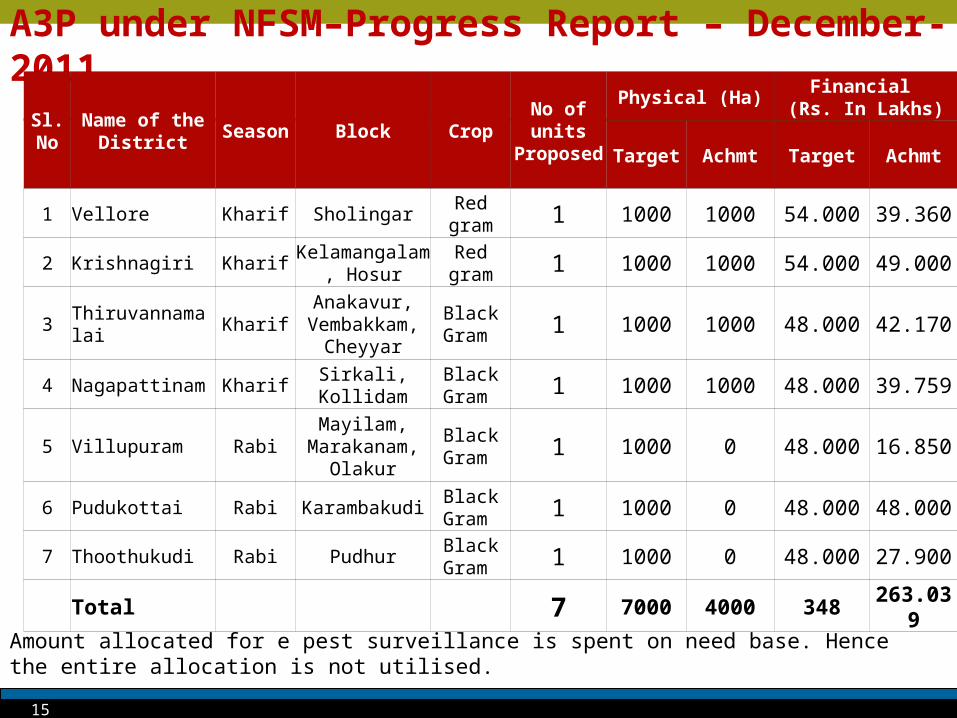
A3P under NFSM–Progress Report – December-2011
Sl. No
Name of the District
Season Block CropNo of units
Proposed
Physical (Ha)Financial
(Rs. In Lakhs)
Target Achmt Target Achmt
1 Vellore Kharif SholingarRed gram 1 1000 1000 54.000 39.360
2 Krishnagiri KharifKelamangalam,
HosurRed gram 1 1000 1000 54.000 49.000
3 Thiruvannamalai KharifAnakavur,
Vembakkam, Cheyyar
Black Gram 1 1000 1000 48.000 42.170
4 Nagapattinam Kharif Sirkali, KollidamBlack Gram 1 1000 1000 48.000 39.759
5 Villupuram RabiMayilam,
Marakanam, Olakur
Black Gram 1 1000 0 48.000 16.850
6 Pudukottai Rabi KarambakudiBlack Gram 1 1000 0 48.000 48.000
7 Thoothukudi Rabi PudhurBlack Gram 1 1000 0 48.000 27.900
Total 7 7000 4000 348 263.039
Amount allocated for e pest surveillance is spent on need base. Hence the entire allocation is not utilised.

16
A3P under RKVY – Progress Report – December -2011
Sl. No
Name of the District
Season Block CropNo of units
Physical (Ha)Financial
(Rs. In Lakhs)
Target Achievement Target Achievement
1 Vellore Kharif NatrampallyRed gram
1 1000 1000 54.000 s
2 Krishnagiri Kharif ThaliRed gram
1 1000 1000 54.000 52.000
3 Thiruvannamalai KharifPeranamallur, vandavasi
Black Gram
1 1000 1000 48.000 26.385
4 Dharmapuri KharifDharmapuri, palacode, Pennagaram
Black Gram
1 1000 1000 48.000 39.100
5 Thoothukudi Rabi KayatharuBlack Gram
1 1000 1000 48.000 27.900
Total 5 5000 5000 242.000 184.745

17
INSITU MOISTURE CONSERVATION - RKVY – Progress Report – December -2011 (Rs. In Lakhs)
Sl. No
Name of the District
Season Block CropNo of units
Construction of new ponds with lining(nos)
Phy Tar
Phy Achmt
Fin Tar
FinAchmt
1 Vellore Kharif NatrampallyRed gram
1 96 65 96.00 65.00
2 Krishnagiri Kharif ThaliRed gram
1 96 0 96.00 0.00
3Thiruvannamalai
KharifPeranamallur, vandavasi
Black Gram
1 96 0 96.00 0.00
4 Dharmapuri KharifDharmapuri, palacode, Pennagaram
Black Gram
1 96 25 96.00 25.00
5 Thoothukudi Rabi KayatharuBlack Gram
1 96 0 96.00 0.00
Total 5 480 90 480.00 90.00
Based on the feasibility study undertaken, the target under lining of old farm ponds has been diverted to construction of new farm ponds.

18
STATES EXPERIENCE IN IMPLEMENTATION OF A3P
Timely availability of inputs at farmers doorstep
Introduction of new high yielding varieties through seed minikits helped farmers to get more yield.
Introduction of new technologies like DAP foliar spray, Pulses wonder spray increased the yield up to 15%
Block level demonstration in a larger area created much interest among the farmers to practice new technologies
Introduction of e pest surveillance programme drastically reduced the usage of plant protection chemicals for pulses

19
STATUS OF IMPLEMENTATION OF PEST SURVEILLANCE IN A3P -2010 – 2011 & 2011-12
2010-11
As the fund was not allocated , e pest surveillance programme was not implemented
2011-12
Out of 11 districts implementing A3P programme, 8 districts have formed DM group and farmers scouts were identified and the programme is under implementation.

20
STATUS OF RICE MINIKITS – 2011-12
District Variety
Allocation approvedDistributed / supplied by
the agency (SFCI)
No.of Minikits
Quantity in Qtls.
No.of Minikits
Quantity in Qtls.
NagapattinamKRH2 700 42 700 42
Samba Mashuri Sub 1 3100 155 650 32.5
ThiruvarurKRH2 700 42 700 42
Samba Mashuri Sub 1 3100 155 650 32.5
PudukottaiKRH2 400 24 400 24
Samba Mashuri Sub 1 2000 100 400 20
RamnadKRH2 100 6 100 6
Samba Mashuri Sub 1 1535 76.75 300 15
SivagangaKRH2 100 6 100 6
Samba Mashuri Sub 1 870 43.5 184 9.2
TotalKRH2 2000 120 2000 120
Samba Mashuri Sub 1 10605 530.25 2184 109.2
KRH2 supplied by SFCI - Samba Mashuri supplied by NSC

21
STATUS OF ONLINE SUBMISSION OF PROGRESS REPORT
Progress reports under NFSM Rice and Pulses at State level are entered regularly through online
Instructions have been given to districts to update the progress report and beneficiary details through online.

22
APPOINTMENT OF PROJECT MANAGEMENT TEAM IN DISTRICTS (Nos)
Sl. No
Schemes
ConsultantsTechnical Assistants
Remarks
Tar Achmt Tar Achmt
Appointment of remaining Technical assistants and consultants are in progress
1 NFSM Rice 5 1 20 8
2 NFSM Pulses 12 1 24 13
Total 22 2 34 21

23
BRIEF OVERVIEW OF NFSM AND A3P
A judicious mix of proven technological components covering seeds of improved varieties , soil ameliorants, plant nutrients, farm machines / implements and plant protection measures coupled with FFS created the awareness of using advance technologies
The method of direct transfer of funds from the Centre to State through Nominated agency and to the implementing districts helped the farmers to get the benefits in time.
The conduct of around 6000 nos of SRI demonstration and distribution of Conoweeder and Markers created the positive trend towards paddy area expansion and productivity enhancement.

24
BRIEF OVERVIEW OF NFSM AND A3P
Introduction of Power Cono weeder, Rotavator, Power Tiller, Transplanter, helped the farmers to complete the field operations in time with additional income.
Supply of Sprinklers, Rain gun and Pipes carrying water gained more demand among the farmers and also helped in bringing more area under irrigated pulses.
The conduct of State level training programme every year by involving the scientists lead the extension functionaries to update the latest technologies regularly.
The A3P Programme implemented during 2010-11 as well as 2011-12 has demonstrated that productivity of pulses can be enhanced at least by 30-40 % through integrated deployment of scientific production technology involving seeds of high yielding varieties, INM & IPM and proper water management.

25
CONCURRENT EVALUATION
Conduct of Concurrent Evaluation was entrusted to
Department of Evaluation and Applied Research & work has been completed by May-2011
Report has been furnished to Government of India during May -2011

26
SPECIFIC ISSUES AND SUGGESTIONS
NFSM Rice
Distribution of truthfully labelled Anna -4 –drought tolerant paddy variety as seed minikit during 2012-13
Increase of subsidy for distribution of Hybrid rice seeds from Rs. 20/Kg to Rs.50/ Kg
For all the machineries – 50 % subsidy without any maximum ceiling limit both under Rice and Pulses scheme
NFSM Pulses
Local initiatives, PMT and conduct of FFS may be extended to all the pulses implementing districts
60 percent of the total financial allocation may be released as first installment
Supply of minikits under A3P may directly be arranged by GOI

Confidential. Not for distribution.27
THANK YOU!