1. report.umber navenvpredrschfac ,2. …. report.umber navenvpredrschfac contractor report ... 7.1...
TRANSCRIPT
UNCLASSIFIED SECURITY CUASSI FICATION-OF THIS PAGE rWhtn Dmf Enfred)
REPORT DOCUMENTATION PAGE READ INSTRUCTIONS BEFORE COMPLETING FORM
1. REPORT.UMBER NAVENVPREDRSCHFAC
Contractor Report CR 84-11
,2. GOVT ACCtSSlON NO.I 3. RECIPIENT'S CATALOG NUMBER
4. TITLE (and Submit)
Characteristics of North Indian Ocean Tropical Cyclone Activity
7. AUTHORC*;
Cheng-Shang Lee and William M. Gray
9. PERFORMING ORGANIZATION NAME AND ADDRESS
Department of Atmospheric Science Colorado State University Fort Collins, CO 80523
II. CONTROLLING OFFICE NAME AND ADDRESS
Naval Air Systems Command Department of the Navy Washington, DC 20361
U. MONITORING AGENCY NAME 4 ADORESS^/dy//»ren( Irom Conlrollini Olllct)
Naval Environmental Prediction""Research Facility Monterey, CA 93943-5106
16. DISTRIBUTION STATEMENT (ol ihia Raport)
5. TYPE OF REPORT 4 PERIOD COVERS
Final
8. PERFORMING ORG. REPORT NUMBER
8. CONTRACT OR GRANT NUMBERfJj
N00228-83-C-3122
10. PROGRAM ELEMENT. pRoj ECT TASK AREA 4 WORK UNIT NUMBERS
PE 62759N NEPRF WU 6.2-22
12. REPORT DATE
December 1984 13. NUMBER OF PAGES
no IS. SECURITY CLASS, (ol Ihia report)
UNCLASSIFIED
15*. DECLASSIFIC ATI ON/ DOWNGRADING SCHEDULE
Approved for public release; distribution is unlimited.
17. DISTRIBUTION STATEMENT (ol tha abalract antarad In Black 30, II dlllarant Iram Rapart)
18. SUPPLEMENTARY NOTES
19. KEY WORDS (Conllrtua on ravaraa aida II nacaaaary and tdarxtlly by block nuwbar)
North Indian Ocean Tropical cyclone Tropical cyclone climatology Tropical cyclone structure
20. ABSTRACT CCon(/nu« on ravaraa alda It nacaaaary ^d Idanlify by block numbar) ~
Characteristics of North Indian Ocean tropical cyclones are discussed from a combined climatological, composite, and individual-case perspective. Presented are both a general discussion of the monthly climatology of these spring/autumn tropical cyclones and a comparison of their structure, genesis, intensity, and movement with these qualities of northwest Pacific Ocean tropical cyclones.
((continued on reverse))
DD 1 JAN 73 1473 EDITION OF 1 NOV «5 IS OBJOLITE S/N 0102-014- 6601 I UNCLASSIFIED
ICCU^ITY CLAJSIFICATION OF THIS PAGE (Whan Data Sniarad)
SKCtlHlTY CLASSIFICATICN OF "HIS PAG£'»?itn Dttt Er.itni)
Block 20, Abstract, continued.
Detailed individual case analyses are made of each North Indian Ocean tropical cyclone that occurred during the First Global GARP Experiment (FGGE) period. Each tropical cyclone's characteristics from genesis to decay are discussed. All data sources of the FGGE year period were consulted, including the analysis of the European Centre for Medium Range Weather Forecasts (ECMWF)=
UNCLASSIFIED SECURITY CLASSIFICATION OF THIS PACEC»Ti»n Dmtm Enfrmd)

HN Kl) AU^im^sJi 0Bb FG (2) M40200 CI (Z) (U > _ iJH kb> COLOKADO b i A ffc Ur^ilV rDKi CQLL-INS DEF'T QF' AT'MUSF'HHF^IC
SCIENCE i i \(::!) Uiiaracter 1 St 1 C;S Di- Norch incian LiCBsn i rop:i. Cc<.l. LycJ. one;
Activity^ I C \'di) KU i V. DN 'J-i) Final CQnt.r actor rept« , AU \ 10) Lee , C,,. S. AU i. 10) Gra\*,W. rl, f\ij (11) Dec: 1984 PC (12) 114p CT n.S) N0022S-83-C-3122 RN (IS) NEPRF-CR--84--11 R C (2 0) Li n c 1 a s s i -f i e d r e p o r t DE (23) *TRGF'iCAL CYCLONES, J.IMDIAN OCEAN, NORTH (DIRECT ION) ,
CLimATE -i DC (24) (0) ID (25) FGGEiF'irst Global GARF' £;;Der:L ment) , F'E62759N, Wu6222 IC (26) (0) AB (27) Characteristics of North Indian Ocean tropical cyclones
B-rs discussed from a comdmed cI i matoi agx cal , composite,, and i ndi vi dual—case perspective™ Presented are Path a general discussion of the monthly
i cl 1 matol oqy" of these spring/autumn tropical cyc.i.ones and a comparison of thosir strucutre, genesis, 1 n t B n s 11 y , a n d m o v e m E^ n t w i c n t h e s e q u a 1111 e s o f northwest Pacific Ocean tropical cyclcunes. Detailed individual case analyses BT^ made of each North Indian Ocean tropicai cyclone that occurred during tlie First Global GAF<P Experiment (FGGE) period. Each tropical cyclone's characteristics frofn genesis to decay B.r<B discussed. Ail data sources of the rGGE year period were c o 11 s u 11 e d „ i n c .1 u ding the a n a l y s x s o f t f i e E. L.S r o p e a n L-sntre for f'iedi I..UTI Kange Weati'ief Forecasts K\r..ZVivi\~) .
0fci83l
(2fci)
SE v34) F
NAVENVPREDRSCHFAC CONTRACTOR REPORT CR 84-11
CHARACTERISTICS OF NORTH INDIAN OCEAN TROPICAL CYCLONE ACTIVITY
Prepared By:
Cheng-Shang Lee and William M. Gray Colorado State University
Fort Collins, CO 80523
Contract No. N00228-83-C-3122
DECEMBER 1984
APPROVED FOR PUBLIC RELEASE; DISTRIBUTION IS UNLIMITED
Prepared For: NAVAL ENVIRONMENTAL PREDICTION RESEARCH FACILITY / ' MONTEREY, CALIFORNIA 93943-5106

TABLE CF CONTEITS
■-_■;- ' Page
1. INTRODUCTION 1
2. TROPICAL CYCLONE CLIMATOLOGY 5
2.1 Yearly Seasonal and Monthly Frequency 5 2.2 Favorable Environmental Setting for Cyclone Formation . 14
3. SYNOPTIC ENVIRONMENT IN WHICH NORTH INDIAN OCEAN TROPICAL CYCLONES FORM 24
4. DATA SOURCES FOR CASE STUDY ANALYSIS AND CYCLONE STRUCTURAL DEFINITIONS 30
5. SUMMARY OF N.I.O. TROPICAL CYCLONES DURING THE FGGE YEAR AND THEIR BASIC LARGE-SCALE CIRCULATION PATTERNS 35
6. ANALYSIS OF INDIVIDUAL CASES OF NORTH INDIAN OCEAN TROPICAL CYCLONES DURING FGGE 41
6.1 TC 17-79 41 6.2 TC 18-79 53 6.3 TC 23-79 65 6.4 TC 22-79 76 6.5 TC 24-79 80 6.6 TC 25-79 83 6.7 TC 26-79 87
7. DISCUSSION ........... 90
7.1 Characteristics of the Large-Scale Circulation Patterns During Tropical Cyclone Formation and Development 90
7.2 Comparison of the Structural Characteristics of N.I.O. Tropical Cyclones with Western North Pacific Tropical Cyclones 96
7.3 Characteristics of the Motion Characteristics of N.I.O. Tropical Cyclones lOo
8. ACKNOWLEDGEMENTS 103
9. REFERENCES 104
DISTRIBUTION 107
ATR
ECMWF
FGGE
ITCZ
JTWC
NCAR
NEPRF
NHC
N.I.O.
NOAA
NMC
SMS
max
TC
LIST OF ACRONYMS Mid SYMBOLS
Annual Typhoon Report
European Center for Medium-range Weather Forecasts
First Global GARP Experiment
Inter Tropical Convergence Zone
Joint Typhoon Warning Center, Guam
National Center for Atmospheric Research, Boulder, CO
Naval Environmental Prediction Research Facility
National Hurricane Center, Miami, FL
North Indian Ocean
National Oceanic and Atmospheric Administration
National Meteorological Center, Washington, D.C.
Synchronous Meteorological Satellite
tangential wind
radial wind
maximum low-level sustained wind in a cyclone
tropical cyclone
mean tangential wind at 6° radius about a tropical disturbance of storms between 1000-700 mb levels
mean radius outflow at 6° radius about a tropical disturbance or storm between 150 and 250 mb
11
1. INTRODUCTION
Growing international tensions over the Arabian Sea shipping routes
and the recent acceleration of US-Indian research activity on the Indian
sub-continent monsoon circulations have heightened the interest in the
characteristics of North Indian Ocean (N.I.O.) tropical cyclones'. How
do tropical cyclones of the N.I.O. compare with the tropical cyclones of
other global basins as to their genesis, intensification, structure,
movement, and decay characteristics? What influence do N.I.O. tropical
cyclones have on the onset and retreat of the monsoon? These are
difficult questions to answer because the tropical cyclones of this
region have not been as well observed as the tropical cyclones of the
northwest Pacific or those of the western Atlantic for the following
reasons: -^ -
1. Although routinely done in the Atlantic and the northwest
Pacific for the last 35 years, there have been no aircraft
reconnaissance flights into N.I.O. tropical cyclones. To obtain
intensity or maximum wind estimates of N.I.O. cyclones one must
rely on the Dvorak (1975) satellite technique for estimation.
Before the satellite era one estimated cyclone strength as best he
could from the surrounding wind and surface pressure information.
When the Dvorak scheme is used by inexperienced meteorologists and
when cyclones have a-typical structural features that do not well
fit the Dvorak intensity curve, this very excellent technique can
lead to errors in estimates of maximum wind (as occurred when the

technique was tested in other ocean basins). In addition, as will
be discussed later, a maxinun wind determination in a cyclone may
not be a very good estimate of the net damage or flooding potential
of the cyclone. Damage and flooding can, in many instances, be
more related to the cyclone's outer wind strength than to its
maximum wind or minimum central pressure. Weatherford and Gray
(1984) have recently been making special studies of the
. relationships between tropical cyclone intensity (maximum wind) and
cyclone strength (mean tangential wind over 1-3° radius about the
cyclone) from analysis of western Pacific US Air Force weather
reconnaissance flights. As will be discussed, we found that
cyclone intensity and strength are often times not well related to
each other.
Despite these difficulties, we have no other choice but to use
the Dvorak satellite technique for an estimate of N.I.O. cyclone
intensity. In a general sense, this technique, as it has been
applied over the last 7-8 years, has proven itself to be quite
reliable, especially in the qualitative sense concerning change in
cyclone intensity.
2. Synchronous meteorological satellite (SMS) data have not been
available over the Indian Ocean. In the Atlantic we have had SKS
data since 1967 and in the western Pacific since 1978. SMS
satellite data have been a very valuable source of tropical cyclone
information. We are fortunate that SMS data were available for a
portion of the FGGE year in which we analyzed individual N.I.O.
tropical cyclones. This is one of the reasons we chose the FGGE
year for our individual case tropical cyclone analysis.

3. Island and land stations to the equatorial sice of tropical
cyclones in the N.I.O are mostly absent as compared with the
western Pacific and the western Atlantic. Tliis hinders the proper
analysis of Southern Hemisphere influences, which later in this
study will be shown to be very important for the formation and/or
intensity change of many N.I.O. tropical cyclones.
Although a number of climatological studies and other individual
case studies of tropical cyclones in the N.I.O have been made, there
have not been, to our knowledge, any comprehensive studies of the
combined climatological, .synoptic setting and structure of individual
tropical cyclones in the region, or a comparison of N.I.O tropical
cyclones with the better documented tropical cyclones of other ocean
basins. This report attempts to make this more comprehensive study of
N.I.O. tropical cyclones. We have made a detailed analysis of all the
tropical cyclones that formed in the N.I.O. during the FGGE year. More
reliable information exists on N.I.O cyclones during the 1979 FGGE year
than at any other time because of the special observing systems and
analysis procedures which were established for that year alone. This
included the very unique and well archived European Center for Mediun-
Range Forecasts (ECMWF) FGGE year analysis of this region. We are also
making much use of the ECMWF analysis to study tropical cyclones in the
other global storm basins (see Lee, 1984; Chen and Gray, 1984; and Askue
and Lee, 1984). We have found the ECMWF objective analysis to be very
reliable and most useful for the understanding of tropical cyclones in
the northwest Pacific and Atlantic. Comparisons using independent
rawinsonde analysis (to be shown later) have shown the ECMWF analysis to
be quite reliable — especially the large-scale rotational or tangential
component of the wind fields and the general wind analyses at lower and
upper tropospheric levels where SV£ satellite wind vectors and/or
aircraft data are available in large numbers.
This study does not treat the more numerous tropical depressions
that form in the Bay of Bengal during the summer season (Saha et al.,
1981).
We hope that this report will give the reader a better overall
understanding of N.I.O. tropical cyclones that form almost exclusively
in the late spring and autumn seasons.
We will first discuss the long-term climatology of N.I.O. tropical
cyclones, then discuss the typical environmental flow features in which
these cyclone systons typically form. A detailed analysis of each
cyclone system by itself will then be given. We will also compare
N.I.O. cyclones with northwest Pacific tropical cyclones and discuss the
distinctive features of N.I.O. tropical cyclones.

2. TROPICAL CYCLONE CLIMTOLOGY
2.1 Yearly, Seasonal and Monthly Frequency
Unlike tropical cyclone formation in the other ocean basins
tropical cyclones of the N.I.O. form in the late spring and autumn
seasons. The summer is mostly devoid of tropical cyclones although many
monsoon depressions form in the northern part of the Bay of Bengal
during the summer period of June through September. But very few of
these monsoon depressions, ever intensify to cyclones of tropical storm
strength. This report deals mainly with tropical cyclones that develop
sustained low-level wind velocities and were reported as significant
tropical cyclones by JTWC or Indian Meteorological Agency.
Table 1 gives a yearly listing of the number of N.I.O. tropical
cyclones and hurricanes that have been reported since 1958. Generally,
the yearly variation of cyclone number is not large. N.I.O. tropical
cyclones represent about 7-87o of the 80 or so tropical cyclones and
hurricanes that form per year about the globe. Figure 1 gives the
tracks of N.I.O. tropical cyclones during the 10-year period of 1968-
1977,
Earlier Climatology. A study by Bansal and Datta (1972) has shown
that from 1891 to 1970 there were 362 cyclonic storms (2 17 m/s) that
originated in the Bay of Bengal, or about 4.5 storms per year. Another
study by Mooley (1980) indicates 453 cyclonic storm systems in the 101-
year period of 1877-1977. These figures are higher than that obtained

TABLE 1
Yearly nuEber of reported tropical cyclones in the North Indian Ocean from Indian Meteorological Agency and jr.VC.
Numb< sr of r eported ,..
trop; ical cy clones Number of reported from Indian Meteor- tropical cyclones
year OIOR: Leal As ency Year from JTWC ATR
1958 5 1975 ^ 6 1959 6 1976 5 " 1960 4 ', 1977 5 1961 6 1978 4 1962 5 1979 7 1963 6 ' 1980 2 1964 7 1981 3 1965 6 1982 " 5 1966 9 1983 3 1967 6
7 . -
1968 Average 4.' i 1969 : 6 ■ ':
1970 7 1971 6 1972 6 1973 ■: 6 1974 7 Average 6.2
from the JTWC ATR (Annual Typhoon Report) 1975-1983 average of 3.0
significant tropical cyclones per year in the Bay of Bengal. The
differences between these figures appear to be due to the use of
different data sources and the uncertainty in determining the cyclone
intensity. The previous two studies utilized the data collected by the
Indian Meteorological Agency, which uses different definitions for the
intensity of tropical cyclones (see Table 2). On the other hand, JTWC
uses different criteria for issuing tropical cyclone warning. For
example, Typhoon Hope (1979) moved westward across the south China Sea
and SE Asian Peninsula and into northeast Bay of Bengal in August, 1979.
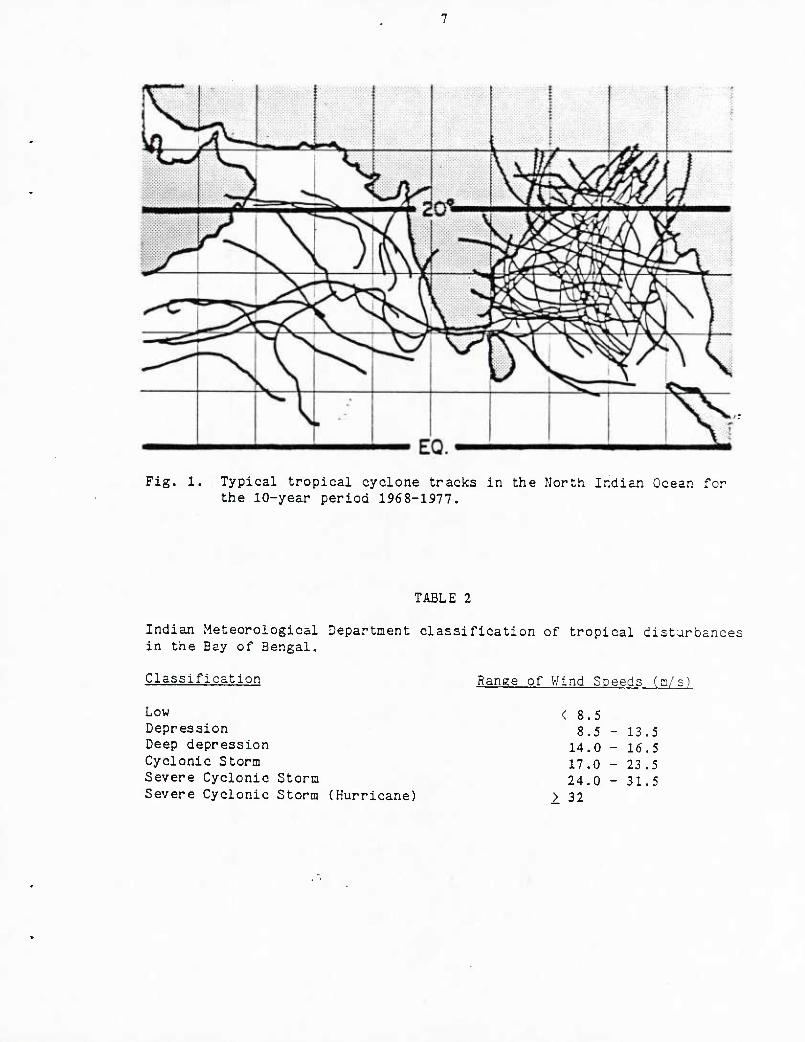
Fig. 1. Typical tropical cyclone tracks in the North Indian Ocean for the 10-year period 1968-1977.
TABLE 2
Indian Meteorological Department classification of tropical disturbances in the Bay of Bengal.
Classification
Low Depression Deep depression Cyclonic Storm Severe Cyclonic Storm Severe Cyclonic Storm (Hurricane)
Range of V/ind Speeds (m/s
< 8 5 8 5 - - 13 5
14 0 - - 16 .5 17 0 - - 23 5 24 0 - - 31 .5
> 32

. , 8; ''-■■-■■ ■':
The JTV/C ATR did not report it as a tropical cyclone in the M.1,0., but
the Indian Meteorological Agency (as discussed by De Angelis, 1980c)
did.
■ We believe that the Indian Meteorological Office sometimes listed
Bay of Bengal monsoon disturbances as tropical cyclones when (by JTWC
criteria) they were not. In other words. JTWC rarely warned on systems
that originated in the northern Bay of Bengal and could possibly be
interpreted as monsoon depressions. A comparison of the monthly
frequencies of tropical cyclones reported by JTWC and the Indian
Meteorological Agency (Tables 3 and 5) reveal that the largest
difference occurs during summer (June-August) or the most active period
for monsoon depression.'
"' " Bansal and Datta's (1972) tabulations indicated that there were 98
cyclonic storms in the Arabian Sea region during the 80-year period of
1891-1970. The average number was 1.2 storms per year. This is not
much different from the recent year value of 1.4 cyclones per year which
have occurred over the last nine years (as monitored by JTWC). The
difference between the number of tropical cyclones in the Bay of Bengal
and Arabian Sea by Bansal and Datta's estimate was 3.75 to 1. Recent
year information places the figure at about 2 to 1. These differences
are due to the new case count of tropical cyclones in the Bay of Bengal
being decreased.
Among the 362 cyclonic storms (or systems with V 2 17 m/s) in
the Bay of Bengal as listed by Bansal and Datta, 132 or 3 6% were
reported to be of severe cyclonic storm strength (V y_ 24 m/s). In
the Arabian Sea- 53 of 98 or 54% were so classified. These numbers agree
qualitatively with those reported by JTWC, in terms of the numbers.
Arabian Sea tropical cyclones (although fewer in number) are, in
general, somewhat stronger than Bay of Bengal tropical cyclones.
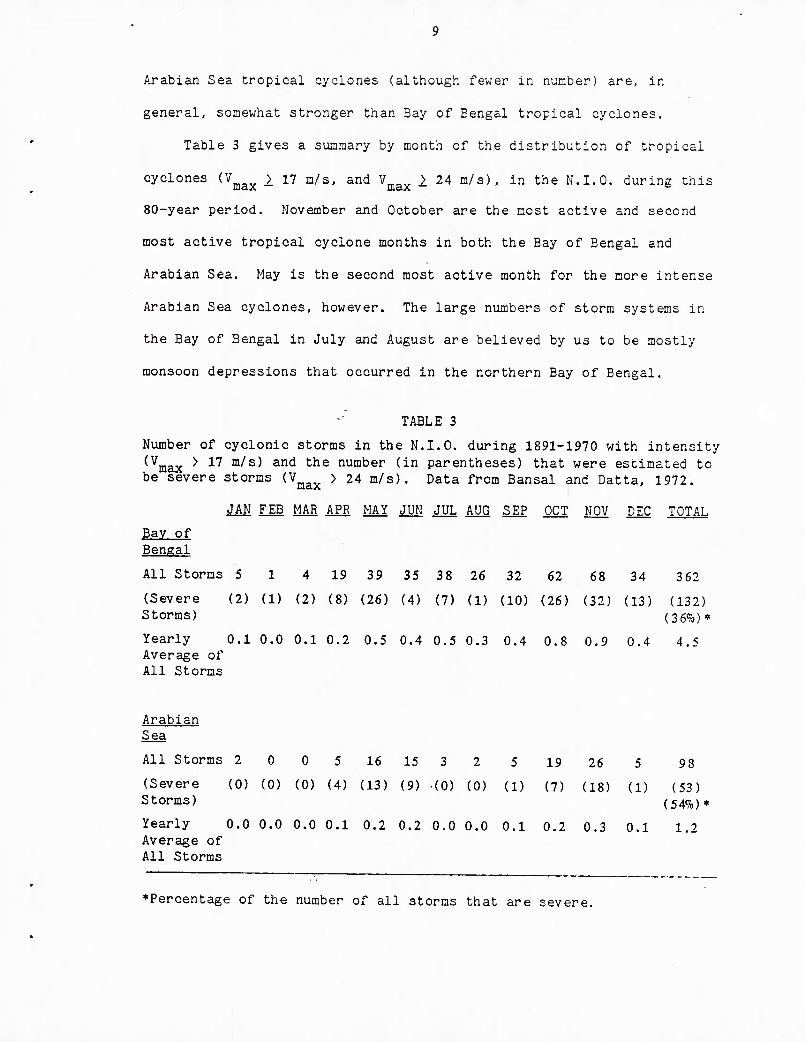
Table 3 gives a summary by month of the distribution of tropical
cyclones (V^^^ 2 17 m/s. and V^^^ > 24 m/s), in the N.I.O. during this
80-year period. November and October are the most active and second
most active tropical cyclone months in both the Bay of Bengal and
Arabian Sea. May is the second most active month for the more intense
Arabian Sea cyclones, however. The large numbers of storm systems in
the Bay of Bengal in July and August are believed by us to be mostly
monsoon depressions that occurred in the northern Bay of Bengal.
TABLE 3
Number of cyclonic storms in the N.I.O. during 1891-1970 with intensity ^^max ^ ^"^ ^^^^ ^"*^ ^^^ number (in parentheses) that were estimated to be severe storms (V^^^^^ > 24 m/s). Data from Bansal and Datta, 1972.
JAN FEE MAR APR MAY JUN JUL AUG SEP OCT NOT DEC TOTAL
Bay of Bengal
All Storms 5 1 4 19 39 35 38 26 32 62 68 34 362
(Severe (2) (1) (2) (8) (26) (4) (7) (1) (10) (26) (32) (13) (132) Storms) (3 6%)*
Yearly 0.1 0.0 0.1 0.2 0.5 0.4 0.5 0.3 0.4 0.8 0.9 0.4 4.5 Average of All Storms
Arabian Sea
All Storms 2 0 0 5 16 15 3 2 5 19 26 5 98
(Severe (0) (0) (0) (4) (13) (9) (0) (0) (1) (7) (18) (1) (53) Storms) (54%)*
Yearly 0.0 0.0 0.0 0.1 0.2 0.2 0.0 0.0 0.1 0.2 0.3 0.1 1,2 Average of All Storms
♦Percentage of the number of all storms that are severe.
10
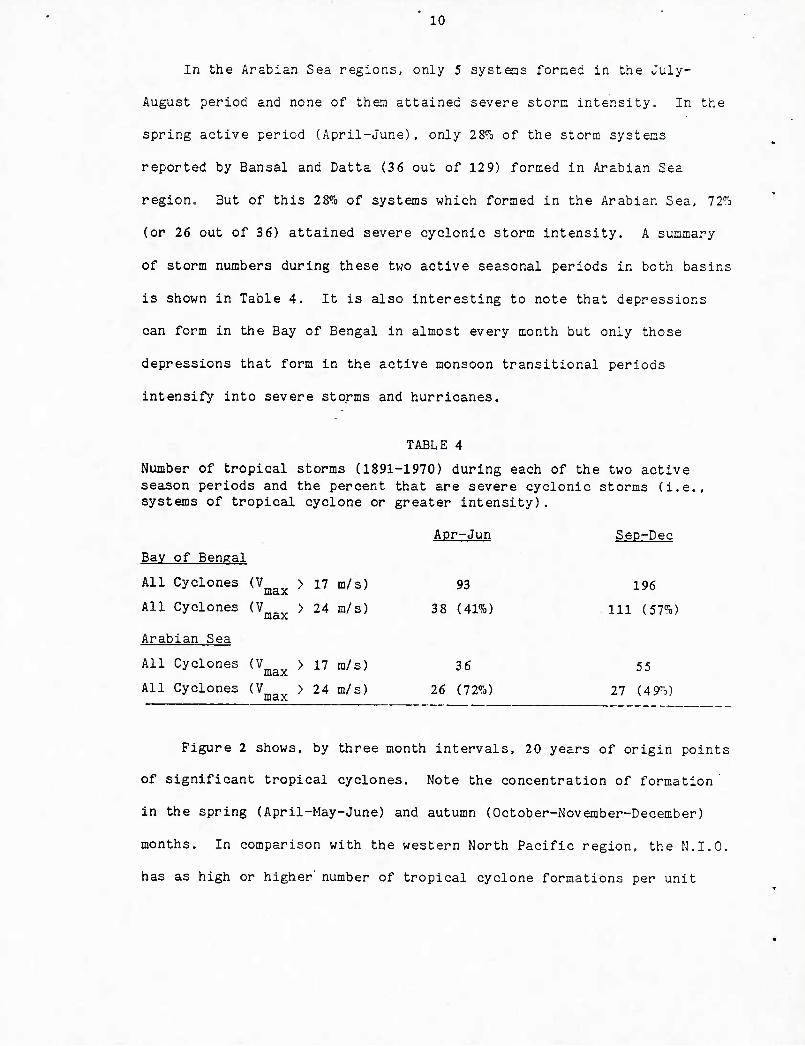
In the Arabian Sea regions, only 5 systems formed in the July-
August period and none of them attained severe storm intensity. In the
spring active period (April-June), only 28"^3 of the storm systems
reported by Bansal and Datta (36 out of 129) formed in Arabian Sea
region. But of this 28% of systems which formed in the Arabian Sea, 72T3
(or 26 out of 36) attained severe cyclonic storm intensity. A summary
of storm numbers during these two active seasonal periods in both basins
is shown in Table 4. It is also interesting to note that depressions
can form in the Bay of Bengal in almost every month but only those
depressions that form in the active monsoon transitional periods
intensify into severe storms and hurricanes.
TABLE 4
Number of tropical storms (1891-1970) during each of the two active season periods and the percent that are severe cyclonic storms (i.e., systems of tropical cyclone or greater intensity).
Apr-Jun Sep-Dec
Bay of Bengal
All Cyclones (V > 17 m/s) 93 196
All Cyclones (V^^^ > 24 m/s) 38 (41%) 111 (57%)
Arabian Sea
All Cyclones (V > 17 m/s) 36 55
All Cyclones (V > 24 m/s) 26 (72%) 27 (49^^) ulaX
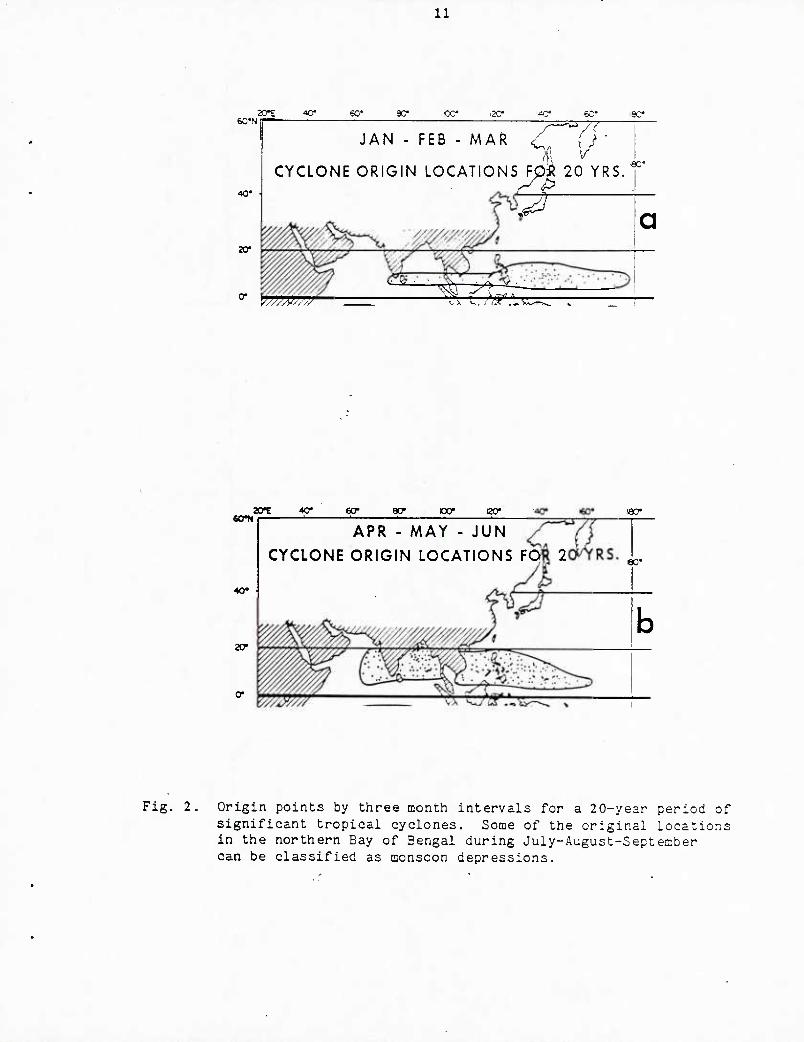
Figure 2 shows, by three month intervals, 20 years of origin points
of significant tropical cyclones. Note the concentration of formation
in the spring (April-May-June) and autumn (October-November-December)
months. In comparison with the western North Pacific region, the N.I.O.
has as high or higher number of tropical cyclone formations per unit
11
60'N
40'
20*
SCTE 40* 60* 80* cc* i2C- iC*
JAN-FEB-MAR .
CYCLONE ORIGIN LOCATIONS FOiR 20 YRS.
sc
SC'
a
',.,'-•. /
«<rN are 40* 60* or CO* ecr ecr
40* •
2cr
APR - MAY - JUN
CYCLONE ORIGIN LOCATIONS FOtt 2 eo-
Fig. 2. Origin points by three month intervals for a 20-year period of significant tropical cyclones. Some of the original locations in the northern Bay of Bengal during July-August-Septecber can be classified as monsoon depressions.

12
60n<
KT
aCTE KT 60* 80" CO* 120* h^O- .«0* SO*
JUL - AUG - SEP
CYCLONE ORIGIN LOCATIONS F^^ 20 YRS.^*
60^
40*
aoT «• 60* atr oo* see wo* leo* eo*
OCT - NOV - DE
CYCLONE ORIGIN LOCATIONS FjQR 20 YRS. eo*
Fig. 2. Continued.
' ■■ j ' - 13
area as the Pacific. Differences in total nunbers of storms are more a
result of the larger Pacific formation area. •
N.I.O. Tropical Cyclones Monitored by JTVJC in Recent Years. Before
1974 the Guam Joint Typhoon Warning Center (JTWC) area of responsibility
did not include the Arabian Sea region. Valid statistics using
satellite information and the Dvorak intensity classification (1975) are
available only since 1975. By JTWC standards, using the Dvorak
classification scheme, the number of tropical cyclones in the N.I.O. is
about 4.4 per year. This is about 1.3 fewer storms per year than
indicated by previous Indian estimates. This is, as has been discussed,
a consequence of the Indian Meteorological Agency classifying quite a
few monsoon depressions as cyclone systems during the summer period.
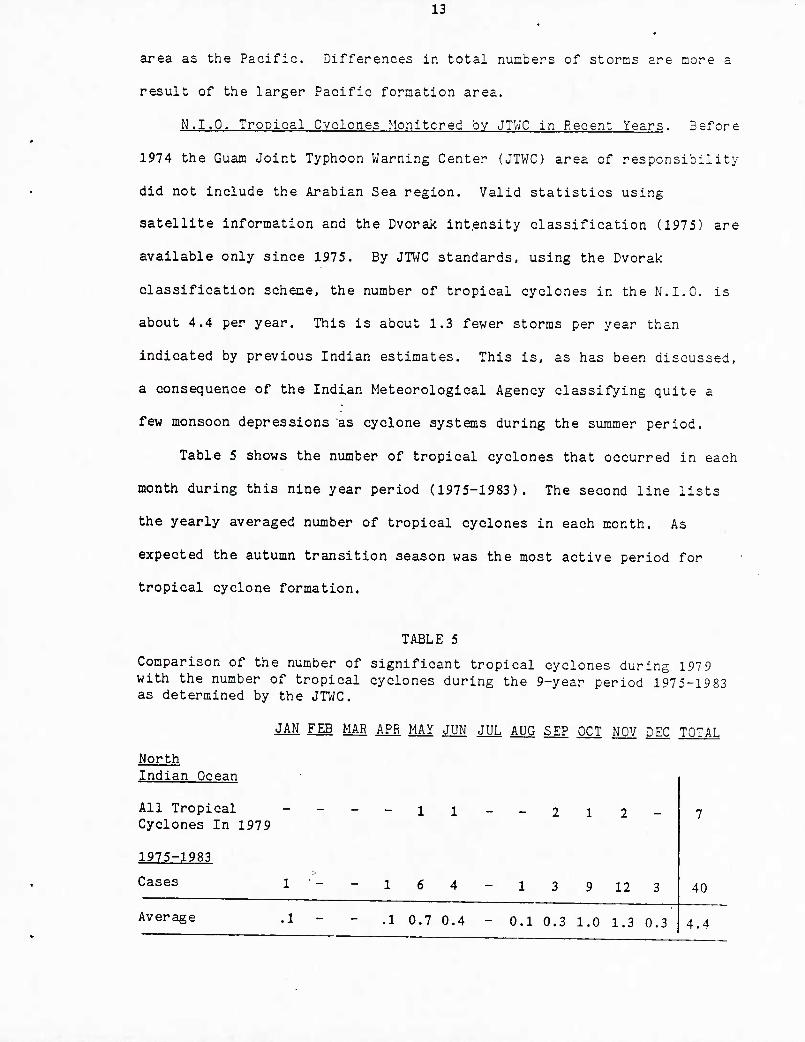
Table 5 shows the number of tropical cyclones that occurred in each
month during this nine year period (1975-1983). The second line lists
the yearly averaged number of tropical cyclones in each month. As
expected the autumn transition season was the most active period for
tropical cyclone formation.
TABLE 5
Comparison of the number of significant tropical cyclones during 1979 with the number of tropical cyclones during the 9-year period 1975-1983 as determined by the JTWC.
JAN Fffi MAR APR MAY JUN JUL AUG SEP OCT NOT DEC TOTAL
North Indian Ocean
All Tropical ----11 --21 2- Cyclones In 1979
1975-1983
Cases 1 - - 1 6 4 - 1 3 9 12 3 40
Average .1 - - .i o.7 0.4 - 0.1 0.3 1.0 1.3 0.3 4.4

14 • : • ■
Among these 40 systems of tropical cyclones, 27 or about two-
thirds formed in the Bay of Bengal region and 13 (or one-third) in the
Arabian Sea. Two systems formed in the Bay of Bengal but traveled into
the Arabian Sea and maintained their tropical storm intensity (maximum
sustained winds 2 35 kts) in both basins. Among the 27 tropical
cyclones that formed in the Bay of Bengal, 6 (or 22%) were estimated to
have attained typhoon intensity (2 65 kts) . The average maximum
intensity of these 27 Bay of Bengal tropical cyclones was 56 kts. In
the Arabian sea region, 4 of the 13 tropical cyclones (or 31%) attained
typhoon intensity. Their average maximum wind speed was 60 kts. There
was about a two to one difference in the number of tropical cyclones
that formed in the Bay of Bengal in comparison with the Arabian Sea.
This is in general agreement with previous estimates. A higher
percentage of Arabian Sea tropical cyclones appear to form in the
spring period as compared with the Bay of Bengal. And a slightly
higher percentage of the cyclones that form in the Arabian Sea reach
hurricane intensity.
2.2 Favorable Environmental Setting for Cyclone Formation
We will now discuss the climatology of the general environmental
setting in which tropical cyclones can form in the N.I.O.
Sea-Surface Temperature and Ocean Energy Contents. Warm ocean
temperatures and the depth to which this warm ocean water penetrates
into the N.I.O. are quite substantial in all seasons. These warm ocean
temperatures are a necessary ingredient to tropical cyclone formation.
Provided that wind and other dynamic factors are satisfactory, tropical
cyclone formation (at least from an ocean energy point-of-view) can
occur in any month in the N.I.O.
.15
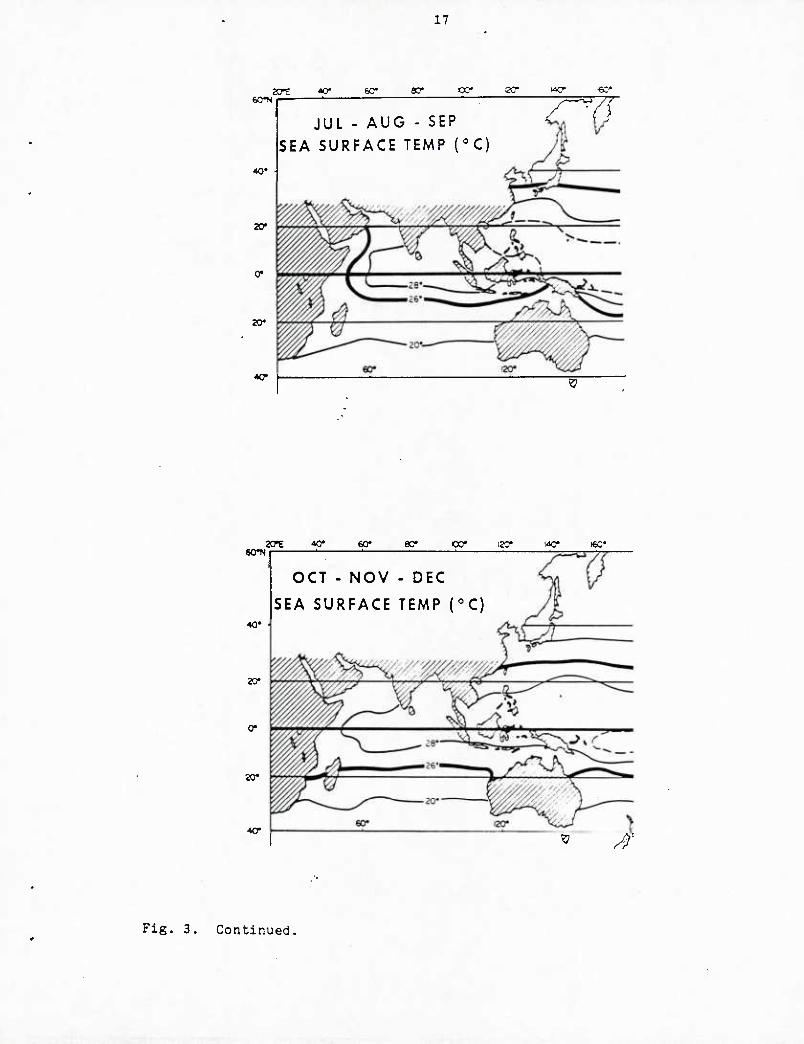
Figures 3 and 4 show seasonal values of these paraneters. Note how
the 28°C sea-surface temperature and ocean temperature above 26°C
extends down to below 60 meters depth in all seasons in the southern
half of both the Bay of Bengal and in the Arabian Sea. Tropical cyclone
formation requires that ocean temperatures be above 26°C and that warm
tenperatures extend to a depth of 50-100 meters or so.
The lack of tropical cyclones in the N.I.O. during the summer
season is due to dynamical processes associated with the shift of the
monsoon trough to northern India, not to any reduction in ocean energy
content.
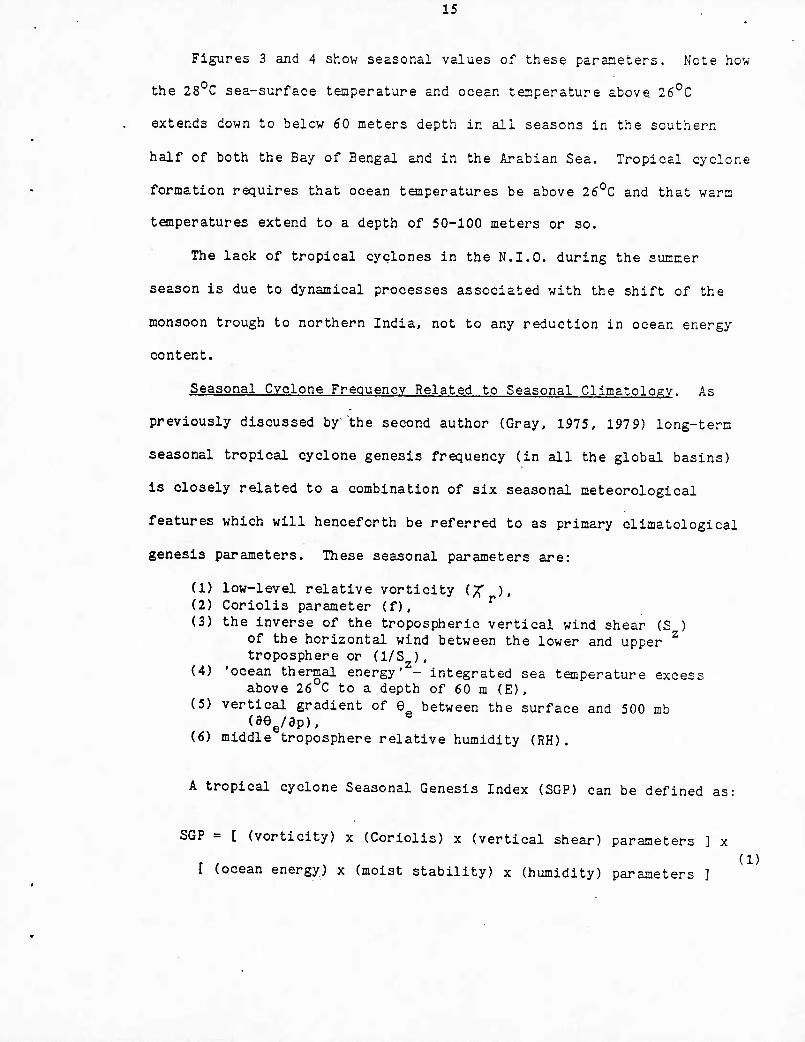
Seasonal Cyclone Frequency Related to Seasonal Climatology. As
previously discussed by" "the second author (Gray, 1975, 1979) long-term
seasonal tropical cyclone genesis frequency (in all the global basins)
is closely related to a combination of six seasonal meteorological
features which will henceforth be referred to as primary climatological
genesis parameters. These seasonal parameters are:
(1) low-level relative vorticity (X ), (2) Coriolis parameter (f), '^ (3) the inverse of the tropospheric vertical wind shear (S )
of the horizontal wind between the lower and upper ^ troposphere or (1/S ),
(4) 'ocean thermal energy' - integrated sea temperature excess above 26 C to a depth of 60 m (E),
(5) vertical gradient of e between the surface and 500 mb (se^/ap),
(6) middle troposphere relative humidity (RH).
A tropical cyclone Seasonal Genesis Index (SGP) can be defined as:
SGP = [ (vorticity) x (Coriolis) x (vertical shear) parameters ] x
[ (ocean energy) x (moist stability) x (humidity) parameters ]

16
tCTH srz <r (cr ecr co* ec MJC
XT
Mr
(OTi
40*
ar
cr
20*
*cr
acre «• so* acr ccr acr t«r t&y
Fig. 3. Seasonal sea surface temperature over the Indian Ocean,
17
60^ 20^ 40" 60* ac OC* iSC -lO* «•
40* •
20"
20*
40*
JUL - AUG - SEP
SEA SURFACE TEMP (°C)
^
60^
40*
20*
0*
20*
4Cr
zrz 40* 60* ao* oo* izo* i4o* leo*
OCT - NOV - DEC
SEA SURFACE TEMP (°C)
^ ;?
Fig. 3. Continued,

KTH
40* •
art «• y. 80* DO* eo- ^^ lay
JAN - FEB - MAR
DEPTH OF 26°C ISOTHERM {m
eCTN
*ar
ZTE «• ecr 80' oo- ecr i^cr 'SO*
APR - MAY -JUN
DEPTH OF 26°C ISOTHERM (m)/^
Fig. 4. Depth (in meters) of the 26° isotherm over the Indian Ocean by season.

19
!■ tcm
40*
ZCTE <r 60* 80" txr sc i*cr «r
JUL - AUG - SEP
DEPTH OF 26°C ISOTHERM,(r
ao*
40* ?7 T^
«ru xrz 40* 60* 80* ocr ecr WO" 160*
Fig. 4. Continued.

20
This seasonal tropical cyclone Genesis Index may also be thought of
as in the form: ' .
SGP = (dynamical potential) x (thermal potential).
where
dynamic potential = [(vorticity)x(Coriolis)x(vertical shear) parameters]
thermal potential = [(ocean energy)x(moist stability)x(humidity) parameters]
The product of dynamic potential and thermal potential is defined
as the Seasonal Genesis Index. When expressed in this way with the
proper units (see original papers) this SGP gives a very good estimate
of the seasonal tropical cyclone genesis frequency in number per 5°
latitude-longitude square per 20 years in all seasons and at all global
locations.
The very close correspondence between predicted and observed
seasonal cyclone frequency lends support to this argument concerning the
relevant seasonal climatological factors which are necessary for cyclone
genesis.
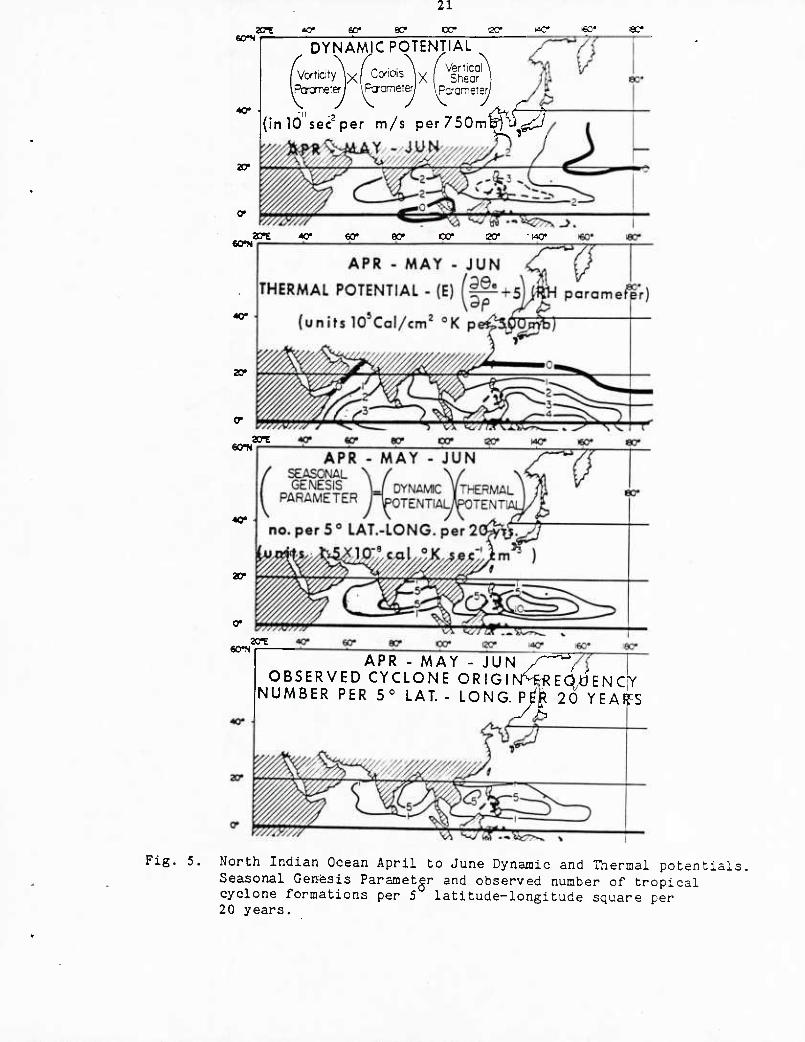
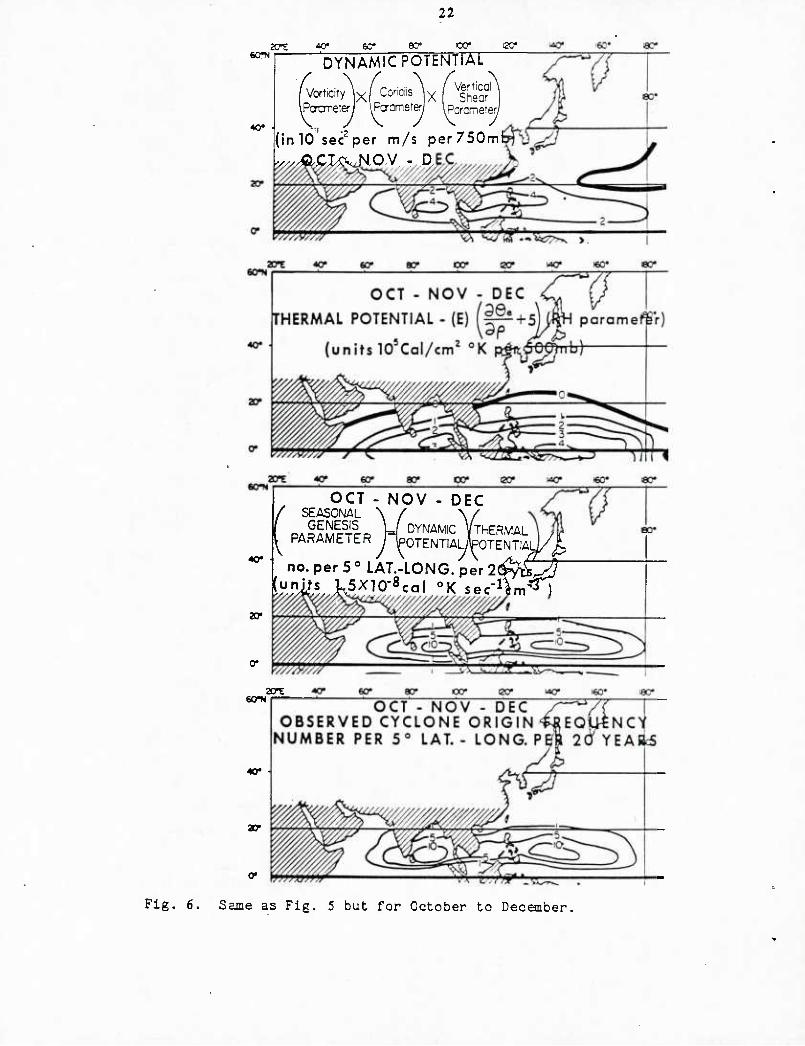
Figures 5 and 6 show these dynamic and seasonal potentials and
their product (the Seasonal Genesis Parameter) for the spring and autumn
periods of major cyclone formation. The bottom diagram in both of these
figures shows the observed number of tropical cyclone formations per 5°
latitude-longitude square per 20 years. This is to be compared with the
third figure from the top.
It is seen how closely the seasonal climatology of these six
parameters dictates the number of cyclones which form in the N.I.O. even
though the days of cyclone genesis (1-15 per 5° square per 20 years)
tCTH
My
20*
ZT^ tcr 60* XT
21
oc* 2C k4C «0* 8C*
DYNAMIC POTENTIAL
(Co.t,aty\(ca.d,s\ f V|SM iPcTometerl \P^Q!T&\&J IParcmeTer/
(inlOsec^per m/s per ZSOm'^J^;:!/
6074
40*
ao*
aOT 40* 60* 8Cr CO* 20* -wo*
60^
40»
ao-
aoT
eCTN 20^
APR - MAY - JUN /—^; OBSERVED CYCLONE ORIGINHf?EQ^ENC|Y
..HMoco o.n .. .., -^^^20 YEA^S NUMBER PER 5° LAT. - LONG. P
Fig. 5. North Indian Ocean April to June Dynamic and Thermal potentials. Seasonal Genesis Parameter and observed number of tropical cyclone formations per 5 latitude-longitude square per 20 years.
22
DYNAMIC POTENTIAL
'Vo.i,a»y\(ccncl,s\^Vert.^^
Pouneterl IPaameted Ipcrcn-.ete.y
(inlO sec^per m/s per750ml
OV -DJ
OCT SEASONAL GENESIS
«y ■
NOV - DEC
DAOAMCTCD H DYNAMIC YTHERMAL , ,«- PARAMETER nPOTENTIAjpOTENTIAll/^
ar
no. per 5° LAT.-LONG -8 K sec-lim^
60^
«)•
aCTE
Fig. 6. Same as Fig. 5 but for October to December.

23
make up but a very small percentage of the season. It was not expected
that the agreement between predicted and observed genesis frequencies
would be this close. Not only is the correlation of the six seasonal
parameters with genesis frequency noteworthy, but the physical rationale
concerning the effects of these parameters which also is important.
There is thus some rational quantitative explanation as to why the
long-term frequency of tropical cyclones in the N.I.O. is as observed.
The N.I.O. thermal potential changes little during the spring and
autumn seasons. It is mainly the day-to-day variations in the dynamic
potential that must be watched for in predicting the day-to-day
potential for cyclone formation. This is mostly determined by the
strength and location of the monsoon trough. The presence of the
monsoon trough between 5-15 N latitude assures that upper tropospheric
winds will be such that easterly zonal winds will prevail equatorwards
of the monsoon trough and westerly zonal winds on the poleward side of
the trough.

24
3. SYNOPTIC ENVIRONMENT IN WHICH NORTH INDIAN OCEAN TROPICAL CYCLONES FORM
Tropical storms form in the monsoon transitional seasons of spring
and autumn in the N.I.O. because it is only during these periods that
the monsoon trough is located sufficiently south (~ 5-15°N) that a broad
oceanic area is available for cyclone development. During the summer
periods of late June through early September, the monsoon trough is
typically located over the Ganges Valley and at the head of the Bay of
Bengal. Vertical wind shear over the Bay of Bengal and Arabian Sea are
too strong to permit tropical cyclones in these seasons. As discussed
by the second author (Gray, 1968, 1975), tropical storms form only when
the tropospheric vertical wind shear over the incipient disturbance is
very weak. Such small wind shear conditions typically occur only during
the monsoon transitional periods of late April through June, and late
September through early December. It is at these times that the
tropospheric vertical shear of zonal wind (U) or (U^„„ ^-u„ „ ) 10° to 200mb 850mb
the poleward side of the monsoon trough is strongly positive while 10°
to the equatorwards side this shear is strongly negative. The change of
sign of this tropospheric zonal wind shear from south to north assures
that a region of zero or minimum shear exist near the monsoon trough
axis.
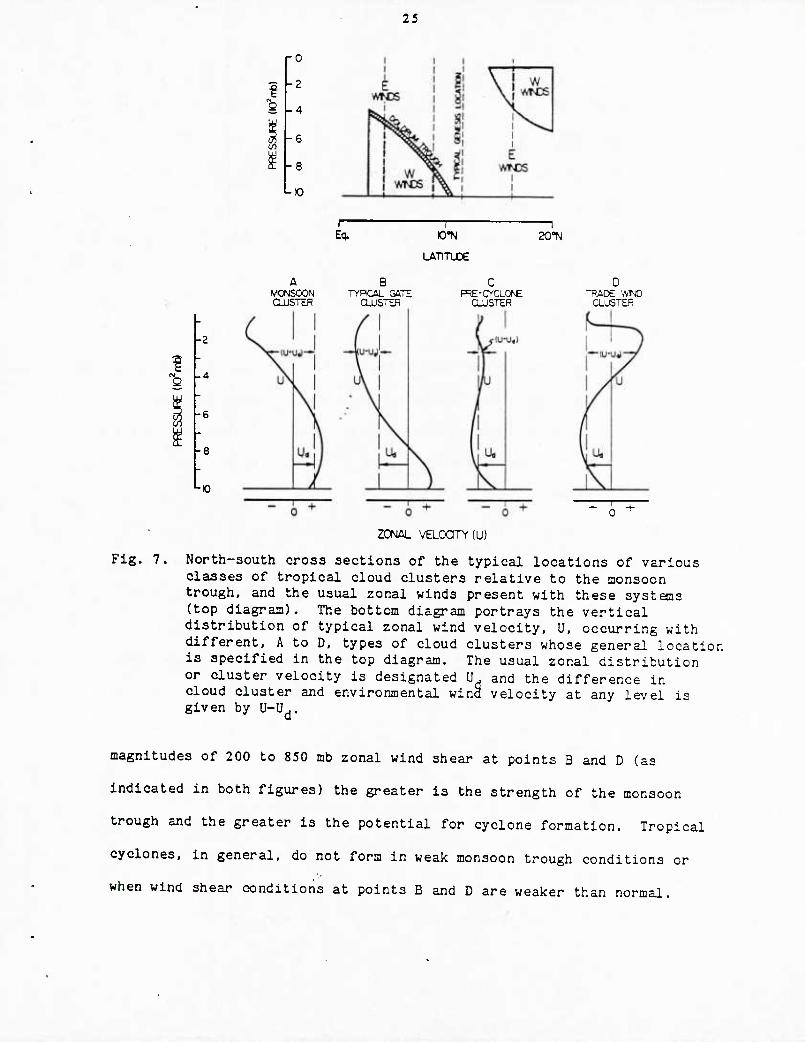
Figure 7 shows the type of tropospheric vertical wind shear
conditions required for tropical cyclone formation in the N.I.O.
^200mb~^850mb '°^^*' change sign as one proceeds northward from the
equatorward to the poleward side of the monsoon trough. The greater the
25
•-10
-0
-2
-4
-6
-8
-O
Eq.
LATlTUCe
20"N
A MCNSOON CLUSTER
TYPICAL GATE CLUSTER
PRE-CYCLO^E CLUSTER
ZC>JAL VELOaTY(U)
■ D TRACe wrjo
CLJSTER
+
Fig. 7. North-south cross sections of the typical locations of various classes of tropical cloud clusters relative to the monsoon trough, and the usual zonal winds present with these systems (top diagram). The bottom diagram portrays the vertical distribution of typical zonal wind velocity, U, occurring with different, A to D, types of cloud clusters whose general location
.' is specified in the top diagram. The usual zonal distribution or cluster velocity is designated U, and the difference in cloud cluster and environmental wind velocity at any level is given by U-U..
magnitudes of 200 to 850 mb zonal wind shear at points B and D (as
indicated in both figures) the greater is the strength of the monsoon
trough and the greater is the potential for cyclone formation. Tropical
cyclones, in general, do not form in weak monsoon trough conditions or
when wind shear conditions at points B and D are weaker than normal.

26
As will be discussed in Chapter 6, all seven tropical systems that
developed in the N.I.O during the 197 9 FGGE year exhibited this type of
vertical wind shear about the monsoon trough. In general, the potential
for tropical cyclone formation increases the larger the tropospheric
vertical wind shear is about 6° north and about 6° south of the
incipient disturbance. See previous CSU research by McBride, 1981;
McBride and Zehr, 1981 for more discussion of this genesis criterion.
This criterion implies that the vertical gradient of vcrticity between
850 mb and 200 mb around the incipient pre-cyclone disturbance at 6°
radius be as negative as possible. The more negative this value is, the
higher the potential for.cyclone development. The most important
ingredient for tropical cyclone development is not just the amount and
intensity of Cb convection associated with the tropical disturbance, but
rather the existence of the tropical disturbance in a favorable strong
monsoon trough environment. If the surrounding environmental wind
conditions through the troposphere are not favorable then tropical
cyclone formation will almost never take place irrespective of the
amount and intensity of deep convection currently occurring.
Figures 8 and 9 show a composite of the 850 mb and 200 mb zonal
wind patterns surrounding the initial location positions of 54 N.I.O.
tropical disturbances which later developed into tropical cyclones.
Note that the 850 mb westerly winds south of these disturbances are
typically stronger than the trade winds to the north. Also note that
200 mb easterly winds are blowing over the disturbance center. Figure
10 shows the composite of 850 mb to 200 mb zonal wind shear patterns
surrounding these pre-tropical storm cases. Note the westerly
tropospheric wind shear to the north and the easterly tropospheric wind
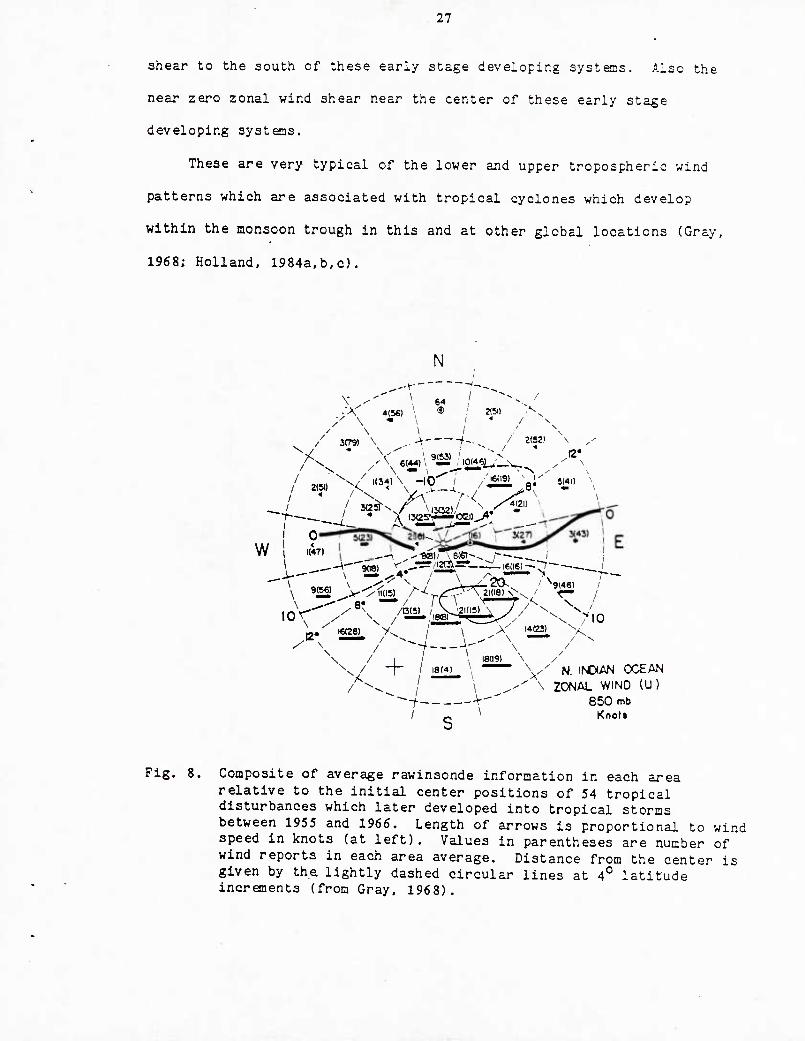
27
shear to the south of these early stage developing systems. Also the
near zero zonal wind shear near the center of these early stage
developing systems.
These are very typical of the lower and upper tropospheric wind
patterns which are associated with tropical cyclones which develop
within the monsoon trough in this and at other global locations (Gray,
1968; Holland, 1984a,b,c).
N
^/
\
\ 4(56)
€4 2(5)1
/ \ \ 6(44) \ ^Si^_I0(46]_._^
-v /
"v
2(52>
12*
5(41) / ^^ / 1(^41 \ -in / , «(i9) "■ 1^ / 2(5« X'"1'\ 'Y-i /—^a* -■■ ^ / * / ^^ ^ ■''•< y^ " \
™« . , \.^,., "^ ^^(21)
I 0 W 1 1(47)
/n(5) / _\^ 121(15) \ y / \_ V
—*^^ /i2(A=^ ^ 16(16)-~77'~- ,
\ 9(56) r- /
\ / \
l€(28) N /
14(23)
X / 1 / \ 18(19) \ -r / 18(4) \ —— \ y
A, / X
>
' s
N. iNDtAN OCEAN \ ZONAL WIND (U)
850 mb Knott
Fig. 8. Composite of average rawinsonde information in each area relative to the initial center positions of 54 tropical disturbances which later developed into tropical storms between 1955 and 1966. Length of arrows is proportional to wind speed in knots (at left). Values in parentheses are number of wind reports in each area average. Distance from the center is given by the. lightly dashed circular lines at 4° latitude increments (from Gray, 1968).

28
•'X 22(56) \ ■ / ^,^,
/304) \ \ ---/ r^"^ ,^ Vrt
-2a ^ -^^' I20O \^ /' J44«g) ^- ■/-■
/
•--20
B.^ 24(28) X^
^^^ /'''' , ^ r—\ X / 4- / 2.(2) \lii^ir\—-■
"^~ \-- / - \ N- INDIAN OCEAN
S ZONAL WIND (U) 200 mt
Knof*
Fig. 9. Same as Fig. 8 but for the 200 mb level.

29
/ \
/ / ~^v >^ >< --''
■20
I
w — 10(541 I 19 (aT" I
'6(16) V ll(2S) I I3(*«)
-40-ir-ii 40(?9i ^< rrxtsr V'^^USL^^ /^2--
N. INDIAN OCEAN
VERTICAL SHEAR OF ZONAL WINO
Fig. 10. Same as Fig. 8 but for the 200 mb minus 850 mb shear of zonal wind.

4. DATA SOURCES FOR CASE STUDY ANALYSIS AND CYCLONE STRUCTURAL DEFINITIONS
The data sources used in this study's analysis of individual N.I.O.
tropical cyclones are the FGGE Ill-b data of the European Center for
Medium-Range Weather Forecasts (ECMWF) and the National Oceanic and
Atmospheric Administration (NOAA) polar-orbiting satellite (TIROS)
picture. These satellite imageries are available on mosaics twice a day
in both IR and visible images for most of the days during the period
that tropical cyclones were present. The Annual Typhoon Report (ATR)
published by the Joint Typhoon Warning Center (JTWC). Guam was used to
determine the position and the intensity of our tropical cyclone cases.
A supplementary data source was the flow features and satellite pictures
during the summer MONEX (Quick look ''Summer MONEX Atlas'', Part I Saudi
Arabia phase) edited by Florida State University (Krishnamurti, et al.,
1980). These data are used for TC 17-79 (the most intense of the North
Indian Ocean systems) because of the missing TIROS data during this time
period.
The FGGE Ill-b data are available on plotted and analyzed charts in
book form published by ECMWF in 1981 and on larger maps which were
specially duplicated and purchased from the ECMWF facility. The
original FGGE Ill-b data are also available on 1.875 degree
latitude/longitude cartesian grids at 15 pressure levels. These data.
Including zonal and meridional wind (U,V), height, temperature, vertical
motion, and specific humidity, are packed and contained in 82 Terabit

31
Memory volumes at the National Center for Atmospheric Research (NCAR).
Full utilization was made of these archived data sources.
The FGGE level Ill-b data used in this study are the raw initial
values of the horizontal zonal and meridional components. These data
were extracted directly from the initial analysis of the pressure
levels. They have not been subjected to any vertical interpolation.
The analysis procedure used a primitive equation forecast for the first
guess, but after the initial analysis step, no model initialization took
place. For a complete description of the ECMWF analyzed FGGE Ill-b
data, please refer to the FGGE data management manuals or the FGGE
newsletter No. 1 (May, 1983).
For tropical cyclone studies, a cylindrical coordinate system is
preferable. The FGGE data, which were initially on cartesian grids,
have been linearly interpolated onto cylindrical grids. There are 13
radial and 16 azimuthal grid segments. The grid spacing is 1° latitude
radius (starting from 2° out from the cyclone center) and 22.5° azimuth.
The cylindrical grid point data of zonal and meridional wind components
(U, V) are converted to radial and tangential wind components (V v ) r' t
with respect to the cyclone center. The radial wind is then mass
balanced vertically from 100 mb to 1000 mb at every radius. The
pressure levels used in this study are 100, 150, 200. 250, 300, 400,
500, 700, 850, and 1000 mb. However, due to their better quality, the
low-level and upper-level data are more extensively used. (There are
many more surface observations than there are rawinsonde data. Many
satellite winds are used in the analysis). •
By comparing the FGGE analysis with our independent rawinsonde
data, Lee (1984) has previously shown that the FGGE data can reasonably

32
well represent the tropical cyclone circulation, especially beyond the
4-5° radius. ; ^
Layer Considerations. We have made much use of the ECIWF analysis
of the outflow layers of those cyclone systems. This analysis was based
on the combined satellite, rawinsonde and aircraft jet wind vectors
taken during the FGGE year. Due to the uncertainty of the height of the
satellite cloud vector wind, we considered it to be more appropriate to
average the 150 mb, 200 mb (weighted by a factor of 2) and 250 mb wind
vectors together to represent the upper level flow. This is an
important thing to do because of different heights of the maximum
outflow. Equatorial outflow layers are typically 25-50 mb higher than
poleward outflow layers. By averaging the 150, 200 and 250 mb layers
together we obtain a measure of the outflow which can be compared at all
azimuths.
On the other hand, we considered the low-level circulation to be
represented by the layer between 700 mb and 1000 mb. Low-level data are
considerably better due to the larger number of surface observations.
Definitions of Cyclone Structure. In discussing the
characteristics of tropical cyclones and comparing one cyclone with
another it is important to have methods of structural classifying
besides those of just maximum wind and central pressure. We have
recently established a new method of defining the structure of tropical
cyclones. It is based on the strength of the tangential wind at
different radii. We defined the cyclone structure by the low-level
tangential wind characteristics in four radial bands:
33
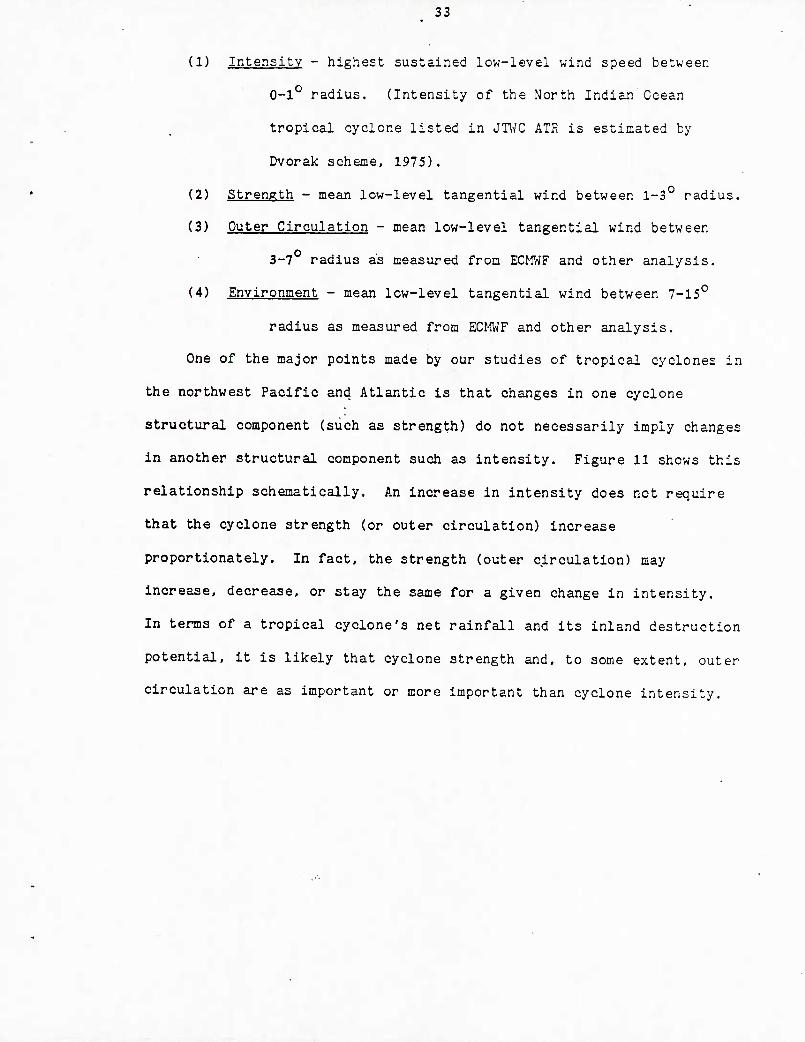
(1) Intensity - highest sustained low-level wind speed between
0-1*^ radius. (Intensity of the North Indian Ocean
tropical cyclone listed in JTOC ATR is estimated by
Dvorak scheme, 1975).
(2) Strength - mean low-level tangential wind between 1-3° radius.
(3) Outer Circulation - mean low-level tangential wind between
3-7 radius as measured from ECMWF and other analysis.
(4) Environment - mean low-level tangential wind between 7-15°
radius as measured from ECMWF and other analysis.
One of the major points made by our studies of tropical cyclones in
the northwest Pacific and Atlantic is that changes in one cyclone
structural component (such as strength) do not necessarily imply changes
in another structural component such as intensity. Figure 11 shows this
relationship schematicaLlly. An increase in intensity does not require
that the cyclone strength (or outer circulation) increase
proportionately. In fact, the strength (outer circulation) may
increase, decrease, or stay the same for a given change in intensity.
In terms of a tropical cyclone's net rainfall and its inland destruction
potential, it is likely that cyclone strength and, to some extent, outer
circulation are as important or more important than cyclone intensity.

34
V„„ = 60 m/s
ENVIRONMENT
3 4 5 RADIUS (* Latitude)
8
Fig. 11. Definition of tropical cyclone intensity, strength and outer circulation and their chauiges on a radial profile of azimuthally averaged tangential wind.

35
SUMMARY OF N.I.O. TROPICAL CYCLONES DURING THE FGGE YEAR AND TKEIR BASIC LARGE-SCALE CIRCULATION PATTERNS
During the 1979 First GARP Global Experiment (FGGE) year, the JTOC
observed seven tropical cyclones forming in the North Indian Ocean.
This is higher than the averaged number of four and one-half which JTWC
observed during the period of 1975-1983. Only one 1979 cyclone system
attained typhoon intensity. This is slightly lower than the yearly
average of 1.3. Table 6 gives a summary of the 1979 N.I.O. tropical
cyclone systems. Figure 12 shows a summary of the storm tracks. The
monthly distribution of these cyclone systems has already been presented
in Table 5. As in most other years the most active storm period was the
autumn.
Among the seven tropical cyclones in 1979, three, that is TC 17-79,
TC 18-79, and TC 23-79 attained an intensity level whereby their maximum
sustained winds (or V^^^^) was greater than 50 kts. TC 25-79 reached an
intensity of 40 kts. It persisted as a tropical cyclone for two days.
TC 24-79 attained an intensity of 35 kts and maintained this Intensity
for 12 hours shortly before it reached land. TC 22-79 and TC 26-79 did
not quite reach an intensity level of 34 kts.
Generally speaking, these weaker tropical cyclones are relatively
short-lived compared to those in other ocean basins, especially in the
northwest Pacific and northwest Atlantic. This is because tropical
cyclone formation in the N.I.O. typically occurs close to land. The
short life of some systems makes it a little more difficult to ascertain
so
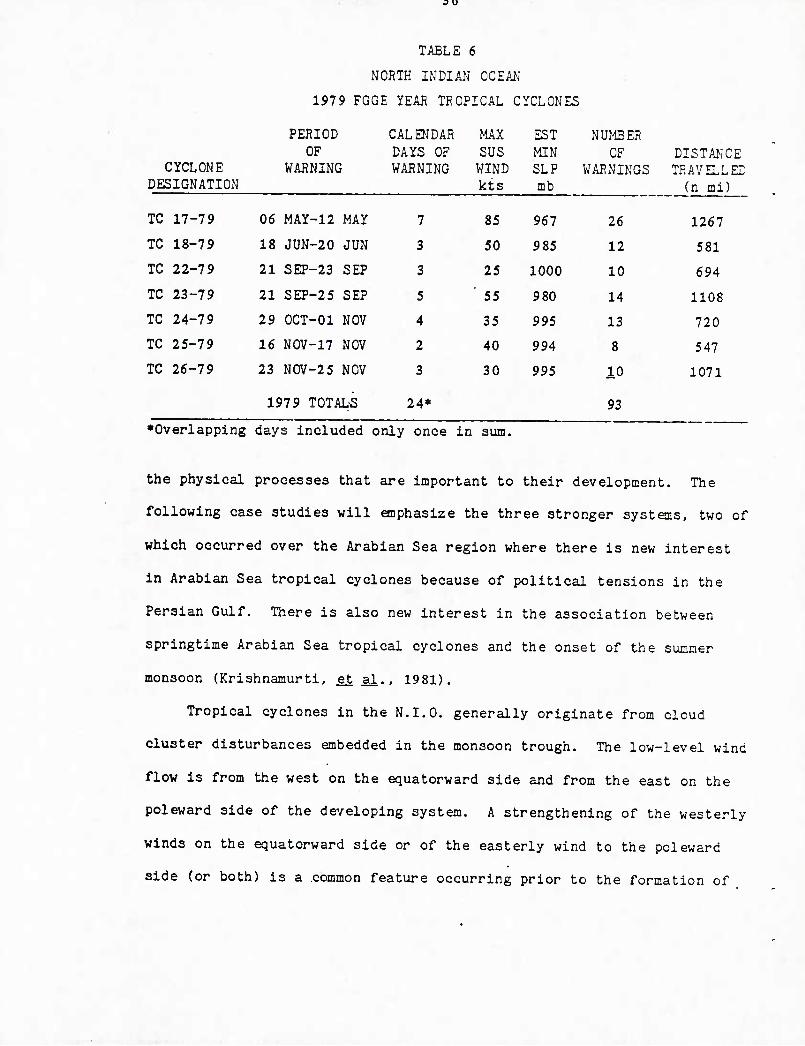
TABLE 6
NORTH INDIAN OCEAiJ
1979 FGGE YEAR TROPICAL CYCLONES
CYCLONE DESIGNATION
PERIOD OF
WARNING
CALENDAR MAX EST NUMBER DAYS OF SUS MIN OF DISTANCE WARNING WIND SLP WARNINGS TRAVELLED
kts mb (n mi)
1267
581
694
1108
720
547
1071
TO 17-79 06 MAy-12 MAY 7 85 967 26
TC 18-79 18 JUN-20 JUN 3 50 985 12
TC 22-79 21 SEP-23 SEP 3 25 1000 10
TC 23-79 21 SEP-25 SEP 5 55 9 80 14
TC 24-79 29 OCT-01 NOV 4 35 995 13
TC 25-79 16 NOV-17 NOV 2 40 994 8
TC 26-79 23 NOV-25 NOV 3 30 995 10
1979 TOTALS 24* 93
•Overlapping days included only once in sum.
the physical processes that are important to their development. The
following case studies will emphasize the three stronger systems, two of
which occurred over the Arabian Sea region where there is new interest
in Arabian Sea tropical cyclones because of political tensions in the
Persian Gulf. There is also new interest in the association between
springtime Arabian Sea tropical cyclones and the onset of the summer
monsoon (Krishnamurti. et al.. 1981).
Tropical cyclones in the N.I.O. generally originate from cloud
cluster disturbances embedded in the monsoon trough. The low-level wind
flow is from the west on the equatorward side and from the east on the
poleward side of the developing system. A strengthening of the westerly
winds on the equatorward side or of the easterly wind to the poleward
side (or both) is a .common feature occurring prior to the formation of

37
LTl
n <v c o •-t o >> o
CO o
T-l a. o i.
■u
c n> (V a O c CO
•H T3 C M
o
0\
o
o
x: H
38
tropical cyclones in this and other monsoon trough regions where cyclone
formation occurs (Love, 1982).
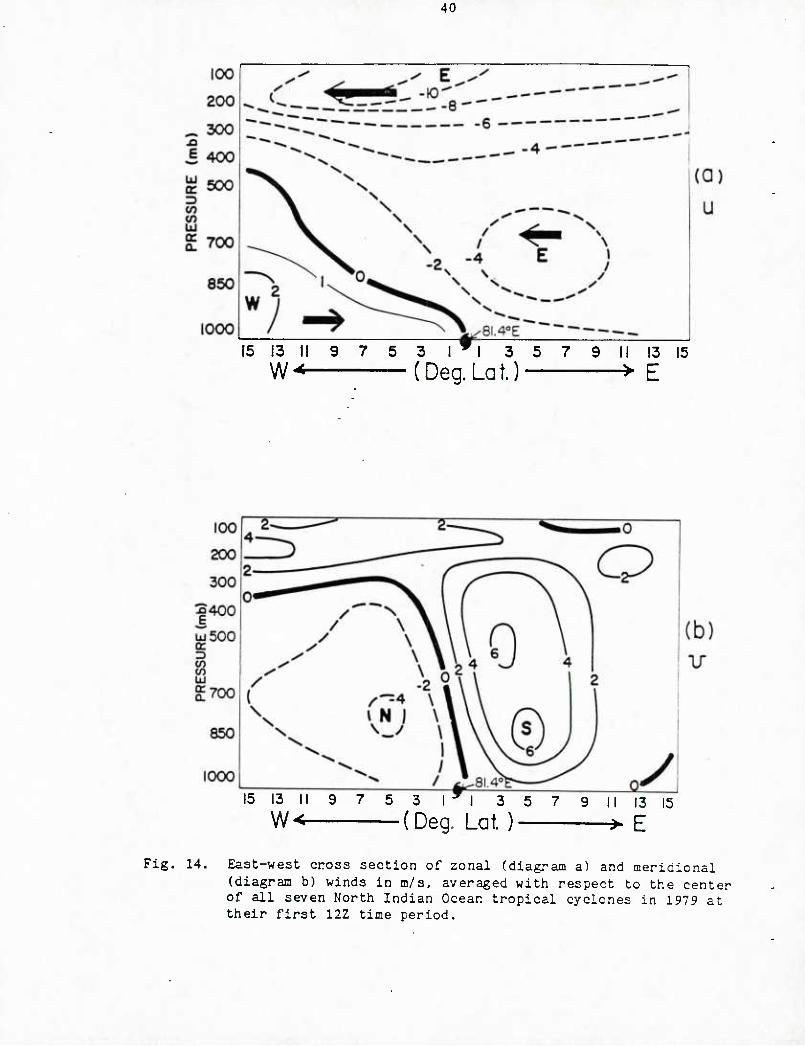
Figures 13 and 14 show the north-south and east-west vertical cross
sections of zonal and meridional winds (U and V), averaged for all seven
1979 systons at their initial center position at their first reported
12Z time period. As expected, a surface to 400 mb deep layer north-
south monsoon trough circulation exits at these initial periods. The
strong upper level westerly flow to the north of the center is just the
prevailing mid-latitude westerlies. Near the equator the winds are, as
expected, strongly easterly at upper levels.
The combination of diagrams 13a and 14b represents the net
rotational or vorticity part of the wind around the initial cyclone
center. It is interesting to find that the vorticity inside 5° radius
and through a deep layer around the initial cyclone is as large as it
is. The most distinguishable feature of the N.I.O. cloud cluster
systems that did not form cyclones was, in general, a lack of such a
strong surrounding deep-layer cyclonic vorticity field. As the tropical
cyclone spins up and gains inner-core strength this outer cyclonic
circulation field undergoes little change, however.
The upper-level anticyclonic circulation is much shallower and much
less defined. Figures 13b and 14a show the divergent part of the wind.
To the south and west of the center this low-level convergence is very
shallow and appears to have originated from the cross-equatorial
monsoonal flow across the equator. Notice that the equatorial monsoon
flow (and rotational part of the wind about the pre-cyclone disturbance)
is present through a very deep layer but the convergence only through a
shallow layer. In the upper level, divergence is found most in the
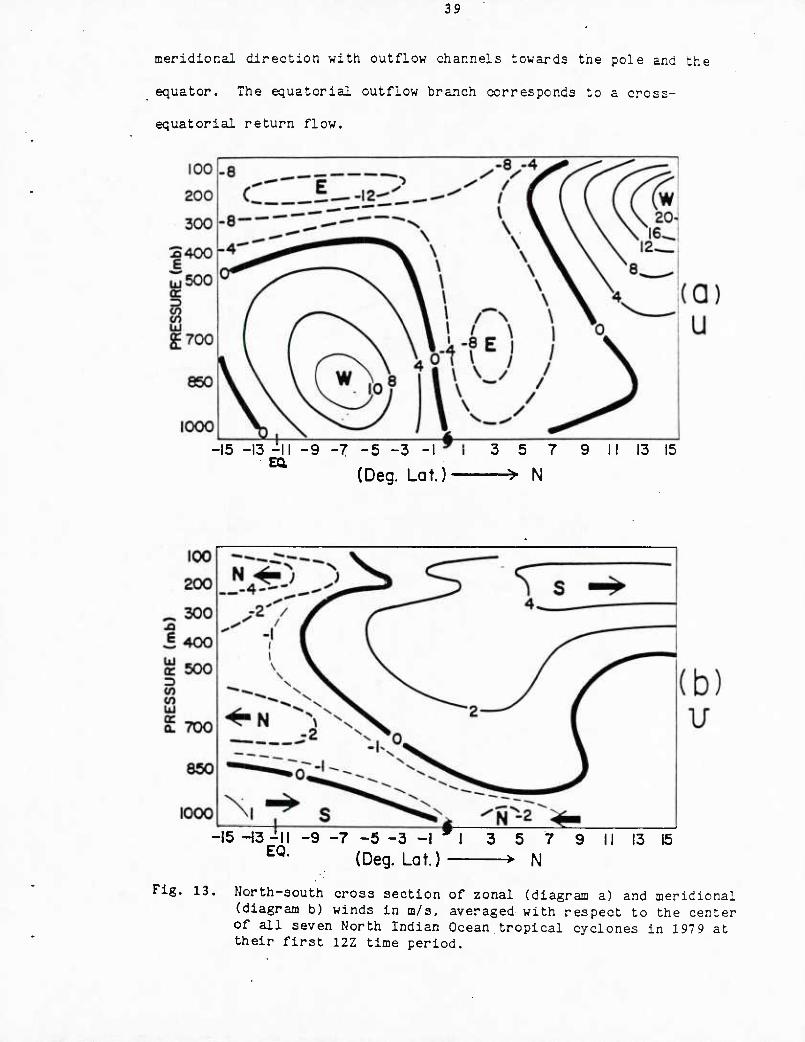
39
meridional direction with outflow channels towards the pole and the
equator. The equatorial outflow branch corresponds to a cross-
equatorial return flow.
-15 -13 -II -9 -7 -5 -3 -I
(Deg. Lot.)
3 5 7 9
-^ N
13 15
-15 H3-II -9 -7-5-3-11 3 5 7 9 ^^' (Deg. Lot.) ► N
II 13 15
Fig. 13. North-south cross section of zonal (diagram a) and meridional (diagram b) winds in m/s, averaged with respect to the center of all seven North Indian Ocean tropical cyclones in 1979 at their first 12Z time period.
40
15 13 II 9 7 5 3 I ^1 3 5 7 9 II 13 15 W-< (Deg.Lat.) > E
15 13 II 9 7 5 3 I -^ I 3 5
(Deg. Lot. )- 11 13 15
^ E
Fig. 14. East-west cross section of zonal (diagram a) and meridional (diagram b) winds in m/s, averaged with respect to the center of all seven North Indian Ocean tropical cyclones in 1979 at their first 122 time period.
41
6. ANALYSIS OF INDIVIDUAL CASES OF NORTH INDIAN OCEAN TROPICAL CYCLONES DURING FGGE
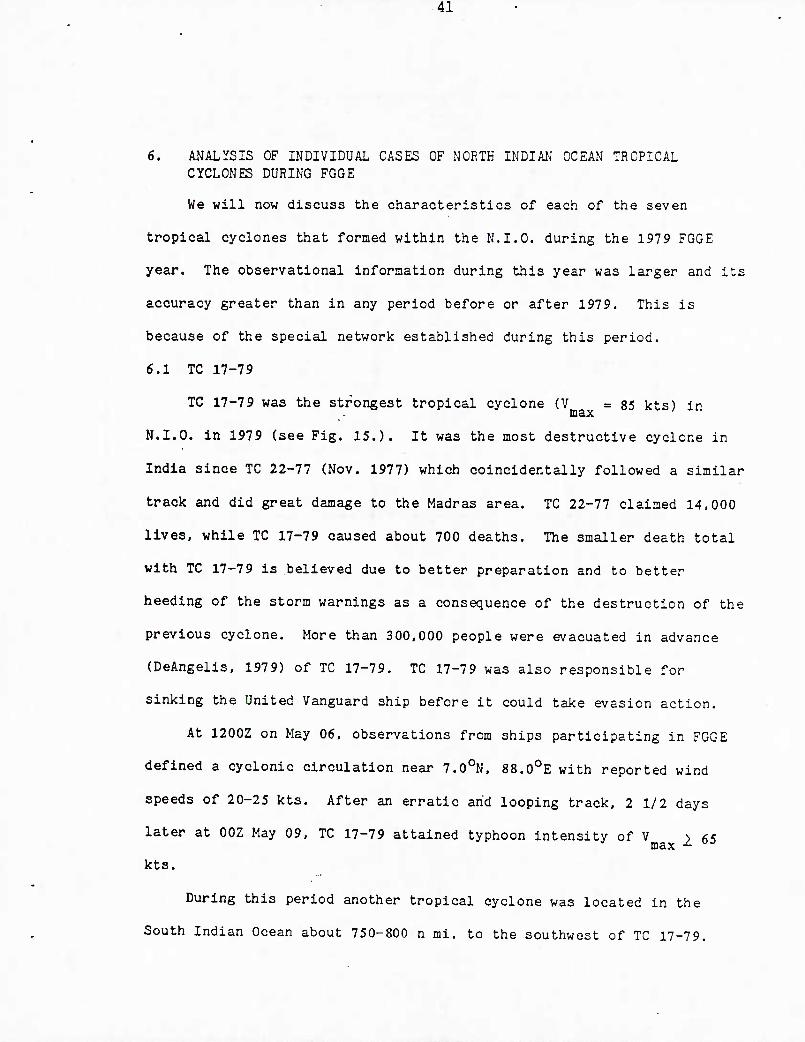
We will now discuss the characteristics of each of the seven
tropical cyclones that formed within the N.I.O. during the 1979 FGGE
year. The observational information during this year was larger and its
accuracy greater than in any period before or after 1979. This is
because of the special network established during this period.
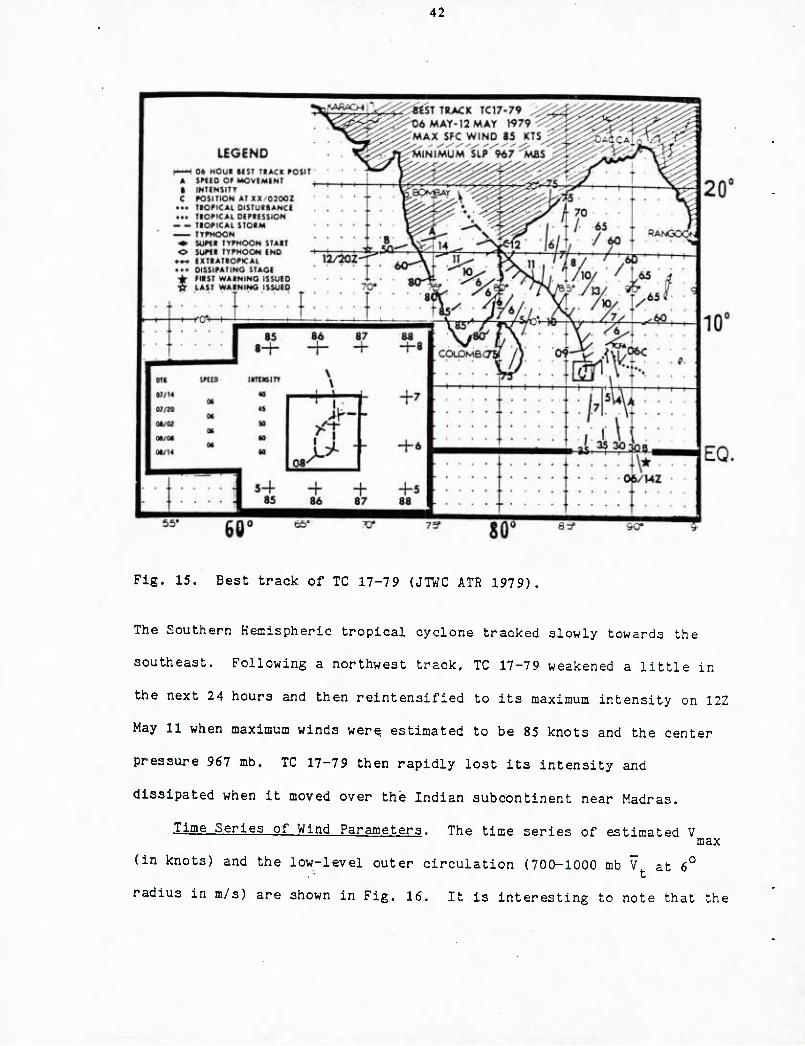
6.1 TC 17-79
TC 17-79 was the strongest tropical cyclone (V = 85 kts) in max
N.I.O. in 1979 (see Fig. 15.). It was the most destructive cyclone in
India since TC 22-77 (Nov. 1977) which coincidentally followed a similar
track and did great damage to the Madras area. TC 22-77 claimed 14,000
lives, while TC 17-79 caused about 700 deaths. The smaller death total
with TC 17-79 is believed due to better preparation and to better
heeding of the storm warnings as a consequence of the destruction of the
previous cyclone. More than 300,000 people were evacuated in advance
(DeAngelis. 1979) of TC 17-79. TC 17-79 was also responsible for
sinking the United Vanguard ship before it could take evasion action.
At 1200Z on May 06, observations from ships participating in FGGE
defined a cyclonic circulation near 7.0°N, 88.0°E with reported wind
speeds of 20-25 kts. After an erratic and looping track, 2 1/2 days
later at OOZ May 09, TC 17-79 attained typhoon intensity of V > fi^ max - ^
kts.
During this period another tropical cyclone was located in the
South Indian Ocean about 750-800 n mi. to the southwest of TC 17-79.
42
Fig. 15. Best track of TC 17-79 (JTWC ATR 1979)
The Southern Hemispheric tropical cyclone tracked slowly towards the
southeast. Following a northwest track. TC 17-79 weakened a little in
the next 24 hours and then reintensified to its maximum intensity on 12Z
May 11 when maximum winds were estimated to be 85 knots and the center
pressure 967 mb. TC 17-79 then rapidly lost its intensity and
dissipated when it moved over the Indian subcontinent near Madras.
Time Series of Wind Parameters. The time series of estimated V max
(in knots) and the low-level outer circulation (700-1000 mb V at 6°
radius in m/s) are shown in Fig. 16. It is interesting to note that the
43
80
-: 60
o
>^40
20
TC 17-79
'-—T.-*A ;
j ::r 7 8 9 10
-*-DATE (May) 12
-^30 < <: E^ E
2 « 0 •^ IT) ^D
.«. ,^_ o o
20 _ 3 E 3
E 8 o o g g CM
1 o O
e - log 4 -^
l>
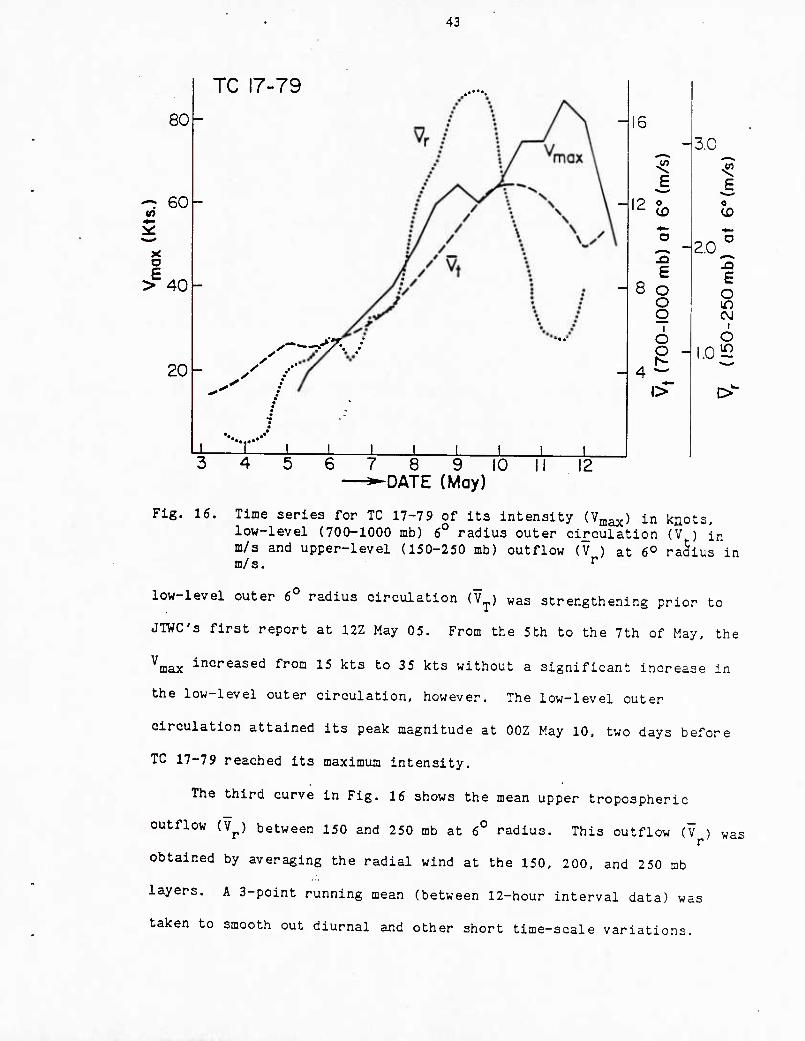
Fig. 16. Time series for TC 17-79 of its intensity (7^3^) in knots. low-level (700-1000 mb) 6° radius outer circulation (V ) in m/s and upper-level (150-250 mb) outflow (V ) at 6° radius in m/ s. ''
low-level outer 6° radius circulation (V^) „as strengthening prior to
JTWC's first report at 12Z May 05. From the 5th to the 7th of May, the
^max incr-eased from 15 kts to 35 kts without a significant increase in
the low-level outer circulation, however. The low-level outer
circulation attained its peak magnitude at OOZ May 10. two days before
TC 17-79 reached its maximum intensity.
The third curve in Fig. 16 shows the mean upper tropospheric
outflow (V^) between 150 and 250 mb at 6° radius. This outflow (V ) was
obtained by averaging the radial wind at the 150, 200, and 250 nb
layers. A 3-point running mean (between 12-hour interval data) was
taken to smooth out diurnal and other short time-scale variations.

44
(This 3-point running mean was applied to all time series with
significant OOZ and 12Z variation.) The upper-level outflow of TC 17-79
increased significantly right before the system was officially reported
by JTWC. Another major increase occurred between 12Z May 07 and 12Z May
08 when the system was undergoing its maximum intensification rate.
There was a noticeable break in the increase of V between OOZ May 09
and OOZ May 10 associated with the decrease of the upper-level outflow.
Early Stage. Between OOZ May 03 and OOZ May 05, the ITCZ (Inter
Tropical Convergence Zone) was located between the equator and 10°N from
60 E to 90 E with loosely organized cloud clusters spread over the
entire region. The only .significant change in the ITCZ strength during
this stage was an increase of the low-level outer circulation of the
pre-TC 17-79 disturbance. Figure 17 shows this low-level tangential
wind out to the 14° radius about the position of 6.4°N, 90.6°E at 12Z
May 03, 12Z May 04, and 12Z May 05. This is the location of TC 17-79 at
12Z May 05. The heavy curves are the 2 m/s tangential isotach.
At 12Z May 03, a maximum V of 12 m/s is located at 4-6° radius
south and southwest from the center. North of the center, tangential
winds are only 2-3 m/s. The 2 m/s isotach does not penetrate through
the west side (V^ is negative here) to form a closed pattern around the
center. By 12Z May 04, however, a closed pattern of 2 m/s isotach is
found around the center, V^ to the north has increased to 5 m/s. The
maximum V^'to the south and southwest of the center is maintained at 12
m/s. Negative V^. is still present at 12° radius to the south and 10° to
the north and east of the center. However, positive V is spread over

45
Pre-TC 17-79 700-1000 mb
Fig. 17. Plan view, of low-level circulation. (700-1000 mb Vj.) of TC 17-79 about 6.40N, 90.6OE or the center of the pre-TC 17-7 9 disturbance at (a) 12Z May 03, (b) 12Z May 04. and (c) 12Z May 05. Values in n/s.

46
most of the region around the cyclone by 12Z May 05. The maximum mean
V around the cyclone increased from 12 to 14 m/s during this period..
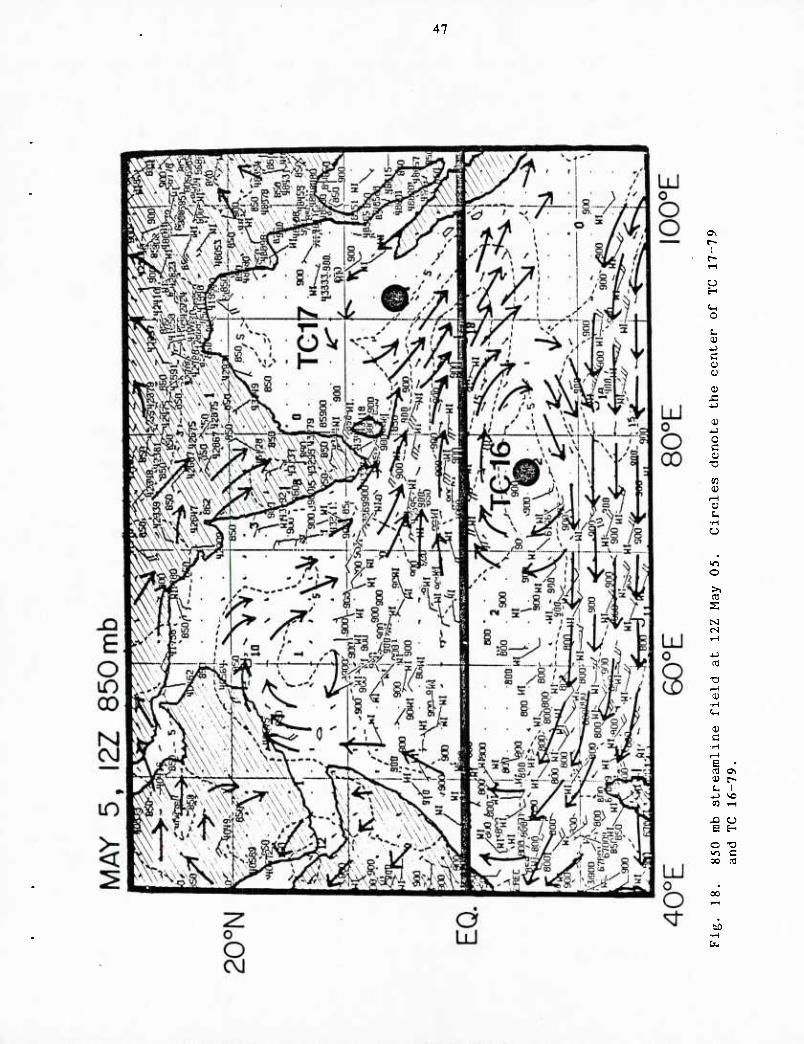
Figure 18 shows the low-level large-scale circulation pattern at
OOZ May 05. A westerly wind maximum is located on the equator between
80°E and 90°E. The pre-TC 17-79 disturbance is located to the northeast
or cyclonic side of this low-level wind maximum region. In the south
Indian Ocean, TC 16-79 is located at around 7°S, 84°E. TC 16-79
attained tropical storm strength on May 04 and intensified to 50 kts and
60 kts on the 5th and 7th respectively (DeAngelis, 1979). The increase
of TC 16-79's intensity appears to have helped produce these strong
westerly winds near the equator. The cross-equatorial flow along the
east Africa coast does hot seem to play a significant role in producing
this strong low-level coupling between TC 17-79 and TC 16-79.
At upper levels, an antlcyclonic center is located around 15°N,
90 E, north of the pre-cyclone cloud cluster region where TC 17-79 will
form. An upper-level trough is located 20° to the west - northwest of
the anticyclone center. The flow is mostly northeasterly and easterly
near the vicinity of the cluster region. No significant change in
upper-level flow occurs during the three-day period of genesis except
for an upper-level trough moving slowly eastward.
Developing Stage. At 12Z May 05, a well organized cloud pattern is
found centered at 6°N, 91°E. Maximum wind at this time is estimated at
20 kts (JTWC ATR, 1979). A significant developmental feature appears to
be the establishment of an upper tropospheric outflow channel to the
north. This can be seen from the increase of the 150-250 mb radial wind
from 12Z May 04 to OOZ May 05 in Fig. 16. The radial circulation
47
u
O
t. 0)
c 0) a
a;
0)
o c
CO
o •1-1
o
o
4.) ca
i-H 0) •H
c
4_) vo
e H o -o 00 <a
•rH

48
increases slightly in the next 48 hours with the caximum wind going froc
20 to 40 kts at 12Z May 07. .
Radial-height cross sections of azimuthally averaged tangential
wind (V^) at 12Z May 05. 12Z May 07, and 12Z May 09 are shown in
diagrams a, b and c of Fig. 19. Cyclonic circulation extends up to
300-400 mb with maximum anticyclonic wind near 175 mb. This circulation
pattern is very similar to those of developing tropical cyclone wind
patterns in the northwest Pacific as discussed by McBride, 1981. Note
how the outer cyclonic tangential circulation from the surface to 400 mb
shows a steady increase while the upper-level anticyclone circulation
shows little change until the maximum intensity is reached. Diagram a
of Fig. 20 depicts the difference in the tangential wind between 12Z May
07 and 12Z May 05. The tangential wind increases over the whole depth
of the troposphere between these two time periods.
A stronger intensification rate is noted between 12Z May 07 and OOZ
May 09. The circulation pattern at 12Z May 09 is shown in diagram c of
Fig. 19 and the tangential wind change from 12Z May 07 to 12Z May 09 is
shown in diagram b of Fig. 20. A comparison with diagram a of Fig. 17
shows that the tangential wind increase is mostly at larger radii from
12Z May 05 to 12Z May ■07. but at smaller radii from 12Z May 07 to 12Z
May 09. In other words, the cyclonic circulation increases at all
levels as the cyclone is in its early developmental phase from 20 to 40
knots but then has an increased inner tangential wind concentration in
the later developmental stages from 40 to 60 knots maximum winds. The
level of maximum tangential wind increase also shifts to a lower level
in the later developing stages.

49
I
2
3
— 6 a
7
8
9
10
I
2
3
-- 6 0.
7
.8
9f
10-
(a) 05I2Z
» 12 14
(b) 0712Z
(c) 09I2Z
6 6 10 12
Radius ( deg. lot.)
14
Fig. 19, Radius-height vertical cross sections of azimuthally averaged tangential wind (in m/s) for TC 17-79 at (a) 12Z May 05, .^^^ (b) 12Z May 07, V^ax = 40 kts. and (c) 122 May 09, Vmax = 60 kts
= 20 kts

50
(Q)
6 8 10
Radius ( deg. lot.)
14
(b)
Radius ( deg. lot.)
Fig. 20. Radial-height cross-section of 2-day tangential wind increases for TC 17-79 in m/s: (a) 12Z May 05 to 122 May 07; (b) 07 12Z to 09 12Z. Plus sign means an increase in cyclonic circulation or a decrease in anticyclonic circulation.

51
During this time period, the 200 mb upper-level trough coves closer
to the longitude of the cyclone center (Fig. 21). An upper-level
outflow channel is established to the north of the cyclone center.
Figure 22 shows the plan view of the 150-250 mb radial winds in a moving
coordinate relative to the center of TC 17-79 at 12Z May 07. A major
outflow channel is found to the north of the center. A broader outflow
region is also located to the southeast of the cyclone center.■ The
looping track of TC 17-79 starts around this time period. This looping
is likely due to changes of the steering flow current resulting from
fluctuations in the north vs. south strength of the surrounding monsoon
trough as has been discussed by Xu and Gray, 1982.
Although the upper-level outflow started to weaken after 12Z May 09
the Vjjj^^ still continued to show a general increase from 12Z May 09 to
12Z May 11. This appears to be related to the passage of the upper-
level trough system. Convection gradually concentrated at inner radii
especially on the east and southeast sides of the center. Figure 23
shows the satellite portrayal of this cyclone at 12Z May 09 and 12Z May
11. An upper tropospheric outflow has been established to the west and
southwest of the center. Figure 24 shows the upper-level large-scale
circulation pattern at OOZ May 10 and OOZ May 11. The upper-level
radial wind (in the moving coordinate system relative to the cyclone
center) is shown in Fig. 25. A pronounced outflow channel is located to
the west of the cyclone center.
Decaying Stap;e. TC 17-79 makes its landfall at 06Z May 12 and
maintains its intensity of 80 kts for another 6 hours or so. Its
circulation patterns are well-maintained until 12Z May 12. It then
rapidly dissipates as it moves inland.

52
MAY 07, OOZ 200 mb
20* N
MAY 08, OOZ 200mb
20*N
Fig. 21.
O^E
ECMWF analyzed 200 mb wind field associated with TC 17-7 9 for (a) OOZ May 07. and (b) OOZ May 08. The large solid circle denotes the center of TC 17-79. Length of arrows is proportional to wind speed.
53
A
#-H—I 0 4 8
Deg. Radius
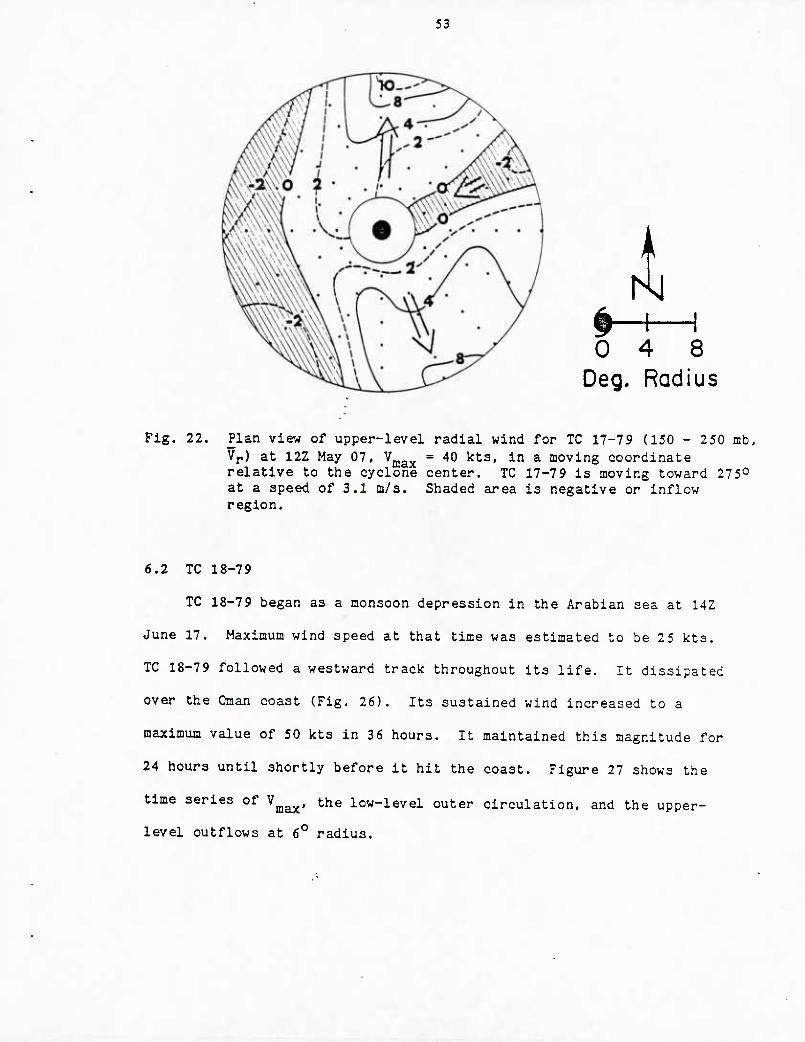
Fig. 22. Plan view of upper-level radial wind for TC 17-79 (150 - 250 mb, Vj,) at 12Z May 07, Vj^^^ = 40 kts, in a moving coordinate relative to the cyclone center. TC 17-79 is moving toward 275° at a speed of 3.1 m/s. Shaded area is negative or inflow region.
6.2 TC 18-79
TC 18-79 began as a monsoon depression in the Arabian sea at 14Z
June 17. Maximum wind speed at that time was estimated to be 2 5 kts.
TC 18-79 followed a westward track throughout its life. It dissipated
over the Oman coast (Fig. 26). Its sustained wind increased to a
maximum value of 50 kts in 36 hours. It maintained this magnitude for
24 hours until shortly before it hit the coast. Figure 27 shows the
time series of V^^, the low-level outer circulation, and the upper-
level outflows at 6° radius.

54
Fig. 23. Satellite picture of TC 17-79. center is circled, at 12Z on (a) May 09, (b) May 11.

55
MAY lOj OOZ 200mb
20°N
r (0)
SO^'E 80°E IIO^'E
MAY II, OOZ 200mb
20* N
20*'S
50*'E
Fig. 24. 200 mb flow' field relative to TC 17-79 (circled) for OOZ May 10 (diagram a) and OOZ May 11 (diagram b). Length of arrows is proportional to wind speed.

56
#-H 1 0 4 8
Deg. Radius
Fig. 25. Plan view of upper level radial wind (150 - 250 mb average V^) for TC 17-79 at 12Z May 11. (V^^ = 85 kta) in a moving coordinate system. The storm is moving toward 295° at 3,4 m/s).
Fig. 26. Best Track of TC 18-79. (From JTWC ATR, 1979.)
57
X o E
bU ■^TC
•
18-79
60 — Vt •—^-s
/ s^ / A .-X / / • r^
40 — ; / X \ ~ / / / \ \ ; / / **• \ ,• • / *, \ r ^r • \
/I ' "max •• \ 20
- ..••■ / /
r
/ • • • •- ^x V
\
1 1 1 1 1 1
n3.0
- 8
CO
E o CD
E O o g
I o
4^
l>
S 0 CD
2.0
£ O in
I
0 o •^ lO
l>^
16 17 18 19 ■DATE (June)
20
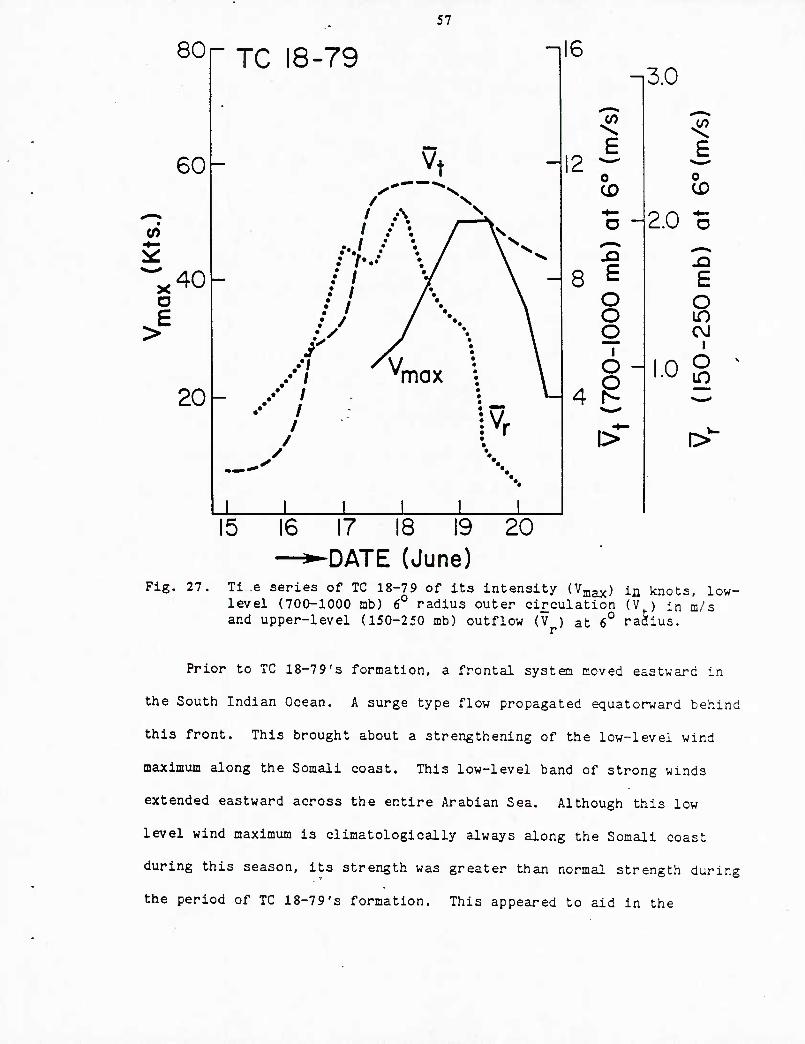
Fig. 27. Ti .e series of TC 18-79 of its intensity (Vmax) in knots, low- level (700-1000 mb) 6° radius outer circulation (V ) in m/s and upper-level (150-250 mb) outflow (V ) at 6° radius.
Prior to TC 18-79's formation, a frontal system moved eastward in
the South Indian Ocean. A surge type flow propagated equatorward behind
this front. This brought about a strengthening of the low-level wind
maximum along the Somali coast. This low-level band of strong winds
extended eastward across the entire Arabian Sea. Although this low
level wind maximum is climatologically always along the Somali coast
during this season, its strength was greater than normal strength during
the period of TC 18-79's formation. This appeared to aid in the

58 _
formation of TC 18-79 by increasing the westerly winds on the southern
side of the pre-cyclone disturbance and generally enhancing its low-
level circulation.
This strengthening of the low-level jet can be seen from the plan
view of the low level (700-1000 mb) tangential wind field around the
center of TC 18-79 at 12Z June 17 when the center was located at 17°N,
68°E. Figure 28 shows these plan views at 12Z June 15, 12Z June 16, and
12Z June 17. At 12Z June 15 (48 hours before the beginning of TC 18-
79), a low-level wind speed maximum of 16-17 m/s was located 10° south
of the pre-cyclone center. Cyclonic circulation is found only on the
south side of the center. This is part of the prevailing southwesterly
flow from the low-level' Somalia jet. The pre-cyclone disturbance center
is located just on the poleward (or cyclonic shearing side) of this
low-level wind speed maximum. To the north side of the pre-cyclone
center only a weak anticyclonic circulation is present.
By 12Z June 16, 24 hours later, the maximum wind to the south
increases slightly. The most distinctive new alteration of the low-
level flow is the spreading of the cyclonic circulation to the east and
north sides of the developing system. Note how the 2 m/s isotach has
now formed a closed pattern around the center. The low-level
anticyclonic region has greatly decreased. The maximum wind increased
to 23 m/s by 12Z June 17 and moved closer to the system center. The
cyclonic wind spreads over almost the whole region. This gradual
building-up of the low-level circulation is similar to that of TC 17-7 9.

59
TC 18-79 700-1000 mb
V t
A #-H 1 0 4 8
Deg. Radius
Fig. 28. Plan view of low-level circulation (700-1000 mb Vt) in m/s relative to the center of TC 18-7 at 12Z June 15 (diagram a) 12Z June 16 (diagram b) and 122 June 17 (diagram c).

; 60 ■ ., • ,
The gradual strengthening of the average low-level 6° radius
cyclonic circulation around the entire cyclone system in the early
stages can also be observed in Fig. 27. At 12Z June 15, the azinuthal
average of tangential wind at 6° radius was only 1.7 m/s. However, by
12Z June 17 (two days later), the wind speed at this same radius has
increased to 10.7 m/s. Compared to that of TC 17-79, this magnitude is
much greater (at the formation stage) even though TC 18-79 never reached
the same intensity level that TC 17-79 did. The cyclonic circulation of
TC 18-79 was not only strong, but it also extended over a very broad
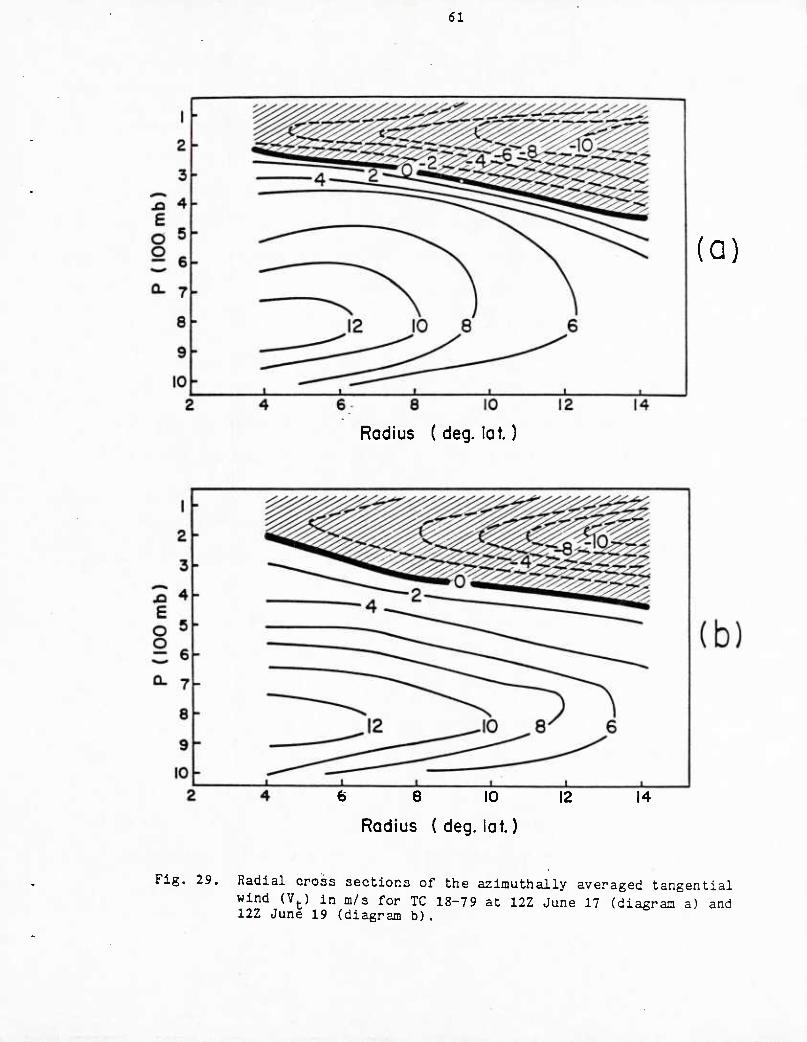
region. Diagrams a and b of Fig, 29 show vertical cross sections of
azimuthally averaged V. at 12Z June 17 and 12Z June 19 when V are t . max
estimated to be 25 kts "and 50 kts, respectively. Again, the cyclone
circulation patterns are quite similar to those found in northwest
Pacific tropical cyclones. However, the outer and environmental
circulation of TC 18-79 is much stronger at this early stage, compared
to the average of the other cases. A lower tropospheric azimuthally
averaged wind speed of 7-8 m/s at 10° radius as is present at 12Z June
17 is quite large. It is interesting to note that the upper- and
lower-level circulation beyond 4° radius does not change much during
this 48-hour period, but the maximum inner core cyclone intensity
doubles its magnitude during this time interval.
It should be noted that the 6° radial outflow increases greatly
prior to the beginning of TC 18-79's formation but does not increase
during the period when the maximum winds increase the most between 12Z
June 17 and OOZ June 19, However, the 200 mb outflow concentrates in
channels to the west and southwest of the center as shown in Fig, 30
61
6 8 10
Radius ( deg. lot.)
(a)
6 6 10 12
Radius { deg. lot.)
14
Fig. 29. Radial cross sections of the azimuthally averaged tangential wind (V^) in m/s for TC 18-79 at 12Z June 17 (diagram a) and 12Z June 19 (diagram b).

62
for the period of OOZ June 17 and OOZ June 18. An examination of the
upper-level circulation pattern shows that the center of TC 18-79 is
located south of an upper-level anticyclone center. This results in a
strong prevailing easterly wind over the vicinity of TC 18-79. This
prevailing easterly wind and westward stretching of the Southern
Hemisphere anticyclone have eliminated the outflow to the east and
enhanced the outflow channel to the west and southwest. Figure 31 shows
the plan view of the upper-level radial wind at 12Z June 17 in which a
major outflow channel can be seen toward the southwest. It is this
outflow channel that might have caused the intensification of TC 18-79.
Documentation of outflow channel increase and cyclone intensification
has been previously discussed by Chen and Gray (1984). A physical
hypothesis for this process has been advanced by Holland and Merrill
(1984) of our project.
Although TC 18-79 was still increasing in inner-core intensity from
OOZ June 18 to OOZ June 19, the upper-level outflow began to weaken at
this time (a feature similar to that of TC 17-79). This was due (we
believe) to the increase of the upper-level inflow on the eastern side
produced by the strong westward directed flow at this level. Besides
causing outflow decreases, this strong upper-level easterly flow appears
also to have acted to bring about a shearing off of convection. This
brought about a rapid weakening of TC 18-79 before it reached the Oman
coast. Figure 32 shows the satellite IR picture of TC 18-79 at 18Z June
19, when TC 18-79 starts to weaken. The clear region and sharp edge of
the cloud pattern on the east side indicate an inflow to the storm
system from the easti Another reason for TC 18-79's rapid weakening is

63
JUNE 17, OOZ 200mb
20T^
(a)
20°S
JUNE 18, OOZ 200mb
20°N
(b)
20*'S
50*'E 80*'E IIO'E
Fig. 30. 200 mb flow' field for TC 18-79 at OOZ June 17 (diagram a) and OOZ June 18 (diagram b). The large dot shows the center of TC 18-79. The length of the arrows is proportional to wind speed.

04
N #-H 1 0 4 8
Deg. Radius
Fig. 31. Plan view of upper-level radial wind (150-250 mb Vj,) for TC 18-7 9 at 12Z, June 17, in a moving coordinate (277° and 4.0 m/s).
EQ.
Fig. 32. Satellite, pictures of TC 18-79 at 18Z, June 19. Center is circled.

65
its moving close to the dry Arabian Peninsula. Similar weakening of
tropical cyclones can occur off the northwest Australian Coast if dry
desert air should be advected into the storm system.
Although TC 18-79 weakens rapidly after 18Z June 19, both the low-
level and upper-level outer circulation patterns are well maintained
until 12Z June 20 (V^^ = 20 kts) as seen in diagram a of Fig. 33.
Despite the zero line of this figure moving to a lower altitude, the
low-level cyclonic circulation still has a magnitude of 5-7 m/s at 10°
radius. Diagram b of Fig. 33 indicates that a closed cyclonic
circulation is still present over a broad region at this time even
though the inner maximum wind strength has greatly decreased. Maximum
winds have also shifted-to the south and southeast of the center. This
is due to a westward movement of TC 18-79 away from the strong low-level
ITCZ westerly flow which held its position at the same location.
DeAngelis (1980o) has speculated that TC 18-79 helped bring about the
advance of the southwest monsoon over the western portions of the Indian
subcontinent. Krishnamurti, et al. (1981) have presented evidence that
a low-level tropical cyclone vortex often forms in the Arabian Sea just
prior to the advancement of the summer monsoon over India in June.
6,3 TC 23-79
TC 23-79 was first reported as a monsoon depression at 02Z Sept.
18. Prior to this time, JTWC had traced the pre-TC 23-79 tropical
disturbance for more than two days. It tracked westward across the
southern end of the Indian subcontinent (Fig. 34) and into the Arabian
Sea. Loosely organized convection was associated with this disturbance.
The upper-level prevailing wind was from the east. The plan view of the

66
Radius (deg. lot.)
A (b)
■{—I
0 4 8 Deg. Radius
Fig. 33, The cross section of average tangential wind (V ) of : 12Z June 2Q (diagram a) and the plan view low-level l(
TC 18-79 at .000 to
700 mb average tangential wind (V ) at 12Z June 20 (diagram b). Wind speeds in m/s.

67
b Xl .
^-M,
3\ t- 0\ 1-i aa
D D a; m '^ ^
< ~ "" £-H < i-oo
5'^12 u
2 = 55 s r <5S ■-5
x:i9S < ^ r-
i\^ 1
ts
u 3^ H ^
T3 C 0]
o\ r-
S 1 m
- <s
u H
Ci_ O
"1 -" ^
o !T3 L. *J
4-1 K «
0)
' m
TT rr,
^ ba ■H [j-

68 ■ ■
upper-level radial wind at 12Z September 17 showed an inflow on the
eastern side and an outflow to the western side of the center (diagram a
of Fig. 35) or a westward blow-through at upper levels. This outflow
shifted with time (diagram b - September 18th) and, on the 20th (diagram
c), there is a double outflow to the southwest and the northeast.
Double outflows are, in general, more conducive to cyclone
intensification. ' •
The time series of the V the low-level outer circulation, and
the upper-level outflow are shown in Fig. 3 6. Like those of TC 17-7 9
and TC 18-79, the low-level outer circulation increases (from 3.2 m/s to
6.4 m/s) prior to the formation of TC 23-79. Diagrams a and b of Fig.
37 show the plan view of the low-level circulation at 12Z Septanber 16,
12Z Septenber 17, and OOZ September 18 in a moving coordinate relative
to TC 23-79's center. As with the two previously discussed cyclone
systems, the initial cyclonic circulation is concentrated in the
southern part of the region; while in the northern part, the flow is
hardly cyclonic at all. The maximum tangential wind is located 8-10°
south of the center with a magnitude of 16-17 m/s. On the synoptic
chart, the pre-TC 23-79 disturbance is located north-northeast to a
low-level westerly wind maximum which is likely driven by the cross-
equatorial monsoonal flow from the east coast of Africa.
Note how the flow on the north side of the TC 23-7 9 system becomes
more cyclonic and extends out to 6-8° radius. This results in an
increase of the low-level outer circulation despite the decrease of the
maximum cyclonic circulation to the south. At OOZ September 18. the
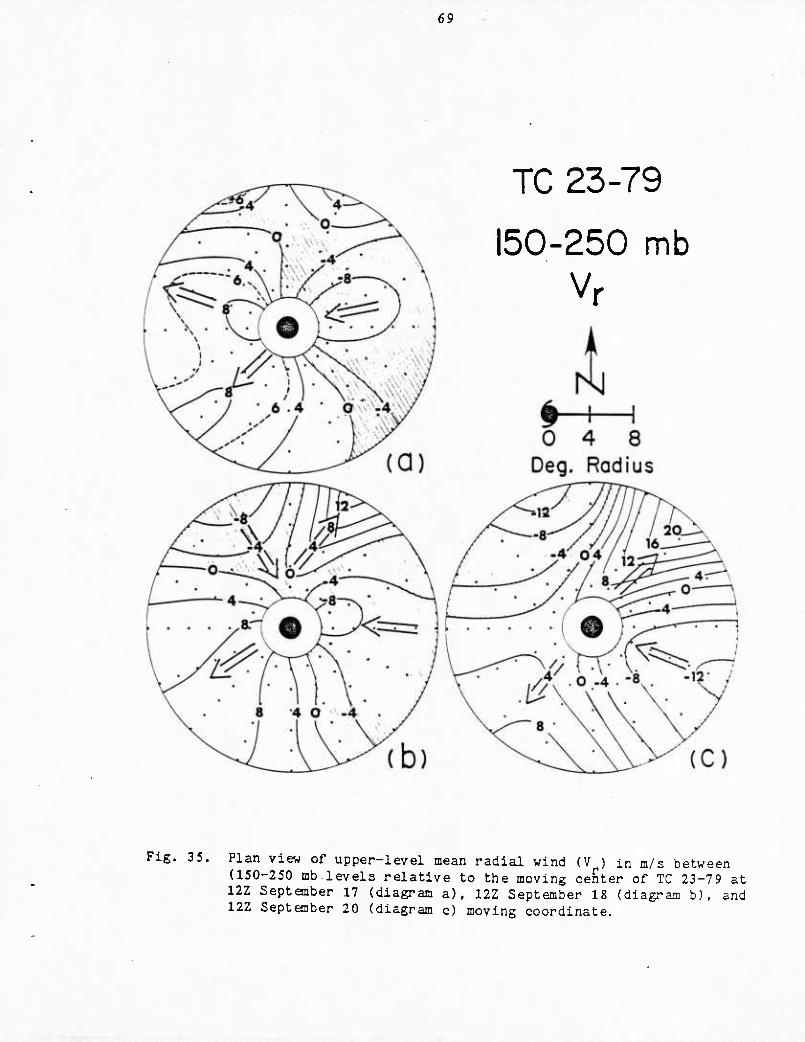
69
TC 23-79
150-250 mb Vr
Fig. 35. Plan view of upper-level mean radial wind (V ) in m/s between (150-250 mb.levels relative to the moving center of TC 23-79 at 12Z Septonber 17 (diagram a), 12Z September 18 (diagram b), and 12Z September 20 (diagram c) moving coordinate.

70
80
60
X O
40
20
TC 23-79
max
16 17 18 19 20 21 22 23 24 25 —*-DATE (Sept.)
o
8 £ o o o
1.5 £ 0 CD
1.0 o
0.5 2 e o in CVJ
OO o in
-0.5l>'"
Fig. 3 6. Time series of cyclone intensity (Vmax) and low-level outer circulation (V.) and upper-level outflow (V ) at 6° radius for TC 23-79. ^
maximum cyclonic circulation increases to 16 m/s and moves in closer to
the center. The cyclonic circulation to the north and northeast of the
center also shows a gradual increase of the circulation about TC 23-79.
Unlike TC 17-79 and TC 18-79. the development of TC 23-79 is rather
slow after the initial organizing of the systoa on OOZ Septonber 18.
Intensity increases only from 15 kts to 25 kts in three days. The low
level outer circulation increases only slightly from the 18th to the
20th and then decreases. The most peculiar feature in the time series
is the early peaking of the 6° radius upper-level outflow at OOZ
September 17 and then the decrease of the outflow between OOZ September
17 and OOZ Septanber 18. A much greater decrease occurs between
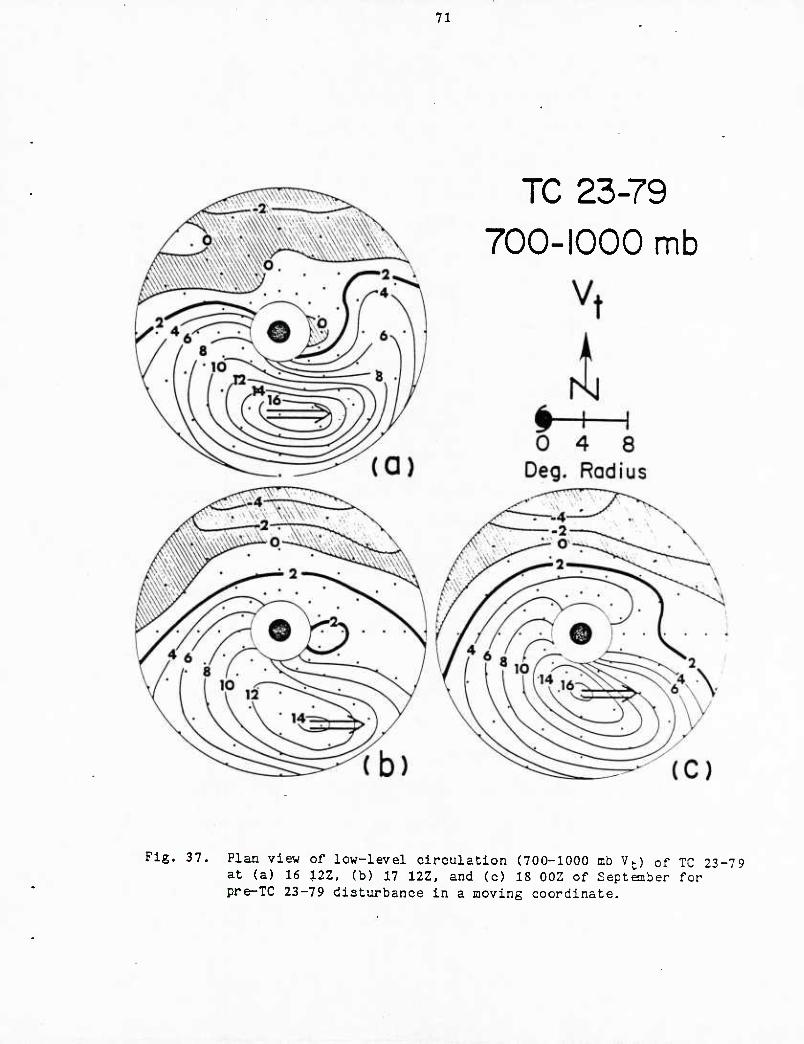
71
TC 23-79 700-1000 mb
Fig. 37. Plan view of low-level circulation (700-1000 mb V^) of TC 23-79 at (a) 16 12Z, (b) 17 122, and (c) 18 OOZ of September for pre-TC 23-79 disturbance in a moving coordinate.
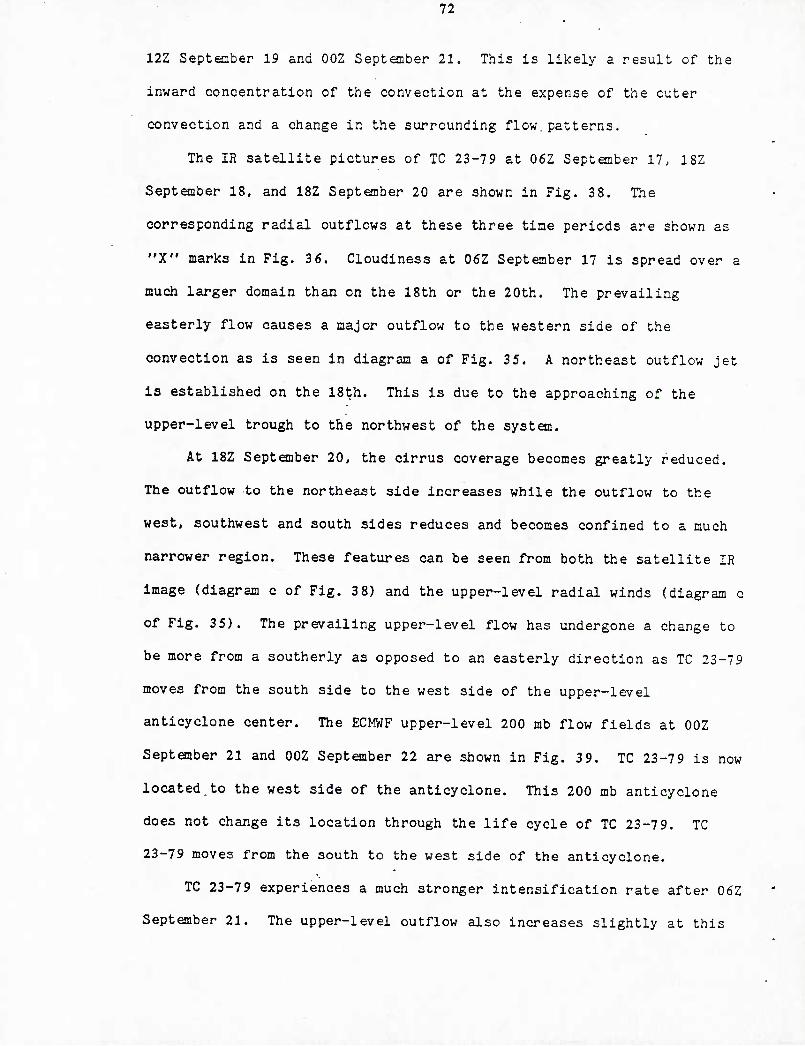
It
12Z September 19 and OOZ September 21. This is likely a result of the
inward concentration of the convection at the expense of the outer
convection and a change in the surrounding flow.patterns.
The IR satellite pictures of TC 23-79 at 06Z Septenber 17, 18Z
September 18, and 18Z Septenber 20 are shown in Fig. 38. The
corresponding radial outflows at these three time periods are shown as
"X" marks in Fig. 36. Cloudiness at 06Z September 17 is spread over a
much larger domain than on the 18th or the 20th. The prevailing
easterly flow causes a major outflow to the western side of the
convection as is seen in diagram a of Fig. 35. A northeast outflow jet
is established on the 18th. This is due to the approaching of the
upper-level trough to the northwest of the system.
At 18Z September 20, the cirrus coverage becomes greatly reduced.
The outflow to the northeast side increases while the outflow to the
west, southwest and south sides reduces and becomes confined to a much
narrower region. These features can be seen from both the satellite IR
image (diagram c of Fig. 38) and the upper-level radial winds (diagram c
of Fig. 35). The prevailing upper-level flow has undergone a change to
be more from a southerly as opposed to an easterly direction as TC 23-79
moves from the south side to the west side of the upper-level
anticyclone center. The ECMWF upper-level 200 mb flow fields at OOZ
September 21 and OOZ Septenber 22 are shown in Fig. 39. TC 23-79 is now
located.to the west side of the anticyclone. This 200 mb anticyclone
does not change its location through the life cycle of TC 23-79. TC
23-79 moves from the south to the west side of the anticyclone.
TC 23-79 experiences a much stronger intensification rate after 06Z
September 21. The upper-level outflow also increases slightly at this

73
(Q)
(b) ((Figure 38'— caption on following page))

74
(C) Fig. 38. Satellite picture of TC 23-79, center is circled, at 06Z Septonber
17 (diagram a), at 18Z September 18 (diagram b), and at 18Z September 20 (diagram c).
time but decreases greatly after OOZ September 22. This outflow was
much stronger 2-3 days before this major intensification period,
however. This stronger intensification rate on the 22nd and 23rd is
believed due to the approach of the upper-level trough from the
northwest. This creates a poleward outflow jet as seen in diagram c of
Fig. 35. The upper-level circulation patterns at OOZ September 21 and
OOZ September 22 (Fig. 39) show this interaction between upper-level
trough and the cyclone. As discussed by Chen and Gray (1984) and Sadler
(1976), such an increase in outflow jets is usually favorable for
tropical cyclone intensification.

75
SEPT 21, OOZ 200mh 40"N
20^N >~i^
20°E SO^'E 80°E
SEPT 22, OOZ 200 mb
20° N
20'»S 50*'E 80" E
Fig. 39. 200 mb flow' field at OOZ of (a) September 21 and (b) September 22. Circle is the center of TC 23-79. Length of arrows is proportional to wind speed.
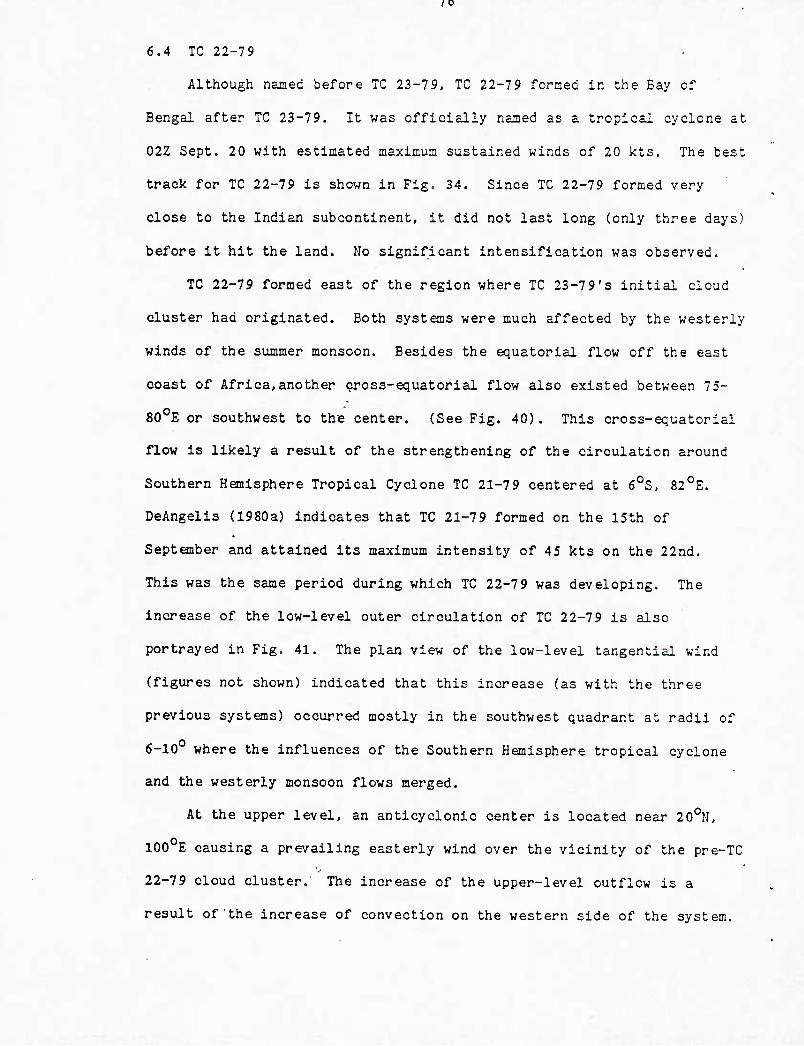
'0
6.4 TC 22-79 .
Although named before TC 23-79, TC 22-79 formed in the Bay of
Bengal after TC 23-79. It was officially named as a tropical cyclone at
02Z Sept. 20 with estimated maximum sustained winds of 20 kts. The best
track for TC 22-79 is shown in Fig. 34. Since TC 22-79 formed very
close to the Indian subcontinent, it did not last long (only three days)
before it hit the land. No significant intensification was observed.
TC 22-79 formed east of the region where TC 23-79's initial cloud
cluster had originated. Both systons were much affected by the westerly
winds of the summer monsoon. Besides the equatorial flow off the east
coast of Africa,another cross-equatorial flow also existed between 75-
80°E or southwest to the center. (See Fig. 40). This cross-equatorial
flow is likely a result of the strengthening of the circulation around
Southern Hemisphere Tropical Cyclone TC 21-79 centered at 6°S. 82°E.
DeAngelis (1980a) indicates that TC 21-79 formed on the 15th of
Septenber and attained its maximum intensity of 45 kts on the 22nd.
This was the same period during which TC 22-79 was developing. The
increase of the low-level outer circulation of TC 22-79 is also
portrayed in Fig. 41. The plan view of the low-level tangential wind
(figures not shown) indicated that this increase (as with the three
previous systems) occurred mostly in the southwest quadrant at radii of
6-10° where the influences of the Southern Hemisphere tropical cyclone
and the westerly monsoon flows merged.
At the upper level, an anticyclonic center is located near 20°N,
100 E causing a prevailing easterly wind over the vicinity of the pre-TC
22-79 cloud cluster. The increase of the upper-level outflow is a
result of the increase of convection on the western side of the system.
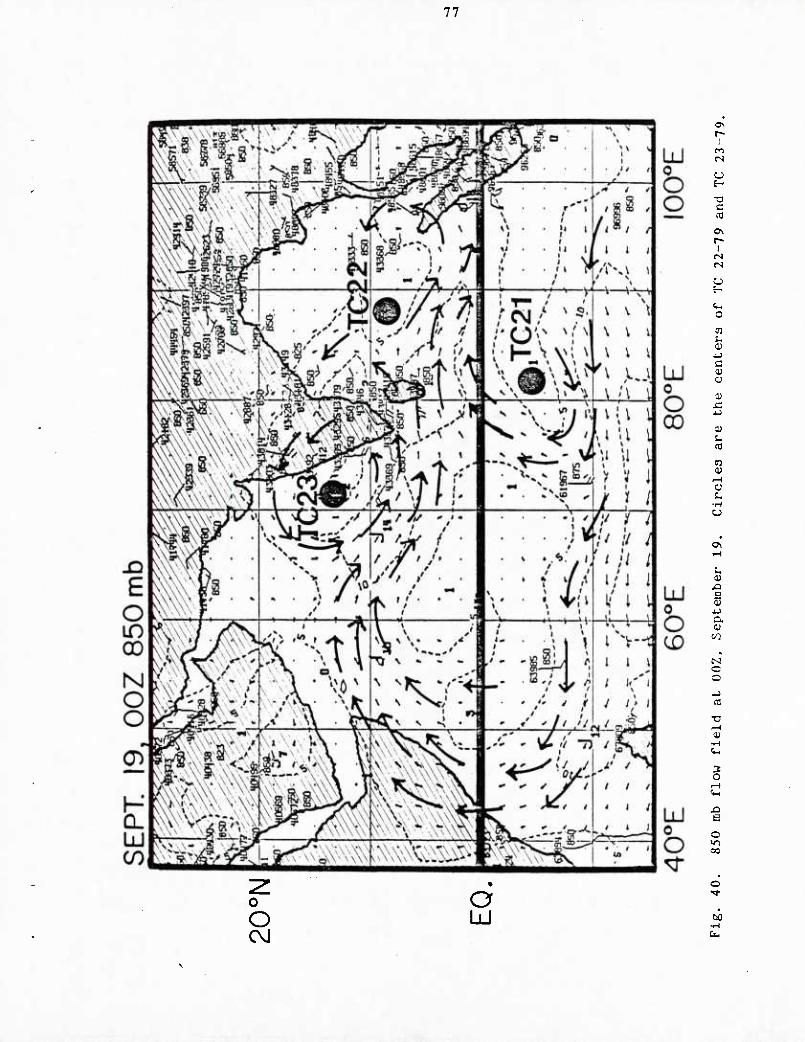
77
O
O C\J
o UJ
ON r->
I m ts CJ i->
XJ c
I
ts
O
n 0)
c <u o i)
D
a CQ
CJ I.
9\
a. 0)
C o 4.) 03
CM
3 O
J3 a o CO
O
bO •H

78
2.0 ^
0 CD
J3 E
CM I
O in
18 19 20 21 22 23 —^ DATE (Sept.) .
Fig. 41. Time series of cyclone intensity (V^ax) and low-level outer circulation (V ) and upper-level outflow (V ) at 6 radius for TC 22-79. ^
Figure 42 shows the satellite picture at 18Z Septenber 19 (this time
marked by an X in Fig. 41), which indicates that the deep Cb convection
and outflow is located mainly at the western side of the systoa. The
plan view of the upper-level radial wind (not shown) also indicates an
increase of outflow in this region. This further demonstrates that
upper-level divergence which is associated with Cb convection around a
tropical cyclone does not necessarily result in a significant
intensification of the system. Our project's research in recent years
has clearly shown (Arnold. 1977) that the amount of deep convection in a
tropical s-ystem is not well related to the intensity or the intensity
change of that system. It is the concentrated nature of the outflow
into narrow channels that is the important ingredient of

79
Fig. 42. Satellite picture of TC 22-79 at 18Z, September 19. Centers of TC 22-79 and TC 23-79 are circled.
intensification. This is not to say that the amount of deep convection
is not better related to the strength of the cyclone as defined in
section 4.
On the 22nd of September, the upper-level trough, which caused a
major intensification of TC 23-79, moves eastward to the north of TC
22-79. However, no intensification is observed with TC 22-79 during
this time period. One possible reason for this lack of TC 22-79's
intensification is its close proximity to land at this time. Another
reason, which is likely more important, is that the trough was too far
away from the cyclone center. As can be seen from Fig. 43, the outflow
associated with the trough to the north of TC 22-79 is not very strong
and does not penetrate close to the storm center. This is more evident
when a comparison is made with Fig. 35(c) which shows the upper-level
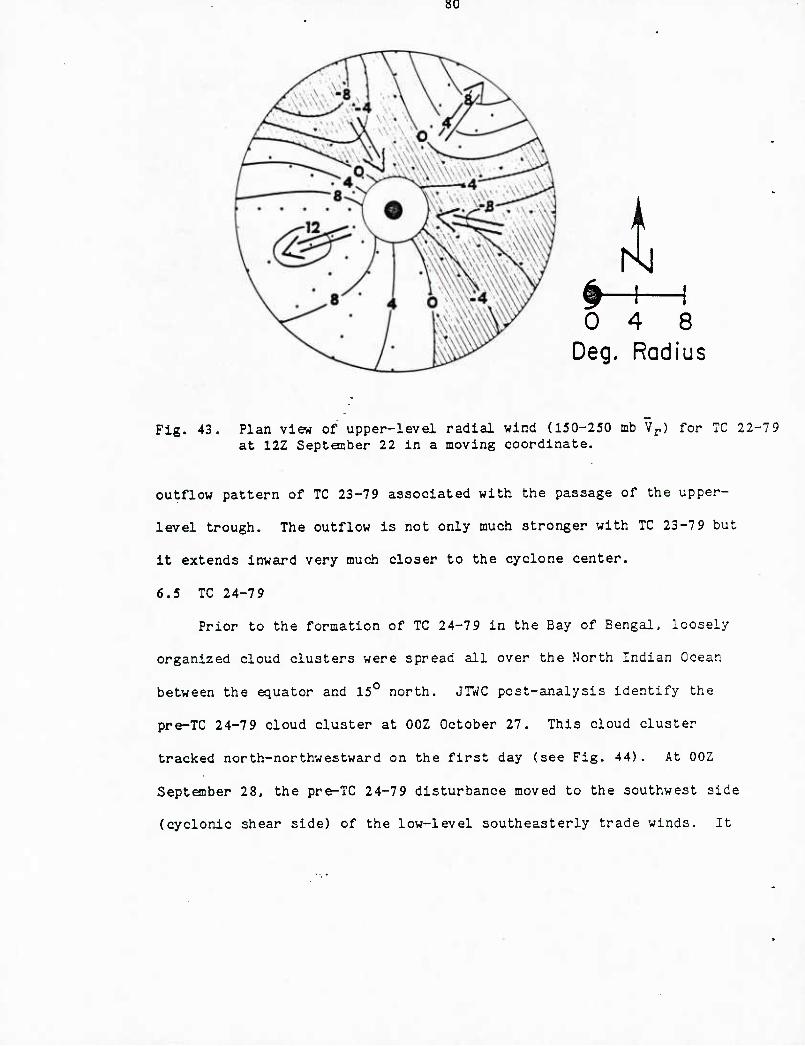
80
H 1 0 4 8
Deg. Radius
Fig. 43. Plan view of upper-level radial wind (150-250 mb V^,) for TC 22-7 9 at 12Z September 22 in a moving coordinate.
outflow pattern of TC 23-79 associated with the passage of the upper-
level trough. The outflow is not only much stronger with TC 23-7 9 but
it extends inward very much closer to the cyclone center.
6.5 TC 24-79
Prior to the formation of TC 24-7 9 in the Bay of Bengal, loosely
organized cloud clusters were spread all over the North Indian Ocean
between the equator and 15° north. JTWC post-analysis identify the
pre-TC 24-79 cloud cluster at OOZ October 27. This cloud cluster
tracked north-northwestward on the first day (see Fig. 44). At OOZ
September 28, the pre-TC 24-79 disturbance moved to the southwest side
(cyclonic shear side) of the low-level southeasterly trade winds. It
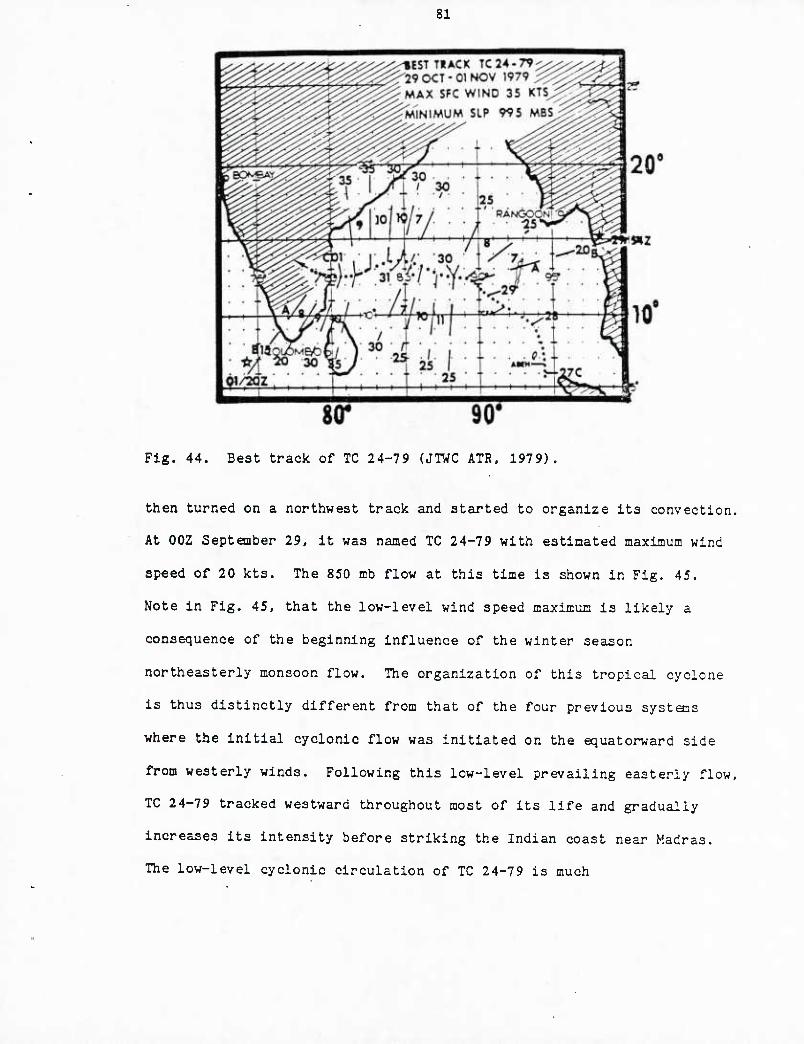
81
Fig. 44. Best track of TC 24-79 (JTWC ATR, 1979)
then turned on a northwest track and started to organize its convection.
At OOZ September 29, it was named TC 24-79 with estimated maximum wind
speed of 20 kts. The 850 mb flow at this time is shown in Fig. 45.
Note in Fig. 45, that the low-level wind speed maximum is likely a
consequence of the beginning influence of the winter season
northeasterly monsoon flow. The organization of this tropical cyclone
is thus distinctly different from that of the four previous systons
where the initial cyclonic flow was initiated on the equatorward side
from westerly winds. Following this low-level prevailing easterly flow.
TC 24-79 tracked westward throughout most of its life and gradually
increases its intensity before striking the Indian coast near Madras.
The low-level cyclonic circulation of TC 24-79 is much
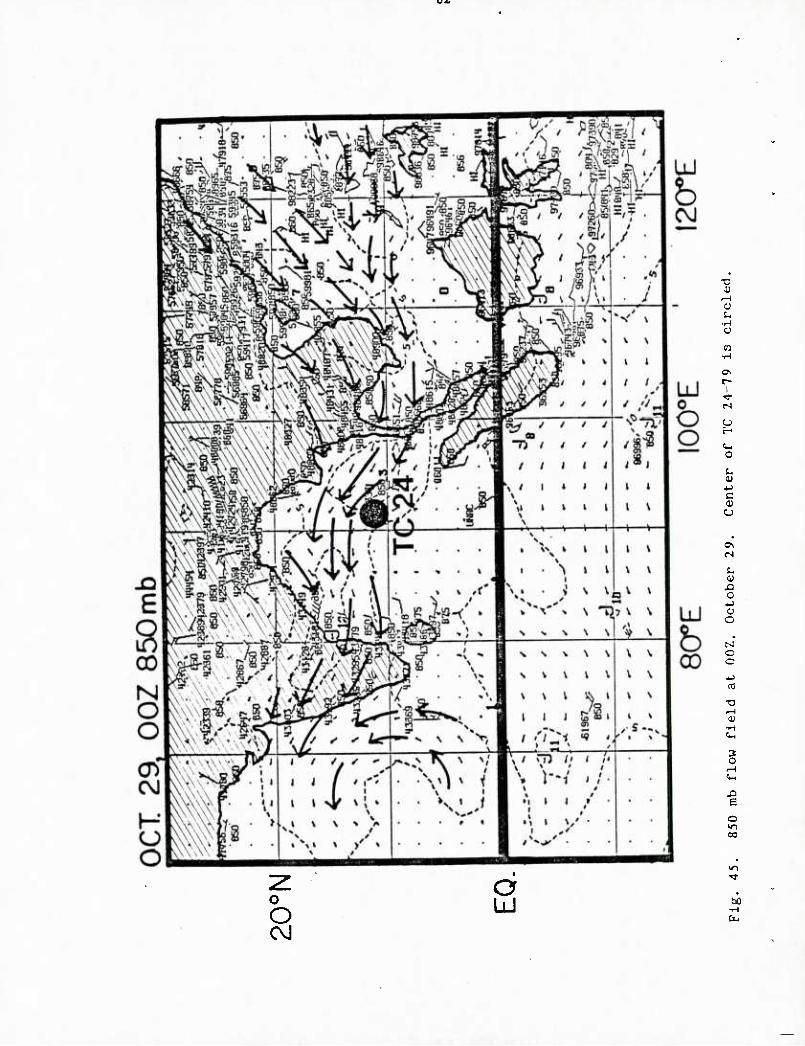
OA
O O CM
o LU
0)
o
o
I
o
o
0)
c
0\ tN
n o a o
c c
03
■a ,-\ •w
3 O
a o CO
b4

83
weaker than that of the other systems, even at its maximuE intensity
(Fig. 46) . The low-level circulation was also much shallower in
comparison with the other TC systons. In fact, TC 24-79 is a relatively
small (in view of the radial domain) syston especially in the coverage
of its satellite cloudiness. The mechanism which maintains TC 24-79's
slow developing appears to be the coupling between the low-level
vorticity and the upper-level anticyclonic circulation. TC 24-79 had a
strong upper level anticyclonic surrounding circulation throughout its
life.
6.6 TC 25-79
TC 25-79 was a large tropical system. Gusts up to 35 kts were in
evidence out to 300 miles from its center (DeAngelis, 1980b). This was,
however, a very strange tropical cyclone for two reasons. First, it did
not have a recognizable cloud pattern — something almost always
associated with any tropical cyclone that forms. Even at its maximum
intensity (40-kts) at 06Z November 16, convection was still not well-
organized near the center. Secondly, TC 25-79 followed a basically
straight northward track as shown in Fig. 47. To understand why it
moved straight northward, we have to look at both upper- and low-level
flows. At upper levels, a trough was located over the Arabian Peninsula
with strong south-southwesterly flow existing over the Arabian Sea
region. At low levels a southeast monsoon flow was found over the
Indian sub-continent. TC 25-79 was located on the southwest side
(cyclonic shear side of a low-level southeast monsoonal wind speed
maximum). The northward track of TC 25-79 is a result of the
combination of the upper-level southwesterly and low-level southeasterly
steering flows. The net zonal steering component was near zero.
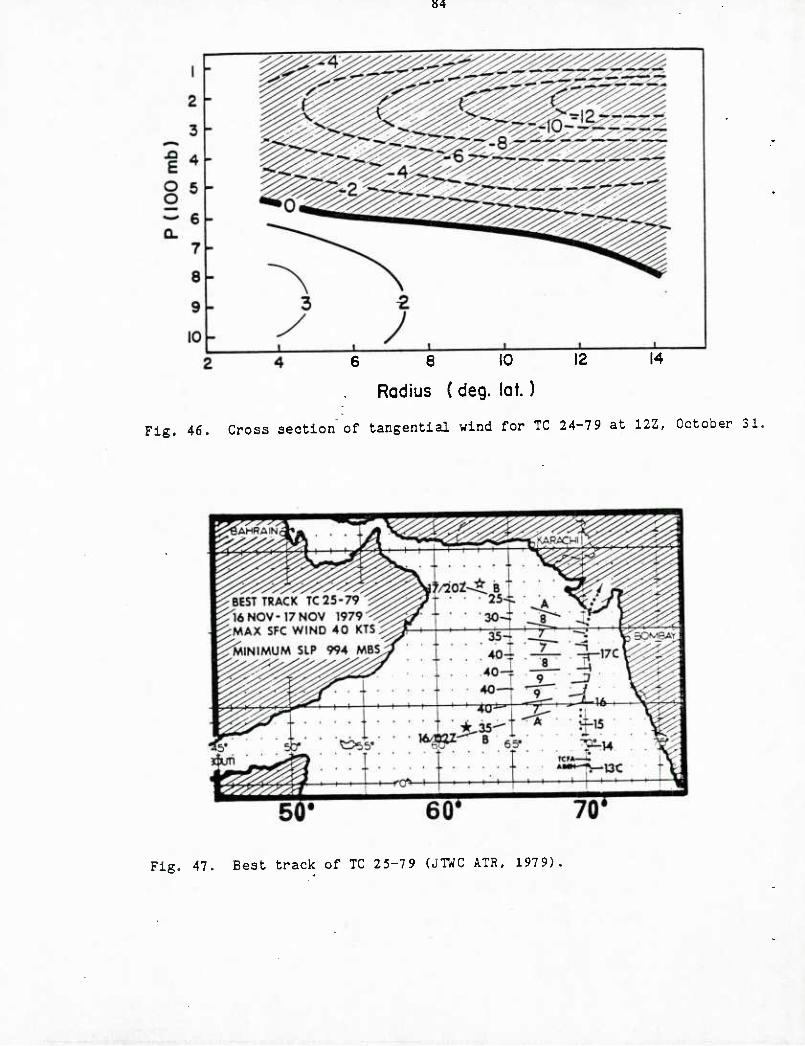
84
6 8 10
Radius ( deg. lot.)
Fig. 46. Cross section of tangential wind for TC 24-79 at 12Z, October 31.
Fig. 47. Best track of TC 25-79 (JTWC ATR. 1979).

85
. . Since TC 25-79 does not have a well organized cloud pattern, the
post-analysis by JTWC does not have it identified until 12Z Movember 14.
Hov;ever, its low-level circulation was well-established at OOZ November
13. Figure 48 shows the time progression of the maximum wind (V ). max
the low-level outer circulation, and the upper-level outflow. Note that
the low-level circulation increases greatly from OOZ November 12 to OOZ
November 13. It is likely that JTWC post-analysis should have named TC
25-79 a little earlier. Also, note that, as with the previous system,
the upper tropospheric outflow (V ) peaks before the maximum intensity
of the cyclone is reached.
The upper-level outflow is very strong until OOZ November 16. Two
significant increases of" upper-level outflow occur between 12Z November
12 and OOZ November 14 and between 12Z November 15 and OOZ November 16.
The former one is due to the enhanced convection to the west of the
center of the pre-TC 25-79 cluster. (No significant intensification was
associated with this increase of outflow.) The nighttime IR satellite
images at 18Z November 13 is shown in Fig. 49. An upper-level trough is
located to the northwest of this convective region. Note that this
cloud pattern largely dissipates in 24 hours and leaves a less defined
cloud pattern. The upper-level outflow to the north and northeast is
also very pronounced, however.
The second increase of upper-level outflow is a result of the
approaching of the upper-level trough that strengthens the northeast
outflow jet. Figure 50 shows the 200 mb flow features at OOZ November
15. The northeast outflow jet is found mainly to the north and
northeast of TC 25-79. It is this outflow jet that probably leads to
the intensification of TC 25-79 between 12Z November 15 and 18Z November 16,

S6
60 r TC 25-79
-^ 40 in
X a
>^ 20
' 150-250 mb V| 'z\ 6° (m/s) \ 1.8 3.0-0.1-3.4-5.1 -7.l-6.6-a0-S.I-8.4-8.l*-8.7
1 ±
2 -. <' < ^
2.0^ e 0 CD (D
8 o ^ o
^■^
E J3 E
O o ~ in O I.U lo 4 Q
1
o o
12 13 14 15 16 17 18 -^DATE (Nov.)
I>
in
l>-
Fig. 48. Time series of" cyclone intensity (Vj^^^) and low-level outer circulation (V^) and upper-level outflow (V ) at 6 radius for TC 25-79. Also shown is 150 mb - 250 mb tangential wind at 6° radius.
Fig. 49. Satellite picture of TC 25-79 at 18Z, November 13. Center is circled.

''■^WSIVT^' ;:'''«t'^-^'i' '"'
87
NOV. 15, OOZ 200mb
40° N
20* N
eo^E lO-'E
Fig. 50. 200 mb flow fiel4 at OOZ, November 15. Center of TC 25-79 is circled. Length of arrows is proportional to wind speed.
6.7 TC 26-79
TC 26-79 developed in the Bay of Bengal in late November with
easterly trade wind flow on its north side (Fig. 51). It was very
similar to TC 24-79 in both its track and the influence of the low-level
trades on its poleward side. Figure 52 shows the 850 mb flow pattern at
OOZ November 21 when TC 26-79 starts its organization. Note that TC
26-79 is located just to the southwest (cyclonic shear side) of the
low-level wind speed maximum.
Although named at 12Z November 20, TC 26-79 does not have a clearly
defined cloud pattern until OOZ November 23. Its low-level circulation
pattern was also not well-established when it was named. However, the
low-level vorticity was still large near the system during its early
stages. At upper levels, an anticyclone center was located over the
north border of the Bay of Bengal, with prevailing southeast wind over

88
the cyclone region. The upper-level anticyclonic circulation of TC 26-
79 experienced a steady increase. No apparent strong outflow channels
or significant intensification was observed with this system.
Using the results of the analysis of these seven individual cases,
the next section will attempt to synthesize some of the important
physical processes that seem to be occurring in N.I.O. tropical
cyclones.
BEST TRACK TC: 23NOV-25NOV MAX SFC WIND
MINIMUM SLP
Fig. 51. Best track of TC 26-79 (JTWC ATR 1979)
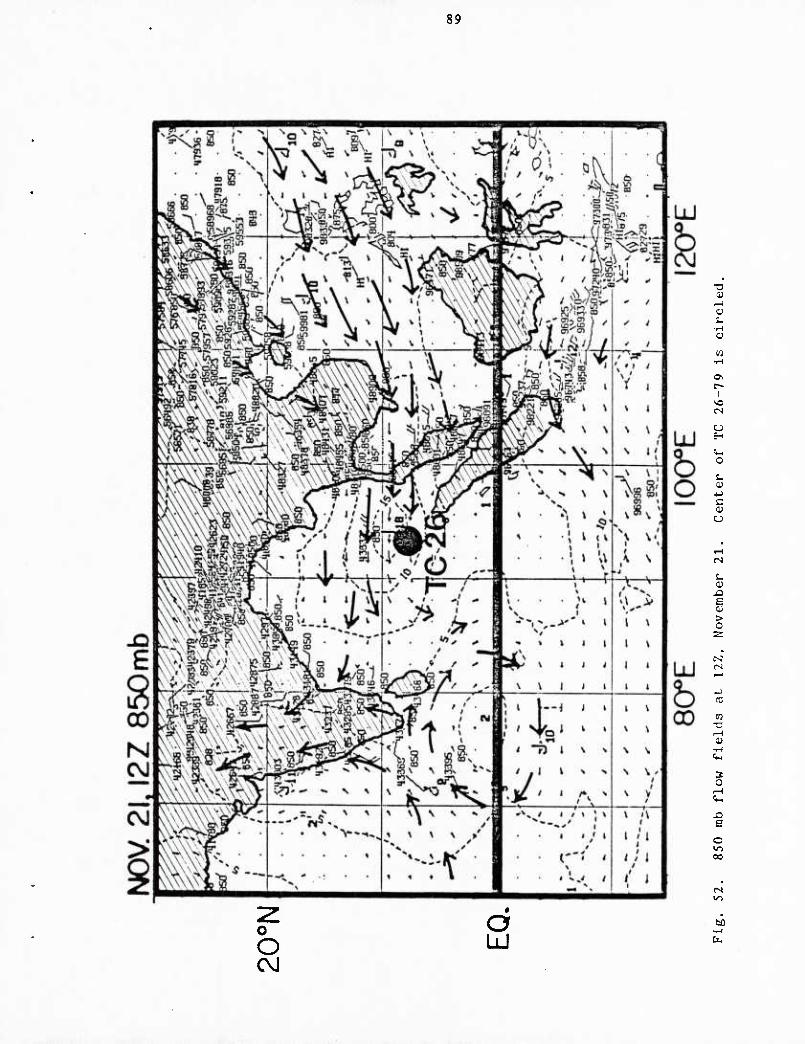
89
O O
o LiJ
0)
a
a
I
cs
o
o
0)
c
cs u V
a > o
4_)
CO
a; ■w
3 O
X3 a o 90
to ■r-t

90
7. DISCUSSION OF RELEVANT N.I.O. TROPICAL CYCLONE FEATURES
The previous section analyzed the large-scale circulation patterns
for all seven tropical cyclones that formed in the North Indian Ocean
during the 1979 FGGE-year period. Although there may be some
Inadequacies in the FGGE Ill-b data and analysis techniques, these data
are still the best information available for any cyclone season. We
believe the ECMWF analysis shows most of the important large-scale wind
characteristics about these cyclone systems, particularly the rotational
component of the wind field and the large-scale divergence patterns of
the upper troposphere. We will now discuss the important general
physical processes related to these tropical cyclones in terms of their
Influence on the genesis, intensification, structure and motion. It is
recognized, however, that discussions based only on 1979 cyclone
information may not always strictly apply to tropical cyclones occurring
in this region for other years.
7.1 Characteristics of the Large-Scale Circulation Patterns During Tropical Cyclone Formation and Development
Like tropical cyclones in the northwest Pacific, N.I.O. tropical
cyclones form within the monsoon trough region. To show this similarity
to northwest Pacific cyclones, we have performed a similar north-south
cross section averaging of zonal wind for the initial stages of all 3 9
systons that later became tropical cyclones in the northwest Pacific
during the same FGGE year. Results are shown in diagram a of Fig, 53.
Note the general similarity when comparison is made to the same average
of the seven N.I.O. pre-tropical cyclones as seen in diagram b of Fig. 53
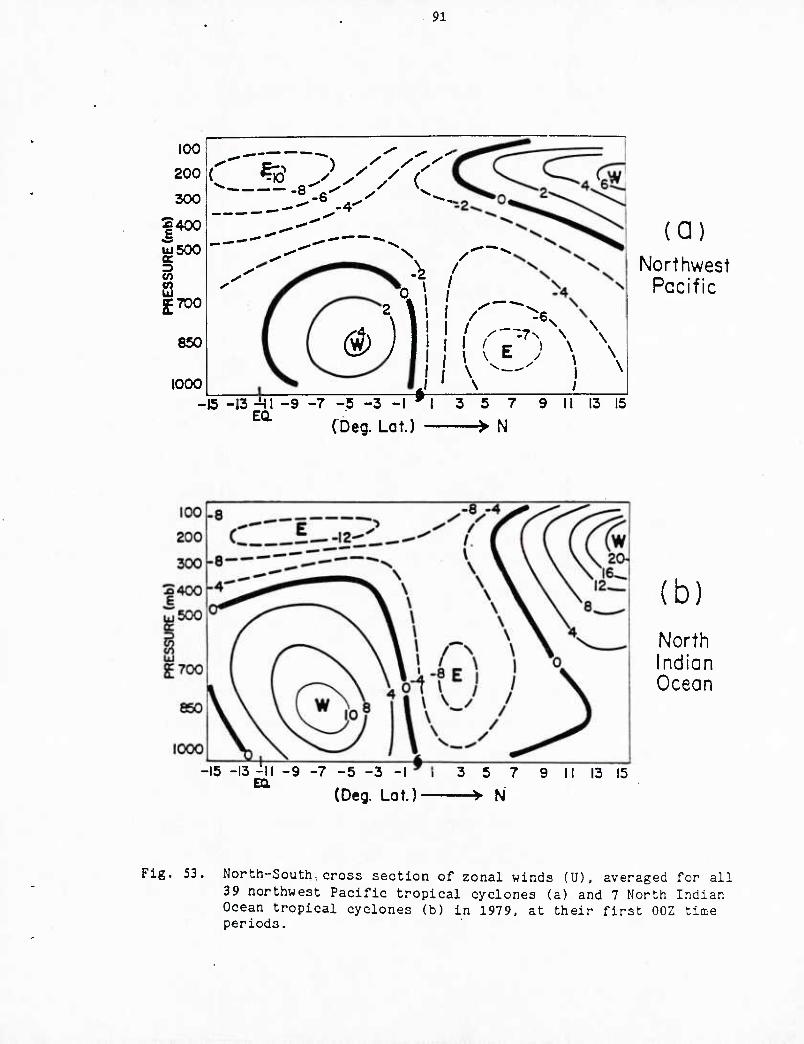
91
100
200
300
|400
gsoo i £700
850
1000
■ 63 ) y /V <^-'
I /
(0) Northwest
Pccific
-15 -13-in 1 -9 -7 -5 -3 -I 'I 3 5 7 9 II 13 15
^^ CDeg. Lot.) > N
-15 -13 -II -9 -7 -5 -3 -I
(Deg. Lat.) 3 5 7 9 II 13 15
—^ N
(b) North Indian Ocean
Fig. 53. North-South.cross section of zonal winds (U), averaged for all 39 northwest Pacific tropical cyclones (a) and 7 North Indian Ocean tropical cyclones (b) in 1979, at their first OOZ time periods.

92 •
A few differences are to be noted, however. The easterly trade winds on
the poleward side are nuch broader in the northwest Pacific; but the
N.I.O. trade winds are of a comparable magnitude and are closer to the
disturbance center.
The N.I.O. cases have a much stronger and broader monsoon-generated
westerly wind component on their equatorward side in comparison to that
of the northwest Pacific cases. Not only is this westerly monsoon flow
stronger than in the Pacific, it is also much deeper. This implies that
the equatorward westerly wind influences are more important to N.I.O.
tropical cyclone formation than are equatorial westerly wind influences
in the west Pacific.
The average wind fields for all the seven N.I.O. cases in 1979
reveal a very deep monsoon-generated cyclonic circulation around the
center of the tropical cyclone formation region. An important feature
from our previous case analysis is that there is always a build-up of
the low-level cyclonic circulation prior to the formation of the
tropical cyclone system. This feature is similar to the ITCZ type
tropical cyclones of the northwest Pacific as has been observed by Lee
(1984). Our analysis also shows that this low-level circulation build-
up is mainly a result of the cross-equatorial monsoonal surges or other
features that strengthen the westerly wind on the equatorward side of
the pre-cyclone disturbances. Love (1982) has also observed similar
equatorial side westerly wind increases about Pacific and Australian
region tropical disturbances from opposite hemispheric middle-latitude
cold surge penetrations into the tropics as illustrated in Fig. 54. The
N.I.O. tropical cyclone forecaster should always be aware of such cold
surge penetrations occurring in the Southern Hemisphere and their
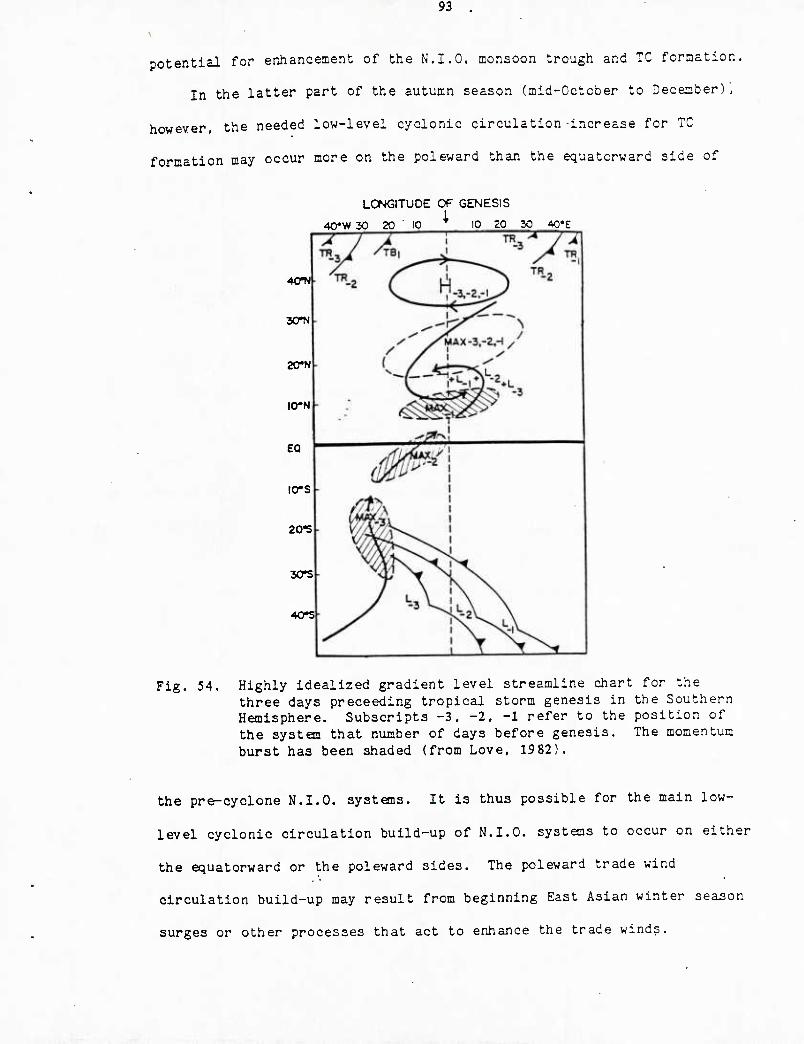
*'■■.■.■' '■■-.'
potential for enhancement of the N.I.O. monsoon trough and TC formation,
In the latter part of the autumn season (mid-October to December),
however, the needed low-level cyclonic circulation-increase for TC
formation may occur more on the poleward than the equatorward side of
LONGITUDE OF GENESIS
40*W 30 20 ■ 10 i 10 20 30 40*E
4CrN
xru
2crN
IO*N
EQ
lO-S
20*5
yrs
40*S
Fig. 54. Highly idealized gradient level streamline chart for the three days preceeding tropical storm genesis in the Southern Hemisphere. Subscripts -3, -2, -1 refer to the position of the system that number of days before genesis. The momentum burst has been shaded (from Love. 1982).
the pre-cyclone N.I.O. systans. It is thus possible for the main low-
level cyclonic circulation build-up of N.I.O. systems to occur on either
the equatorward or the poleward sides. The poleward trade wind
circulation build-up may result from beginning East Asian winter season
surges or other processes that act to enhance the trade winds.

94
Another special feature of the N.I.O. basin is the role of dual
cyclones on either side of the equator. The strengthening of the
equatorial circulation about a tropical cyclone in one hemisphere can
cause a similar increase in the equatorial low-level circulation of the
other hemisphere. Two of the seven 1979 cases were so affected. Keen
(1982) and others have observed cross-equatorial tropical cyclone pairs
to occur in both the Indian Ocean and in the Pacific.
A strong low-level positive vorticity field is thus very important
to tropical cyclone formation in the N.I.O. as it is in most monsoon
trough genesis regions as previously discussed by the second author Gray
(1968, 1979). It is to be noted that the initial enhancement of low-
level circulation about"the pre-cyclone disturbance is typically on only
one side of the disturbance (i.e., equatorward side or poleward side)
and that the tip-off to early cyclone formation and later growth rests
with the gradual wrapping around of the tangential wind field to the"
other sides of the cyclone.
It is to be noted by the time series of the individual storm
profiles of V^^, v^ (700-1000 mb) and V^ (150-250 mb) at 6° radius -
see Figs. 16, 27, 36, 41, 48 - how little related are these parameters.
V can decrease or not decrease as V„,„ increases. These observations
show how difficult it is to relate the maximum intensity of a N.I.O.
tropical cyclone to the strength of the storm's outer circulation.
These observations also show how little the magnitude of the cyclone's
net upper tropospheric radial outflow (i.e. V ) is related to the
cyclone's intensity. It is interesting, however, how the net upper-
level radial outflow (and likely also the net deep cumulus convection)
of most of these N.I.O. system peaked about 2 days before the date of
.95
the observation of the maximum wind. A similar measurenent has also
been reported by E. Rogers (personal communication) in like-time series
analysis of 20 Atlantic tropical cyclones. These observations would
indicate that a blow-up or enhancement of deep cumulus convection (as
might be measured by the satellite) in a tropical disturbance or weak
tropical storm may be indicative of that system's future 1-3 day
intensification.
Upper-level Flow Characteristics. McBride (1981), McBride and Zehr
(1981) and others have emphasized the importance of the upper-level
anticyclonic vorticity (besides the low-level positive vorticity) for
tropical cyclone genesis .in the northwest Pacific and Atlantic. We do
not see the crucial role of the upper-level anticyclonic vorticity in
the early stage genesis of our N.I.O. systems. Upper-level anticyclonic
flow features might play an important role in the later intensification
stages of N.I.O. cyclones, however.
We are finding that the increase of maximum winds (V 5 in a Tf i <:; max
not well related to the net upper-level outflow (V ) occurring around r °
the tropical cyclone, but rather is more related to the concentration of
this outward motion into narrow outflow channels (see Holland and
Merrill (1984) and Chen and Gray (1984) for more discussion). Upper-
level anticyclonic vorticity is required for the establishment of these
narrow and strong outflow channels. The net radial outflow increase
which is produced by an increase in the enhanced deep Cb convection
within the tropical disturbance or tropical cyclone appears to be more
related to the change in cyclone strength or the 1-3° mean tangential
wind of the cyclone.
Chen and Gray have discussed the variety of upper-tropospheric

96
outflow patterns which can occur with tropical cyclones undergoing
central-core intensification. An idealization of the variety of these
outflow patterns is shown in Fig. 55. The type of outflow patterns
associated with most N.I.O. tropical cyclones are those of pattern a, b,
c, and d. A southwest outflow channel is sometimes established by the
strengthening and westward movement or stretching of an upper-level
anticyclone in the South Indian Ocean. Poleward outflow channels are
typically produced by an eastward propagating upper-level trough to the
poleward side of the cyclone. It is observed that a tropical cyclone
can undergo an even more rapid intensification if double outflow
channels are present to both the poleward and equatorward sides of the
cyclone.
We have to emphasize that these outflow channels are the result of
the interaction between the tropical cyclone and its surrounding
environmental flow features which may, to a large extent, be independent
of the particular internal processes of the cyclone.
7.2 Comparison of the Structural Characteristics of N.I.O. Tropical Cyclones with V/estern North Pacific Tropical Cyclones
Many cross sections of tangential winds for individual N.I.O.
tropical cyclones have been shown. These tangential circulation
patterns are in most respects quite similar to the tangential
circulation patterns of the individual northwest Pacific cyclone
systems. To verify this statement we have averaged the tangential wind
field for three time periods for N.I.O. TC 17-79 just before it attained
its maximum intensity of 85 kts. Result are shown in Fig. 56 - diagram
a. Three weak typhoon systems in the northwest Pacific, Typhoon Ellis
(85 kts), Typhoon Cecil (80 kts), and Typhoon Irving (90 kts) are
selected for comparison with TC 17-79 (which was of an intensity close

97
Fig. 55. Variety of outflow patterns associated with tropical cyclone intensification (from Chen and Gray, 1984).
to these systems). The same averaging was performed and is shown in
Fig. 56 (diagram b). The results inside 3° radius are not reliable and
have not been shown. Note how similar these two profiles are. The
circulation about TC 17-79 is very much like that of the three minimal
northwest Pacific typhoons. We can also make a comparison with the 10-
year northwestern Pacific typhoon rawinsonde composite of Frank (1977),
shown in diagram c of this figure. This latter rawinsonde composite
result is for all northwest Pacific tropical cyclones of typhoon
intensity (1 65 knots) or greater. These were of considerably stronger
intensity than the average of our seven N.I.O. cases.

98
(a) TC-17-79 (N.I.O.)
(b)3 NWP SYSTEMS
(C)WPD4
Radius ( deg. lot.}
Fig. 56. Diagram a: vertical cross section of tangential wind averaged at three time periods right before the tropical cyclone N.I.O. TC 17-79 attained its maximum intensity. Diagram b: average of three northwest Pacific minimal typhoons during the FGGE year. Diagram c: the 10-year northwest Pacific typhoon rawinsonde composite of Frank (1977).

99
It is interesting to see that the average results for the three
weak typhoon cases and the 10-year typhoon composite closely resemble
the three time-period composite of TC 17-79. Although results in all
three cases are similar, there are some differences. TC 17-79 appears
to have a stronger outer circulation as compared to those of northwest
Pacific systems. We believe this to be due to the stronger equatorial
monsoon trough that is present in the N.I.O. as compared with the
Pacific. We also find that the outer circulation of N.I.O. systems (TC
17-79. TC 18-79, TC 23-79, and TC 25-79) was generally stronger than
that of most individual Pacific systems. The outer radius low-level
cyclonic circulation also extends over a greater vertical extent for
these four N.I.O. systms. Cyclonic winds extend up to 300-400 mb in
the N.I.O. systons and even higher on their equatorial sides. It
appears that N.I.O. tropical cyclones experience a stronger equatorward
monsoonal influence and have a stronger large-scale surrounding low-
level cyclonic circulation than similar tropical cyclones .of the
northwestern Pacific and the Atlantic. N.I.O. systems that do
experience a more poleward than equatorwards cyclonic wind influence (as
occurs in the late autumn periods of November and December) generally
have a weaker, shallower and less well-defined low-level cyclonic
circulation.
Maximum Intensitv of N.I.O. Tropical Cyclones. Since the tropical
cyclones in the N.I.O. form in relatively small semi-enclosed ocean
basins, these systems generally have shorter lifetimes compared to those
in the other ocean basins — especially to the tropical cyclones of the
northwest Pacific and north Atlantic ocean basins. There is a much
higher probability that N.I.O. cyclones will move inland before
100
favorable large-scale conditions have sufficient time to initiate a
substantial intensification. As discussed by Sadler and Gidley (1973),
most N.I.O. systems dissipate due to landfall. Almost none take on
extra-tropical characteristics. This is one of the major reasons that
less than one-third of N.I.O. tropical cyclones reach typhoon intensity.
(In the northwest Pacific and the Atlantic, roughly 60-70 percent of the
tropical cyclones that form reach typhoon intensity.) Only a few H.I.O.
systems are weakened or die due to being sheared off by strong
baroclinic westerly wind patterns as often occurs at more polar
latitudes in the other ocean basins.
Another reason for the weaker tropical cyclones in the N.I.O. is
the lack of a TUTT (Tropical Upper Tropospheric Trough), which is almost
always present in the northwest Pacific during summer and often present
in the Atlantic during the summer season. Many researchers (Sadler,
1978; Holliday and Thompson, 1979) have emphasized the importance of the
TUTT in initiating both the formation and the intensification of
tropical cyclones through the development of favorable upper
tropospheric poleward outflow channels. Because the TUTT is a mid-
oceanic and primarily a mid-summer phenomenon it is not to be expected
that it would be present during the spring and autumn transitional
seasons when N.I.O. cyclones occur. The Asian continent to the north is
also an inhibiting factor to the development of this oceanic upper
trough system..
7.3 Characteristics of Motion of N.I.O. Tropical Cyclones
We have described the tracks of FGGE year N.I.O. cyclones in
section 4. FGGE year N.I.O. cyclones mostly moved on a northwesterly
track except for TC 18-79 which went straight northward. TC 17-79 had
■-■■'■::-■:'" 101 - ■■ ■/■:
an erratic and looping track due the passage of an upper-level trough to
its north. The average northwestward track for these FGGE year systems
is the result of the prevailing easterly steering current. N.I.O.
systons typically do not recurve or have much of an easterly track
component because they occur at a lower latitude and move over land and
die before they have a chance to be caught up in the westerly
circulation. The Himalayan Mountain Chain also helps protect the N.I.O.
from the influences of strong and deep westerly currents which, if they
were to impinge on these storm systems, would recurve them to the east.
The average speed of motion of these FGGE-year cyclones was about
8-10 kts. This speed is .comparable to those of northwest Pacific
tropical cyclones before' they recurve but slower than Atlantic cyclones
moving in the trade winds. Sadler and Gidley (1973) state that North
Indian tropical cyclones move slower compared to the cyclones of the
western Pacific. But Sadler and Gidley do not distinguish between the
motion of northwest Pacific storms before and after they recurve. It is
also to be noted that the variations of speed among different N.I.O.
cyclones is much less than those of northwestern Pacific or western
Atlantic systems. N.I.O. tropical cyclones occur over a smaller areal
domain than do Pacific and Atlantic cyclones. They encounter fewer
changes in their steering flow components. By contrast, tropical
cyclones in the northwest Pacific occur over a very wide areal domain
and throughout most of the year. Pacific systems thus encounter a
greater variety of large-scale general circulation patterns.
Consequently, the track and speed variability of Pacific cyclones is
also greater. ''
Matsumoto (1984) has recently developed a new 1-3 day TC

102
statistical track prediction scheme for the Atlantic, northwest Pacific
and N.I.O. This scheme has shown itself, in early testing, to be very
skillful. This is the only statistical scheme that has been developed
in the N.I.O. which combines synoptic, persistence, and steering flow
parameters. Matsumoto found that his prediction errors in the N.I.O.
are 10-20% smaller than in the northwest Pacific and Atlantic. This is
attributed to the generally slower motion of N.I.O. cyclones. Matsumoto
also found that persistence is a better predictor in the N.I.O. and
steering and synoptic data less skillful predictors in comparison with
the northwest Pacific and the Atlantic. It is planned that the new
statistical scheme undergoes good testing to determine its feasibility
as an operational forecast aid.

103
8. ACKNOWLEDGEMENTS
This research has been supported by the Naval Environmental
Prediction Research Facility (NEPRF) under the encouragement of Samson
Brand (Grant No. N00228-83-3122). We have utilized the computing
facilities of the National Center for Atmospheric Research (NCAR) for
ECMWF data analysis from the NSF Grant No. ATM-82-14041. NCAR is
supported by the National Science Foundation.
We would like to thank Captain Roger Edson for a critical review of
this manuscript and to Cindy Schrandt, Patti Nimmo and Barbara Brumit
for very competent support in manuscript preparation.
104
9. REFERmCES
Arnold, C. P., 1977: Tropical cyclone cloud and intensity relationships. Dept. of Atmos. Sci. Paper No. 277, Colo. State Univ., Ft. Collins, CO, 154 pp.
Askue, C, 1984: Varying structure and intensity change characteristics of four western north Pacific tropical cyclones. Dept. of Atmos. Sci., M.S. Thesis, Colo. State Univ., Ft. Collins, CO, 97 pp.
Askue, C. and C. S. Lee, 1984: A study of the genesis and intensification of two 1979 northwest Pacific supertyphoons. Paper presented at the 15th Technical Conference on Hurricanes and Tropical Meteorology, January 9-13, Miami, Florida, 243-248.
Bansal, R. K. and R. K. Datta, 1972: Certain aspects for intensification of tropical storms over Indian Ocean area. Indian J. Meteo. Geophys.. 23. 4, 503-506. -
Chen, L. and W. M. Gray, 1984: Global view of the upper level outflow patterns associated with tropical cyclone intensity changes during FGGE. Paper presented at the 15th Technical Conference on Hurricanes and Tropical Meteorology, January 9-13, Miami, Florida, 224-231.
DeAngelis, D., 1979: Hurricane alley. Mariners Weather Log. 21, 322- 325.
DeAngelis, D., 1980a: Hurricane alley. Mariners V/eather Log, 24, 24- 28.
DeAngelis, D., 1980b: Hurricane alley. Mariners Weather Log, 24, 107- 110.
DeAngelis, D.. 1980c: Hurricane alley. Mariners Weather Log. 24, 424- 429.
Dvorak, V. F., 1975: Tropical cyclone intensity analysis and forecasting from satellite imagery. Mon. Wea. Rev.. 103. 420-430.
Frank, W. M., 1977: The structure and energetics of the tropical cyclone, I: Storm structure. Mon. Wea. Rev. IPS. 1119-1135.
Gray, W. M., 1968: Global view of the origin of tropical disturbances and storms. Mon. Wea. Rev., 96. 669-700.

105
Gray, W. M., 1975: Tropical cyclone genesis. Dept. of Atmos. Sci. Paper No. 234, Colo. State Univ., Ft. Collins, CO, 121 pp.
Gray, W. M., 1979: Hurricanes: their formation, structure and likely role in the tropical circulation. Supplement to Meteorology Cver the Tropical Oceans. Published by RMS, James Glaisher House, Grenville Place, Bracknell, Berkshire, RG 12 IBX, D. B. Shaw, ed., 155-218.
Holland, G. J., 1984: On the climatology and structure of tropical cyclones in the Australian/southwest Pacific region, I: Data and tropical storms. Aust. Met. Mag.. Vol 32, 1, 1-16.
Holland, G. J., 1984: On the climatology and structure of tropical cyclones in the Australian/southwest Pacific region, II: Hurricanes. Aust. Met. Mag" Vol. 32, 1, 17-32.
Holland, G. J., 1984: On the climatology and structure of tropical cyclones in the Australian/southwest Pacific region. III: Major hurricanes. Aust. Met. Mag., Vol 32, 1, 33-46.
Holland, G. J. and R. T.; Merrill, 1984: On the dynamics of tropical cyclone structural changes. Quart. J. Roy. Meteor. Soc., 110, 723-745.
Holliday, C. H. and A. H. Thompson, 1979: Climatological characteristics of rapidly intensifying typhoons. Mon. Wea. Rev.. 107. 1022-1034.
Joint Typhoon Warning Center, 1979: Annual Typhoon Report. NAVOCEAN- COMCEN/JTWC. Guam, 191 pp.
Keen, R. A., 1982: The role of cross-equatorial tropical cyclone pairs in the southern oscillation. Mon. Wea. Rev., nO, 1405-1416.
Krishnamurti, T. N., P. Greiman, Y. Ramanathan, R. Pasch and P. Ardanuy, 1980: Quick look summer MONEX atlas. Part I: Saudi Arabia Phase. FSU Report No. 80-4, 71 pp.
Krishnamurti, T. N., P. Ardanuy, Y. Ramanathan. and R. Pasch, 1981: On the onset vortex of the summer monsoon. Mon. Wea. Rev., 109. 2 344-363.
Lee, C. S., 1984: Large-scale influences on individual cases of tropical cyclone genesis during the FGGE year. Paper presented at the 15th Technical Conference on Hurricanes and Tropical Meteorology, January 9-13, Miami, Florida, 281-288.
Love, G., 1982: The role of the general circulation in western Pacific tropical cyclone genesis. Dept. of Atmos. Sci.. Paper No. 340, Colo. State Univ., Ft. Collins, CO 80523, 215 pp.

106
Matsumoto, C, 1984: A statistical method for one- to three-day tropical cyclone track prediction. Dept. of Atmos. Sci. Ph.D. Dissertation, Colo. State Univ., Ft. Collins, CO, 200 pp.
McBride, J. L., 1981: Observational analysis of tropical cyclone formation. Part III. Budget Analysis. J. Atmos. Sci.. 38, 1117- 1131.
McBride, J. L. and R. Zehr, 1981: Observational analysis of tropical cyclone formation. Part II. Comparison of non-developing versus developing systens. J. Atmos. Sci.. 38, 1132-1151.
Mooley, D. A., 1980: Severe cyclonic storms in the Bay of Bengal, 1877-1977. Mon. Wea. Rev.. 108. 1647-1655.
Sadler, J. C, 1978: Mid-season typhoon development and intensity changes and the tropical upper tropospheric trough. Mon. Wea. Rev.. 106. 1137-1152.
Sadler, J. C. and R. E. Gidley, 1973: Tropical cyclones of the North Indian Ocean. ENVPREDRSCHFAC Tech. Paper No. 2-73, Naval Postgraduate School, Monterey, CA, 58 pp.
Saha, K., F. Sanders, and J. Shukla, 1981: Westward propagating predecessors of monsoon depressions. Mon. Wea. Rev.. 109, 2, 330-343.
Weatherford, C. and W. M. Gray, 1984: Relating typhoon intensity to outer 1-3° radius circulation as measured by reconnaissance aircraft. Paper presented at the 15th Technical Conference on Hurricanes and Tropical Meteorology, January 9-13, Miami, Florida, 23 8-242.
Xu, J. and W. M. Gray, 1982: Environmental circulations associated with tropical cyclones experiencing fast, slow and looping motion.
, . Dept. of Atmos. Sci. Paper No. 346, Colo. State Univ., Ft. Collins, CO 80523, 111 pp.
■fe|:ii;>>-r-ii.fc'i'.%vpjt ■ ; *■:'■
107
DISTRIBUTION
COMSEVENTHFLT ATTN: FLT METEOROLOGIST FPO SAN FRANCISCO 96601-5003
COMSEVENTHFLT ATTN: NSAP SCIENCE ADVISOR BOX 157 FPO SEATTLE 98762
COMSIXTHFLT ATTN: FLT METEOROLOGIST FPO NEW YORK 09501-6002
COMMANDER MIDDLE EAST FORCE FPO NEW YORK 09501-6008
COMMANDER AMPHIBIOUS GROUP 1 ATTN: METEOROLOGICAL OFFICER FPO SAN FRANCISCO 96601
COMMANDING OFFICER USS CORAL SEA (CV-43) AHN: MET. OFFICER, OA DIV. FPO NEW YORK 09550-2720
COMMANDING OFFICER USS SARATOGA (CV-60) ATTN: MET. OFFICER, OA DIV FPO MIAMI 34078-2740
COMMANDING OFFICER USS CONSTELLATION (CV-64) ATTN: MET. OFFICER, OA DIV FPO SAN FRANCISCO 96635-2780
COMMANDING OFFICER USS ENTERPRISE (CVN-55) ATTN: MET. OFFICER, OA DIV. FPO SAN FRANCISCO 96636-2810
COMMANDING OFFICER USS KITTY HAWK (CV-63) ATTN: MET. OFFICER, OA DIV. FPO SAN FRANCISCO 96634-2770
COMMANDING OFFICER USS MIDWAY (CV-41) ATTN: MET. OFFICER, OA DIV. FPO SAN FRANCISCO 96631-2710
COMMANDING OFFICER USS RANGER (CV-61) ATTN: MET. OFFICER, OA DIV. FPO SAN FRANCISCO 96633-2750
COMMANDING OFFICER USS CARL VINSON (CVN-70) ATTN: MET. OFFICER, OA DIV. FPO SAN FRANCISCO 96629-2840
COMMANDING OFFICER USS NEW JERSEY (BB-52) ATTN: MET. OFFICER, OA DIV. FPO SAN FRANCISCO 96688-1110
COMMANDING OFFICER USS BELLEAU WOOD (LHA-3) ATTN: METEOROLOGICAL OFFICER FPO SAN FRANCISCO 96623-1610
COMMANDING OFFICER USS NEW ORLEANS (LPH-11) ATTN: MET. OFFICER FPO SAN FRANCISCO 96627-1650
COMMANDING OFFICER USS OKINAWA (LPH-3) ATTN: MET. OFFICER FPO SAN FRANCISCO 96625-1630
COMMANDING OFFICER USS PELELIU (LHA-5) ATTN: MET. OFFICER FPO SAN FRANCISCO 95624-1620
COMMANDING OFFICER USS TARAWA (LHA-1) ATTN: MET. OFFICER FPO SAN FRANCISCO 96622-1600
COMMANDING OFFICER USS TRIPOLI (LPH-10) ATTN: METEOROLOGICAL OFFICER FPO SAN FRANCISCO 96626-1645
OFFICER IN CHARGE U.S. NAVOCEANCOMOET FPO SAN FRANCISCO 96585-2905
COMMANDING OFFICER NAVAL RESEARCH LAB ATTN: LIBRARY, CODE 2620 WASHINGTON, DC 20390
COMMANDING OFFICER NAVWESTOCEANCEN BOX 113 PEARL HARBOR, HI 95860
COMMANDING OFFICER U.S. NAVOCEANCOMCEN BOX 12, COMNAVMARIANAS FPO SAN FRANCISCO 96530-2925

108
DIRECTOR OF RESEARCH U.S. NAVAL ACADEMY ANNAPOLIS, MD 21402
(2) NAVAL POSTGRADUATE SCHOOL METEOROLOGY DEPT. MONTEREY, CA 93943
LIBRARY NAVAL POSTGRADUATE SCHOOL MONTEREY, CA 93943-5100
COMMANDER (2) NAVAIRSYSCOM ATTN: LIBRARY (AIR-723D) WASHINGTON, DC 20361-0001
COMMANDER NAVAIRSYSCOM (AIR-330) WASHINGTON, DC 20361-0001
USAFETAC/TS SCOTT AFB, IL 62225
AFGWC/DAPL OFFUTT AFB, NE 68113
DIRECTOR (12) DEFENSE TECH. INFORMATION
CENTER, CAMERON STATION ALEXANDRIA, VA 22314
ACQUISITIONS SECT. IRDB-D823 LIBRARY & INFO. SERV., NCAA 6009 EXECUTIVE BLVD. ROCKVILLE, MD 20852
DIRECTOR NATIONAL HURRICANE CENTER NOAA, GABLES ONE TOWER 1320 S. DIXIE HWY CORAL GABLES, FL 33146
DIRECTOR FEDERAL EMERGENCY MANAGEMENT AGENCY (FEMA) WASHINGTON, DC 20472
COLORADO STATE UNIV. (6) ATMOSPHERIC SCIENCES DEPT. ATTN: DR. WILLIAM GRAY FORT COLLINS, CO 80523
UNIVERSITY OF HAWAII METEOROLOGY DEPT. 2525 CORREA ROAD HONOLULU, HI 96822
INSTITUTE FOR STORM RESEARCH UNIVERSITY OF ST. THOMAS 3600 MT. VERNON HOUSTON, TX 77005
SCIENCE APPLICATIONS INTERNATIONAL CORP.
205 MONTECITO AVE. MONTEREY, CA 93940
:sAic;
DIRECTOR, JTWC BOX 17 FPO SAN FRANCISCO 96630
BUREAU OF METEOROLOGY BOX 1289K, GPO MELBOURNE, VIC, 3001 AUSTRALIA
DIRECTOR, INDIAN INST. OF TROPICAL METEOROLOGY
RAMDURG HOUSE RUNE 411-005, INDIA

DUDLEY KNOX LIBRARY ^ RESEARCH REPORTS U219270 5 6853 01078585 0