1 neuroscience of early childhood development & role of … · · 2017-01-04wiring the brain...
TRANSCRIPT

Neuroscience of Early Childhood
Development & Role of Parenting
Dr Patrick Ip
ICP 21
20 Oct 2016
1

Neuroscience of Brain Development
•Brain is changed by
experiences - early years
of life impacts on long
term outcomes (life course)
•Relationships program
socio-emotional function
development
2

Transactional model - Child Development
CONSTITUTION C1 C2 C3 C4 C5 etc
ENVIRONMENT E1 E2 E3 E4 E5 etc
How children (and adults) turn out is the outcome of
the transaction between biology and environment
3

Bio-ecological model of Development
• Children are shaped by their interactions with their parents, relatives, peers, teachers and other community members
•
• Critical periods during the
• course of brain development
• that differentially influence
• development of the body and
• mind
4

Critical Periods
• In the 1st year of life, the brain grows at a pace of 700-1000 new neural connections per second.
• By age 3, a child’s brain is twice as active as an adult brain
• It is Early Life Experiences that determine the capacity of the brain – its structure and function
5

What science is telling us ?
Our earliest experiences are responsible for literally wiring the brain for future use, therefore building its basic architecture
During its period of greatest growth - from before birth to ~ three - the cerebral cortex is adding an astounding 40,000 synaptic connections every sec
Dendrites Nucleus
Axon
Electrical
signal
Neurotransmitter
chemical contained
in vesicles
Synap
se

Brain Facts
You are born with 100
billion neurons, but
these are largely
unconnected and not
networked
Synapses are produced at the rate of 1.8 million per second between 2 months and
2 years!
Each neuron forms about 1,500 synapses
You have more
than 2 million miles
of neuronal fibres
By the age of 2 a child has as many synapses as an adult but this has doubled by the age of 3
By late adolescence half the
synapses in the brain have
been discarded
Stress induced
neurochemicals lead to
cell death in a tender brain Neglect may cause
unused regions to
atrophy - apopsis
When signal transmission reaches a
certain threshold the synapses
involved become exempt from future
elimination
Myelination begins in the brain
stem and cortex and progresses
to higher order regions of
thought, memories & feelings
By the age of 3, the brain
has reached 90% of adult
size
The brain continues to
grow & develop until mid
20’s but remember
plasticity

Plasticity –the ability to adopt and adapt to stimulus
Neuronal networks are continuously shaped by genetic, environmental and experiential stimulus and strengthened
through repetition
* Brain plasticity reduces as we age

Our Brains

• During the first few years of life the brain becomes organised i.e. the brain changes in response to stimulation.
• Neurons which were unconnected at birth become connected
• Neurons which are not stimulated are lost
• Lack of stimulation and profound neglect alters and reduces the brain’s functioning
• Assaults and toxins can damage brains cells, resulting in difficulties associated with the area affected.
26 November 2013 Masters BSU
海馬體
下視丘
杏仁核
新皮層
基底核

Brain Functions by Region
Brain Region
Age of Greatest
Developmental
activity
Age of
Functional
Maturity
key Functions
Neocortex
(Forebrain)
Childhood
Adult
Reasoning, problem-
solving, abstraction,
secondary sensory
integration
Limbic
(Forebrain)
邊緣系統
Early
childhood
Puberty
Memory, emotional
regulation, attachment,
affect regulation, primary
sensory integration
Diencephalon(Forebrain)
Infancy
Childhood
Motor control, secondary
sensory processing
Brainstem.
(Mid and
Hindbrain)
In utero
Infancy
Core physiological
reflexes and state
regulation, primary
sensory processing

Synaptogenesis & Apoptosis – developing, tuning and pruning our neuronal networks
• We are born with many more neurons than
we will ever need • Genes, environment & experience effect the
density of the neuronal networks • As we develop and grow some networks are
pruned e.g. babies are tuned into every human sound but gradually
“prune” out the ones not needed or used for their “mother tongue”
‘Use it or loose it’, ‘Neurons that fire together wire together’


Parental-Infant Attachment
• Children form emotional attachments to parents and caregivers in early life
• When caregivers are sensitive and responsive to child’s needs, they provide a secure base to explore the world
• Contributes to later emotional and cognitive development and future interpersonal relationships
14

Early Years Matter
• Windows of opportunity
• Patterns of early caregiving matters
• Across species similar bio-behavioural systems are involved in parenting
15

Oxytocin System
• Oxytocin (催產素) and vasopressin (升壓素): • two neuropeptides that are synthesized and
released from the hypothalamus (下視丘)
• Key elements in the neurobiology of attachment and bonding
16

Biology of Parent-Child Bonding
• High levels of oxytocin are associated with responsive affectionate caregiving
• More securely attached individuals as adults show an increased reward response to being with their child, and less of an averse reaction to hearing the baby’s cries
• Parenting begets parenting
17

Adverse Childhood Experience (ACE)
• An ACE is a traumatic experience in a person’s life as a child and adolescent
• Child abuse (emotional, physical, or sexual), child neglect (emotional or physical), and household dysfunction (domestic violence, substance abuse, mental illness, teenage pregnancy)
18

Number of Risk Factors
Source: Barth et al. (2008)
Ch
ild
ren
wit
h
Develo
pm
en
tal D
ela
ys
1-2 3 5 4 6 7
20%
40%
60%
80%
100%
損害智能發展
Significant Adversity Impairs Development in first 3 years
19

Risk Factors for Adult Depression are Embedded in Adverse Childhood Experiences
Od
ds R
ati
o
ACEs Source: Chapman et al, 2004
0 1 2 3 4 5+
1
2
4
3
5
Elevated risk for Depression
20

Adverse Experiences Source: Dong et al, 2004
Od
ds R
ato
0 1 2 3 4 5,6 7,8
0.5
1
1.5
2
2.5
3
3.5
增加心臟病風險
Risk Factors for Adult Heart Disease Are Embedded in Adverse Childhood Experience
21

(Published on 4 Oct 2016)

A Better Brain and Body
• Parenting provides a legacy that transcends genes
• It has a direct impact on: • Brain
(interconnectedness of brain regions, epigenetics)
• Physical health (metabolism, telomere length)
23

Better Brains and Bodies
• Early Child Development programs aimed at enhancing responsive parenting can:
• Reduce the number of adverse childhood experiences
• Positively impact:
• Brain structure and function,
• Hormonal and immune systems
• DNA is read and transcribed
24

Generation to Generation
Parenting Begets Parenting:
• Growing body of scientific literature that
indicates that an important predictor of
parenting behaviour is how parents were
parented themselves
• This reality has the potential to create
vicious or virtuous cycles
25

Responsive Parenting
• Responsive Parenting occurs when:
• parents do their best to invest in their children
• meet children’s physical, nutritional, emotional and cognitive needs during pregnancy and the early years
26

Resilience
• Early childhood adversity and poor parenting can set
the stage for a vicious cycle
• Intergenerational transmission of poor parenting
• Resilience: in many cases, parents who experienced adversity as a child, including physical abuse, will not adopt the same pattern of behaviour with their child
27

The Economic Dimension
• Positive results of prospective longitudinal studies
• Economic benefits also support the value to society of parent-child interventions in the early preschool years
28

29

年齡
人類資本投資回報
學前計劃
學校教育
職業訓練
Interpreting the Evidence on Life Cycle Skill Formation Heckman et al 2005,
30

Parental & Societal Expectation
What do we want from our children?
•Excellent academic performance
•Good career prospect
•Good health
•Positive holistic development
(physical, mental, emotional)
31

Early Child Development in Hong Kong
32

Early Development Instrument (EDI)
• A population measure of school readiness and holistic development of young children:
• (a) Physical health and well-being
• (b) Social competence
• (c) Emotional maturity
• (d) Language and cognitive development
• (e) Communication skills and general knowledge
33

(Hong Kong)
34
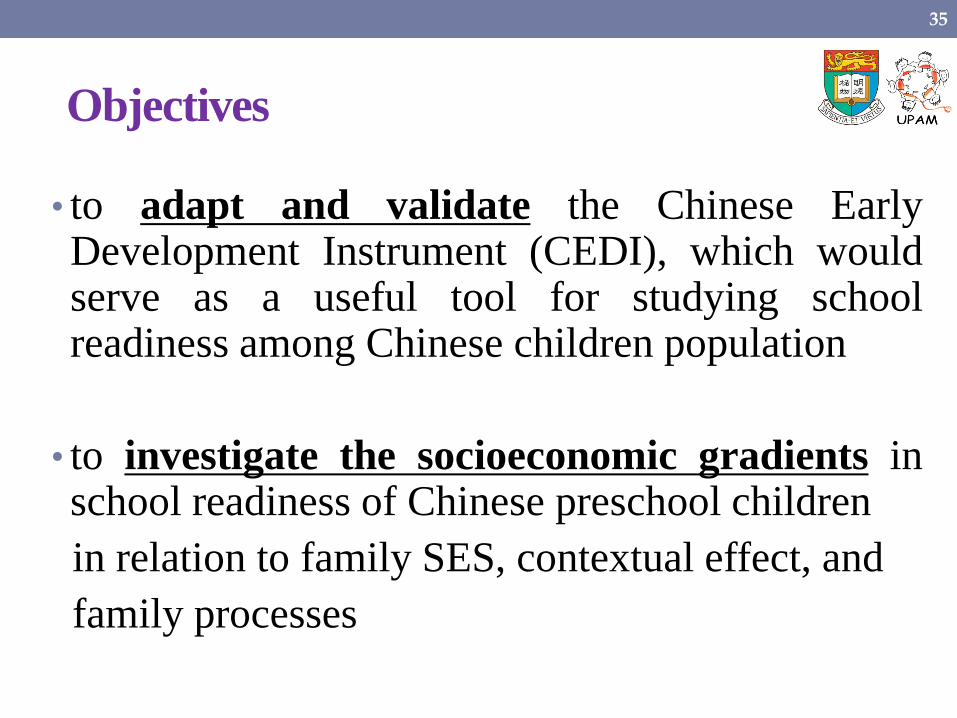
Objectives
• to adapt and validate the Chinese Early Development Instrument (CEDI), which would serve as a useful tool for studying school readiness among Chinese children population
• to investigate the socioeconomic gradients in school readiness of Chinese preschool children
in relation to family SES, contextual effect, and
family processes
35

36

37

Training of Teachers
• In the main study, the validated Chinese version of Early
Development Instruments (CEDI) were collected from
567 kindergarten children of 21 kindergartens located in
two districts with dramatically different socioeconomic
characteristics in Hong Kong, Yuen Long & HK Island
38

39

Main study findings
• Existence of socioeconomic gradient
• On average, for one unit increment in SES
(one standard deviation) would increase the
total CEDI scores by 0.69
• The evidence provided support to the inequalities within kindergarten classes associated with family SES
40
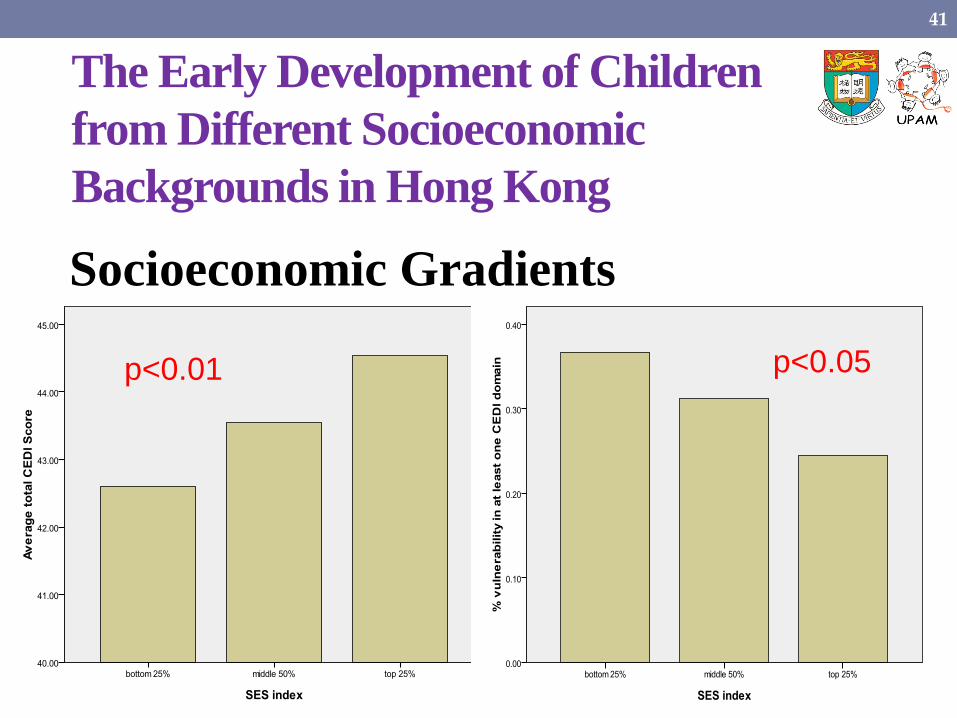
The Early Development of Children
from Different Socioeconomic
Backgrounds in Hong Kong
Socioeconomic Gradients p<0.01 p<0.05
41
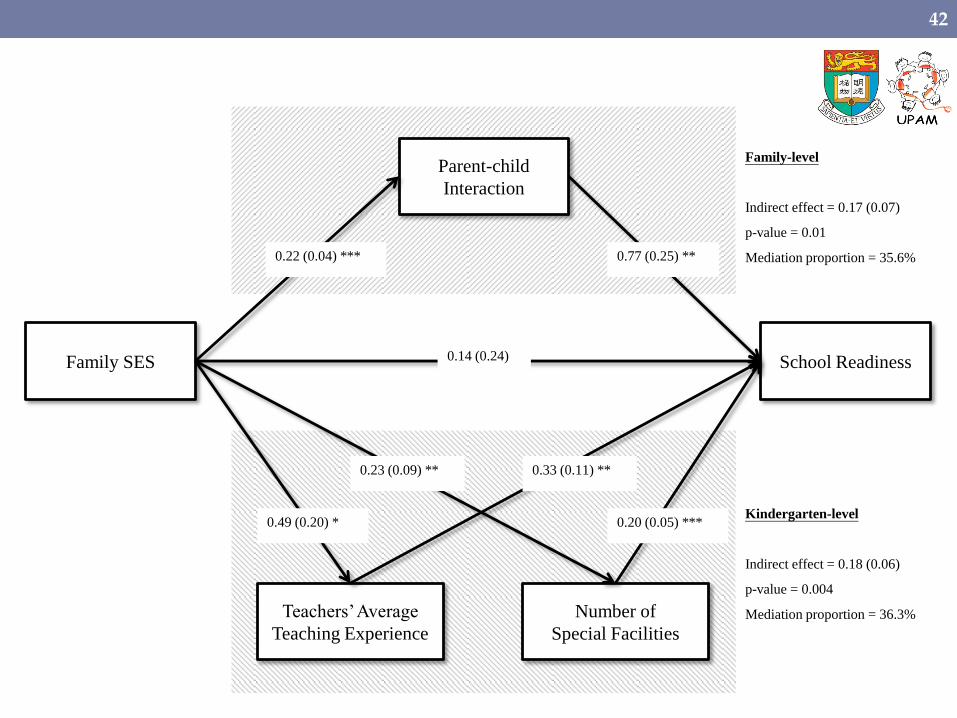
Family SES School Readiness
Parent-child
Interaction
Teachers’ Average
Teaching Experience
Number of
Special Facilities
0.22 (0.04) *** 0.77 (0.25) **
0.14 (0.24)
0.20 (0.05) ***
0.33 (0.11) **
0.49 (0.20) *
0.23 (0.09) **
Family-level
Indirect effect = 0.17 (0.07)
p-value = 0.01
Mediation proportion = 35.6%
Kindergarten-level
Indirect effect = 0.18 (0.06)
p-value = 0.004
Mediation proportion = 36.3%
42

Mediating effects of Family and Kindergarten
• Mediating effect of
Family processes (i.e.
frequency of parent-
child interactions and
management of child
digital use at home) in
explaining
socioeconomic gradients
in child developmental
outcomes
• Kindergarten level
variables (annual school
fees, teacher education
background and
working experience) as
important mediators
which accounted for
significant proportion of
variance in the total
CEDI score
Double jeopardy !!
43

The importance of parent-child interaction
• Collaborative study with Prof James Heckman
• Aims to show the importance of parent-child interaction relative to family income and other SES indicators
44

The importance of parent-child interaction
45
Recreation-based parent-child interaction has better
predictive performance than SES

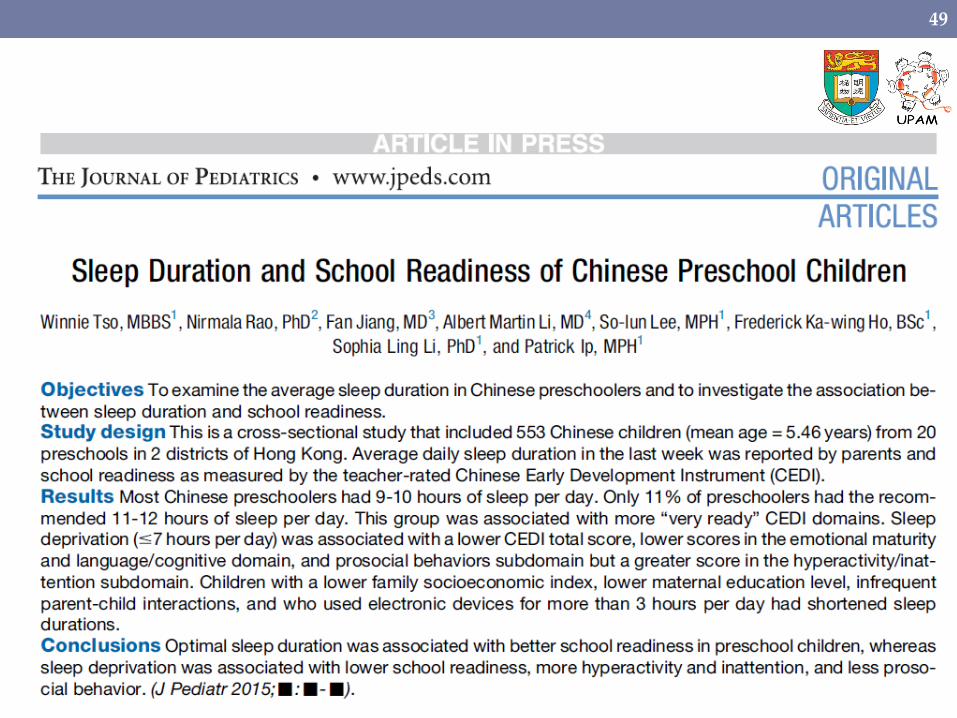
Sleep & Early Child Development
• Sleep has been identified as the most important period of a day affecting growth and development
• Detrimental effects of insufficient sleep on adolescent health well documented (AAP 2005)
46

47

Knowledge Gap
• Would sleep affects the early development of children?
• The first study of such on the relationship between sleep duration and school readiness of preschool children
• 567 K3 Chinese children (~5 year old) recruited
48
49

Sleep duration categorisation
• Age-Specific Recommendations: • NHS: 11 hours
• NIH: 11-12 hours
• Sleep duration was categorized into:
n %
<9 hours 100 18.0
9-10 hours 390 70.1
11-12 hours 61 11.0
>12 hours 2 .4
Effective total 553 (out 556 samples) 99.5
50

Sleep Duration of Hong Kong Preschool Children
51

School Readiness vs Insufficient Sleep
52
Adjusted for family SES
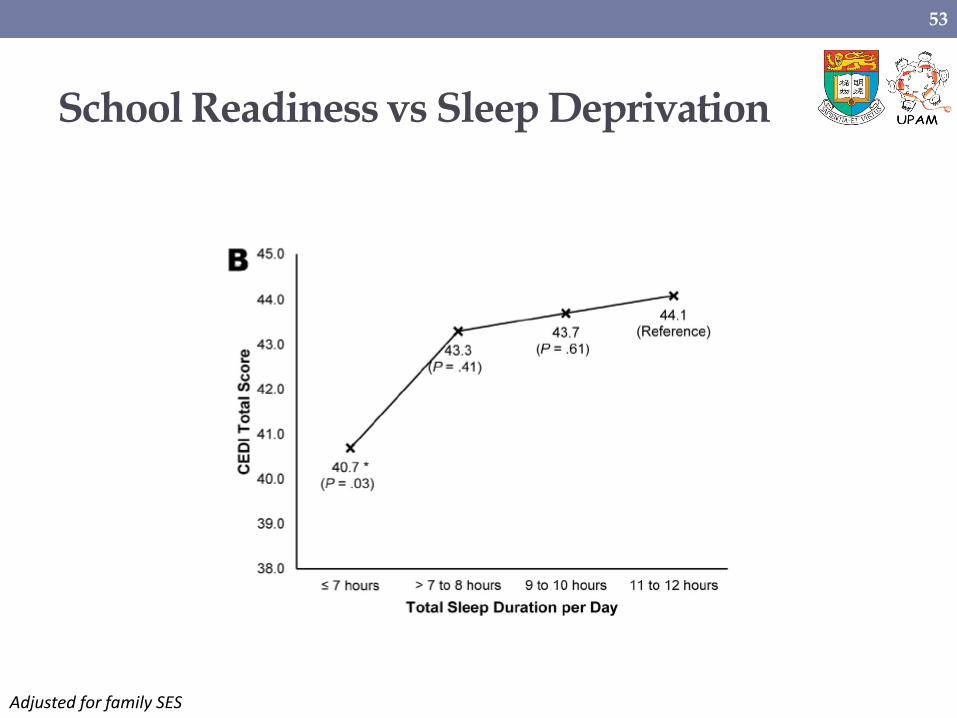
School Readiness vs Sleep Deprivation
Adjusted for family SES
53

Prosocial Behaviour
54
Adjusted for family SES

Hyperactivity and inattention
55
Adjusted for family SES

Sleep duration of children
• Associated with better family functioning • more parent-child activities
• higher family SES
• Negatively associated with the use of electronic devices
56

Sleep and Child Development
• Children are most ready for school when they have optimal sleep duration
• The less hours children sleep, the lower are their school readiness; this is particularly true for children from wealthy families
• Sleep deprivation in children increases risk of vulnerability in school readiness
57

Longitudinal Association between Sleep and Risk of ADHD
58

ADHD risk and early sleep deprivation
59
Adjusted for baseline SES, OSA diagnosis, frequent snoring, and methylphenidate use

ADHD risk and sleep deprivation at P3
60
Adjusted for baseline SES, OSA diagnosis, frequent snoring, and methylphenidate use

ADHD symptom severity
ADHD symptom score
β (95% CI) P
Sleep duration in K3
<8 hours 0.76 ( 0.10, 1.41) *
8 to <9 hours 0.41 ( 0.04, 0.79) *
9 to <11 hours 0.23 (-0.08, 0.54)
11 to 12 hours 0 (Reference)
Sleep duration in P3
<8 hours 0.20 (-0.07, 0.46)
8 to <10 hours 0.11 (-0.11, 0.33)
≥10 hours 0 (Reference)
Days with regular sleep pattern in P3
0–3 days/week 0.39 ( 0.03, 0.74) *
4–5 days/week 0.30 (-0.03, 0.64)
6–7 days/week 0 (Reference)
Days with good quality sleep in P3
0–3 days/week 0.34 ( 0.10, 0.58) **
4–5 days/week 0.04 (-0.18, 0.26)
6–7 days/week 0 (Reference)
61

Gender differences
ADHD symptom severity
Female (n=204) Male (n=197)
β (95% CI) P β (95% CI) P
Sleep duration in K3
<8 hours 0.63 (-0.20, 1.47) 0.83 (-0.17, 1.83)
8 to <9 hours 0.12 (-0.38, 0.62) 0.66 ( 0.11, 1.22) *
9 to <11 hours 0.04 (-0.35, 0.44) 0.49 ( 0.02, 0.96) *
11 to 12 hours 0 (Reference) 0 (Reference)
Sleep duration in P3
≤8 hours 0.27 (-0.07, 0.60) 0.11 (-0.31, 0.52)
>8 to <10 hours 0.08 (-0.19, 0.35) 0.14 (-0.20, 0.48)
≥10 hours 0 (Reference) 0 (Reference)
Days with regular sleep pattern in P3
0–3 days/week 0.32 (-0.17, 0.80) 0.64 ( 0.13, 1.14) *
4–5 days/week 0.25 (-0.23, 0.72) 0.49 ( 0.01, 0.96) *
6–7 days/week 0 (Reference) 0 (Reference)
Days with good quality sleep in P3
0–3 days/week 0.39 ( 0.09, 0.69) * 0.32 (-0.05, 0.69)
62

Longitudinal Association between Sleep and Risk of Mental Disorder
63

Risk of mental disorder and sleep deprivation in K3
64
Adjusted for baseline SES, gender, and socio-emotional development at K3
Potential mental disorder screened using SDQ with 53% sensitivity and 89% specificity against clinical diagnosis

Risk of mental disorder and sleep deprivation in P3
65
Adjusted for baseline SES, gender, and socio-emotional development at K3
Potential mental disorder screened using SDQ with 53% sensitivity and 89% specificity against clinical diagnosis

Subdomain problems
66
β (95% CI) P β (95% CI) P β (95% CI) P β (95% CI) P β (95% CI) P
Sleep duration in K3
<8 hours/day 4.60 (1.19, 17.82) * 3.26 (0.72, 14.70) 4.44 (1.10, 17.90) * 1.99 (0.54, 7.43) 4.36 (1.11, 17.10) *
8 to < 9 hours/day 2.78 (0.89, 8.65) 1.97 (0.58, 6.63) 1.65 (0.48, 5.65) 1.35 (0.51, 3.57) 2.31 (0.72, 7.41)
9 to <11 hours/day 3.37 (1.19, 9.59) * 1.70 (0.56, 5.15) 2.08 (0.70, 6.16) 1.35 (0.58, 3.17) 1.95 (0.66, 5.71)
11 to 12 hours/day 1 (Reference) 1 (Reference) 1 (Reference) 1 (Reference) 1 (Reference)
Sleep duration in P3
≤8 hours/day 1.89 (1.10, 3.26) * 1.20 (0.55, 2.61) 1.79 (0.92, 3.50) 1.89 (1.02, 3.50) * 1.57 (0.74, 3.34)
>8 to <10 hours/day 1.47 (0.90, 2.39) 1.51 (0.81, 2.79) 1.30 (0.72, 2.37) 1.21 (0.69, 2.13) 1.91 (1.04, 3.53) *
≥10 hours/day 1 (Reference) 1 (Reference) 1 (Reference) 1 (Reference) 1 (Reference)
Regular sleep pattern in P3
0-3 days/week 3.19 (1.10, 9.27) * 2.20 (0.71, 6.77) 1.89 (0.61, 5.83) 6.60 (1.10, 39.55) * 3.01 (0.79, 11.38)
4-5 days/week 2.87 (1.00, 8.19) 1.14 (0.36, 3.56) 1.56 (0.51, 4.75) 5.73 (0.96, 34.08) 2.10 (0.56, 7.92)
6-7 days/week 1 (Reference) 1 (Reference) 1 (Reference) 1 (Reference) 1 (Reference)
Good quality sleep in P3
0-3 days/week 1.07 (0.67, 1.71) 2.75 (1.46, 5.18) ** 3.53 (1.83, 6.81) *** 2.33 (1.35, 4.01) ** 2.51 (1.43, 4.40) **
4-5 days/week 0.94 (0.59, 1.48) 1.43 (0.72, 2.87) 2.21 (1.12, 4.38) * 1.29 (0.71, 2.34) 0.97 (0.49, 1.91)
6-7 days/week 1 (Reference) 1 (Reference) 1 (Reference) 1 (Reference) 1 (Reference)
Prosocial Peer problems Emotional problems Conduct problems Hyperactivity

Mental well-being and sleep deprivation in K3
67
Adjusted for baseline SES, gender, and early childhood socio-emotional development at K3

Prosocial, internalising, and externalising behaviours
68
β (95% CI) P β (95% CI) P β (95% CI) P
Sleep duration in K3
<9 hours/day -1.10 (-1.88, -0.33) ** 1.48 ( 0.22, 2.73) * 1.23 (-0.13, 2.58)
9 to <11 hours/day -0.89 (-1.54, -0.24) ** 1.08 ( 0.01, 2.16) * 0.66 (-0.50, 1.81)
11 to 12 hours/day 0 (Reference) 0 (Reference) 0 (Reference)
Sleep duration in P3
≤8 hours/day -0.95 (-1.50, -0.39) *** 0.74 (-0.18, 1.65) 1.43 ( 0.44, 2.41) **
>8 to <10 hours/day -0.48 (-0.93, -0.02) * -0.09 (-0.83, 0.66) 0.54 (-0.26, 1.34)
≥10 hours/day 0 (Reference) 0 (Reference) 0 (Reference)
Regular sleep pattern in P3
0-3 days/week -0.74 (-1.47, -0.01) * 1.27 ( 0.10, 2.45) * 2.24 ( 0.96, 3.52) ***
4-5 days/week -0.50 (-1.21, 0.20) 0.11 (-1.01, 1.24) 1.61 ( 0.38, 2.84) *
6-7 days/week 0 (Reference) 0 (Reference) 0 (Reference)
Good quality sleep in P3
0-3 days/week -0.44 (-0.95, 0.06) 1.92 ( 1.12, 2.72) *** 1.99 ( 1.13, 2.85) ***
4-5 days/week -0.07 (-0.54, 0.39) 1.11 ( 0.38, 1.85) ** 0.36 (-0.44, 1.15)
6-7 days/week 0 (Reference) 0 (Reference) 0 (Reference)
Prosocial behaviors Internalising behaviours Externalising behaviours
Adjusted for baseline SES, gender, and early childhood socio-emotional development at K3

Summary
• Sleep deprivation in early childhood (~5 years) is a prominent risk factor for early child development • Lowered school readiness
• More symptoms in inattention and hyperactivity
• Less prosocial behaviour
• Even more alarming is the potential impact in middle childhood (~9 years) • Elevated risk in ADHD
• Poorer mental health
• Less prosocial behaviour
69

Ownership of Electronic Devices – Hong Kong Children (Preschool K3)
70

Time spent on Electronic Devices
71

ED in bedroom and School Readiness
Any ED in bedroom
β (95% CI) P
Physical -0.12 (-0.26, 0.01)
Social -0.29 (-0.50, -0.08) **
Emotional -0.19 (-0.35, -0.03) *
Language / Cognitive -0.24 (-0.39, -0.10) **
Communication / General -0.26 (-0.50, -0.03) *
Total -1.11 (-1.80, -0.42) **
72

Effect of Electronic Device in bedroom influenced by SES
73

Effect of ED in bedroom influenced by parental mediation
74

The Gap Between the Rich and the Poor -
From School Readiness to School Success
Longitudinal study
(CEDI Cohort)
75
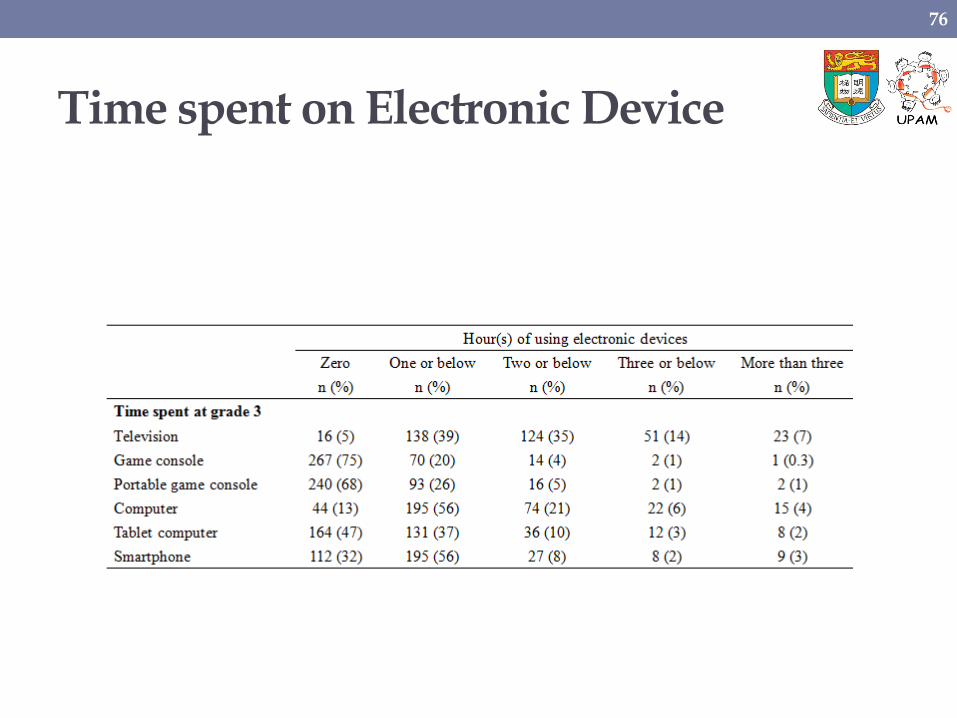
Time spent on Electronic Device
76

Academic performance and ED
77
Adjusted for baseline SES, age, and gender
ED placed in bedroom and time spent on ED

SES and time spent on ED
78

Time spent on ED and academic performance
79

Academic performance and ED
80
Adjusted for baseline SES, age, and gender
Parental mediation

Academic performance and parental mediation
81

Psychosocial wellbeing and ED
82

Physical activity in preschool improves ADHD risk in middle childhood
83
Adjusted for gender and family SES

Physical activity in preschool improves Psychosocial well-being in middle childhood
84
-0.6
-0.4
-0.2
0
0.2
0.4
0.6
Re
lati
ve
z-s
co
re
Parent-child Physical Activity (Time/week)
Conduct problems Peer problems Prosocial behaviours
0-2 3-4 >4 0-2 3-4 >4 0-2 3-4 >4
Adjusted for gender and family SES

The Gap Between the Rich and the Poor -
From School Readiness to School Success
Longitudinal study
(CEDI Cohort)
85

Cohort studies
Pros
• Reverse causation unlikely (compared to cross-sectional study)
• Ethical issues unlikely (compared to RCT)
86
Well-designed cohort studies are regarded as the most rigourous and useful among observational studies.
Gordis, L. (2009). Epidemiology (4th Ed.). Philadelphia: Saunders.

Objectives
• To study the existence and magnitude of the socioeconomic gap in school success (academic achievement and psychosocial outcomes) in primary school (P3)
• To study the extent to which the school readiness of preschoolers (K3) predicts their school success in P3
87

Objectives
• To examine the extent to which the socioeconomic gap observed in K3 is attenuated or intensified during formal schooling
• To investigate the dynamic of changes in gaps at the two time points in relation to family process related factors (e.g., parenting styles and the home learning environment)
88

First study in Hong Kong to provide longitudinal data on: (i) the link between school readiness at kindergarten and academic success in primary school; (ii) the changes in achievement gap between the rich and poor
89

Academic Performance by District
Hong Kong Island Yuen Long Comparison
Mean SD Mean SD Difference p
Mathematics Total 92.4 4.9 81.3 16.6 11.1 <0.001
Chinese Total 82.5 8.9 71.3 17.8 11.2 <0.001 Reading 87.2 10.8 80.0 16.6 7.2 0.013
Writing 80.4 9.9 67.5 20.2 12.9 <0.001
0
10
20
30
40
50
60
70
80
90
100
Mathematics Total
Chinese Total Reading Writing
Hong Kong Island
Yuen Long
90

Academic Performance by Family SES
p<0.0001 p<0.0001
Family SES index = composite index of family income,
paternal/maternal occupation and education
91

Psychosocial wellbeing by Family SES
92
P=0.0008

The widening socioeconomic gap in
Cognitive Performance
93

The consistent socioeconomic gap in
Psychosocial Development
94

Mechanism of longitudinal cognitive disparity
95
Low SES Cognitive function
Early prolonged exposure to ED
Learning Environment
+
-
-
+

Optimal Learning Environment
• An optimal learning environment not just include academic tutorials, but also: • Reading extra-curricular books
• Playing musical instruments
• Visiting museums
• Freeplay in park/playground
• Outdoor activities, etc.
• Parental activities: reading together, discussing school matters, etc.
• Overemphasis of academic performance does not lead to a better academic performance
96

Mechanism of longitudinal psychosocial disparity
97
K3 SES Cognitive function
Early prolonged exposure to ED
Authoritarian parenting
Sleep quality
Regular sleep pattern
Physical activity
+ -
+ -
- +
- +
- +
Authoritative parenting - +

Two traits of parenting styles for Chinese
• Authoritarian (專制) • Authoritarian parents value obedience, favour punitive and
forceful measures, believe children should accept their parents’ word for what is right, and do not encourage verbal give and take (Baumrind, 1989).
• Authoritative (權威) • Authoritative parents (Baumrind, 1971, 1989, 1996) attempt to
direct children’s activities in a rational, issue-oriented manner. They reason with their children, facilitate verbal give and take (Baumrind, 1989), and encourage children to think independently and to respond in prosocial ways (Baumrind, 1996).
98
Wu et al (2002)

Authoritarian parenting and child development
Academic performance Psychosocial well-being
99
P=0.02 P<0.001
Adjusted for family SES

Authoritative parenting and child development
Academic performance Psychosocial well-being
100
P=0.52 P=0.004
Adjusted for family SES

Summary
• Both neuroscience and epidemiological studies tell us the importance of parenting, particularly in early childhood
• Both parenting style (positive & non-authoritarian) and parent-child activities (recreation & multi-exposure) are essential for academic performance and psychosocial well-being
• Parents need to be cautious of other behavioural risk factors: • Early exposure of electronic devices
• Sleep deprivation
101

Inter-discipline
Collaboration
Parents
HA MCHC
Child
Development
School
Community
Health
DH
102