1 nitrogen in the environment david gay 1 & bob hall 2 1 nadp program office, [email protected], ,...
TRANSCRIPT
1
Nitrogen in the Environment
David Gay1 & Bob Hall2
1 NADP Program Office, [email protected], http://nadp.sws.uiuc.edu, (217) 244-0462
2 U.S. Environmental Protection Agency, Region 9, San Francisco, CA
2
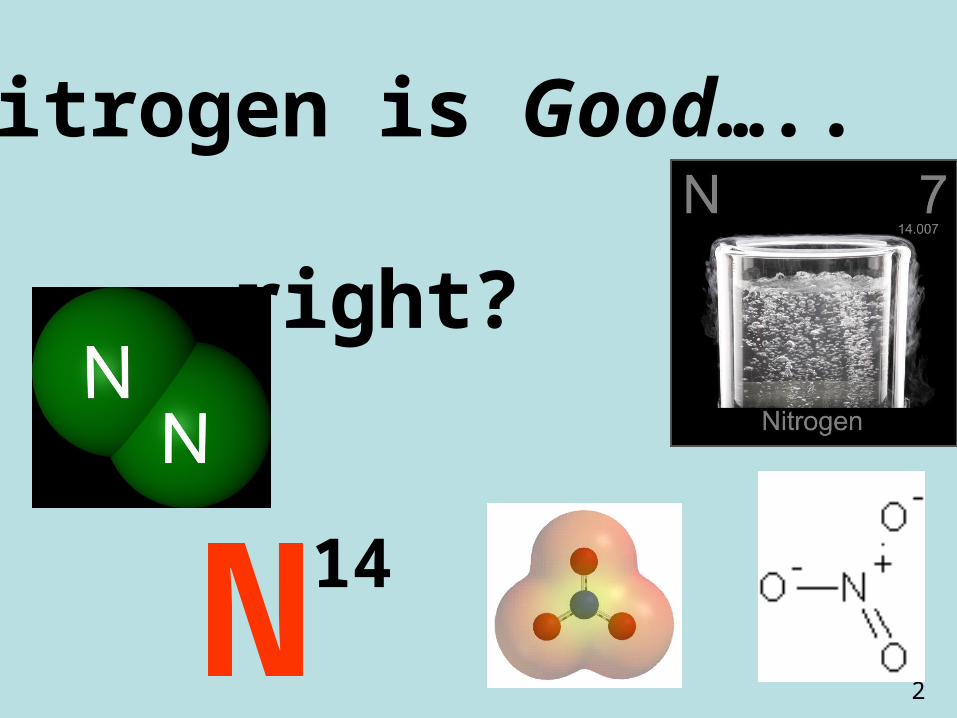
Nitrogen is Good…..
right?
N14
3
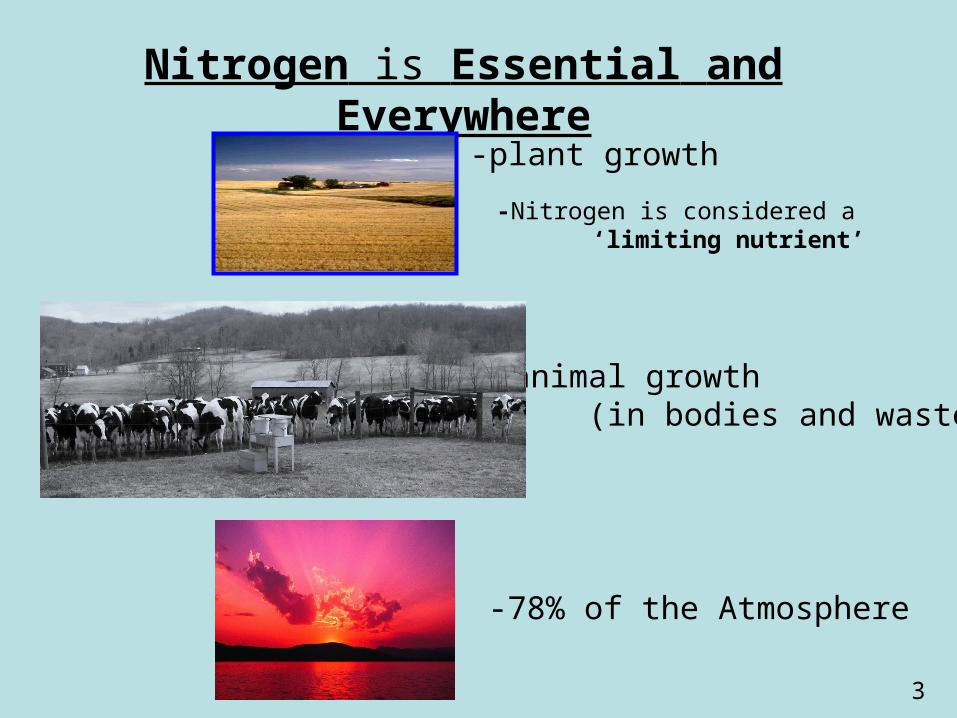
-Nitrogen is considered a ‘limiting nutrient’
-plant growth
-animal growth (in bodies and waste)
-78% of the Atmosphere
Nitrogen is Essential and Everywhere
4
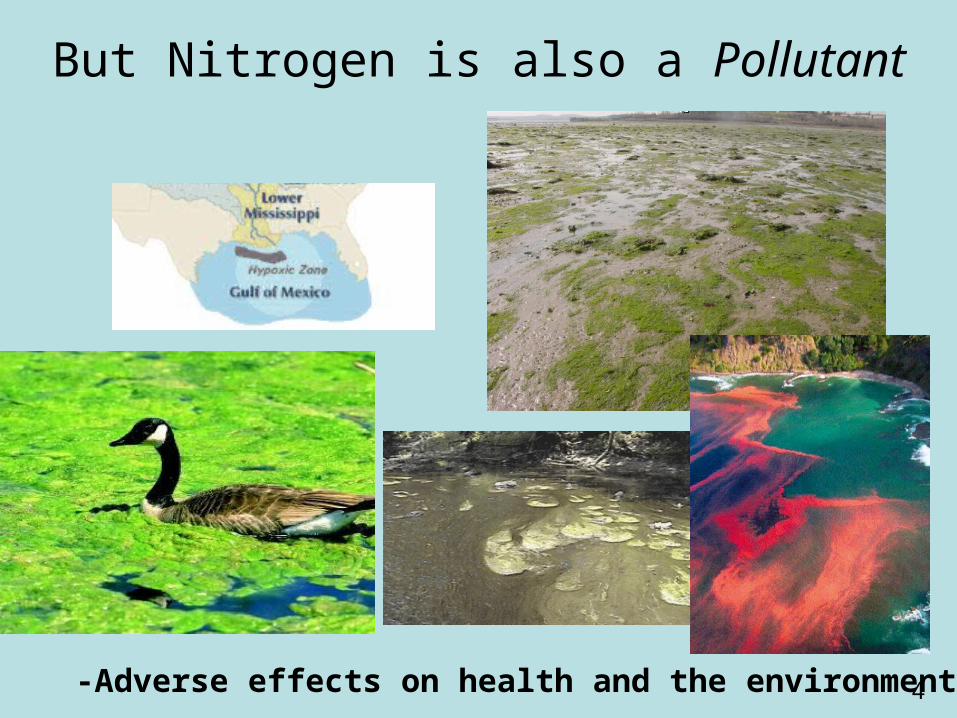
But Nitrogen is also a Pollutant
-Adverse effects on health and the environment
5
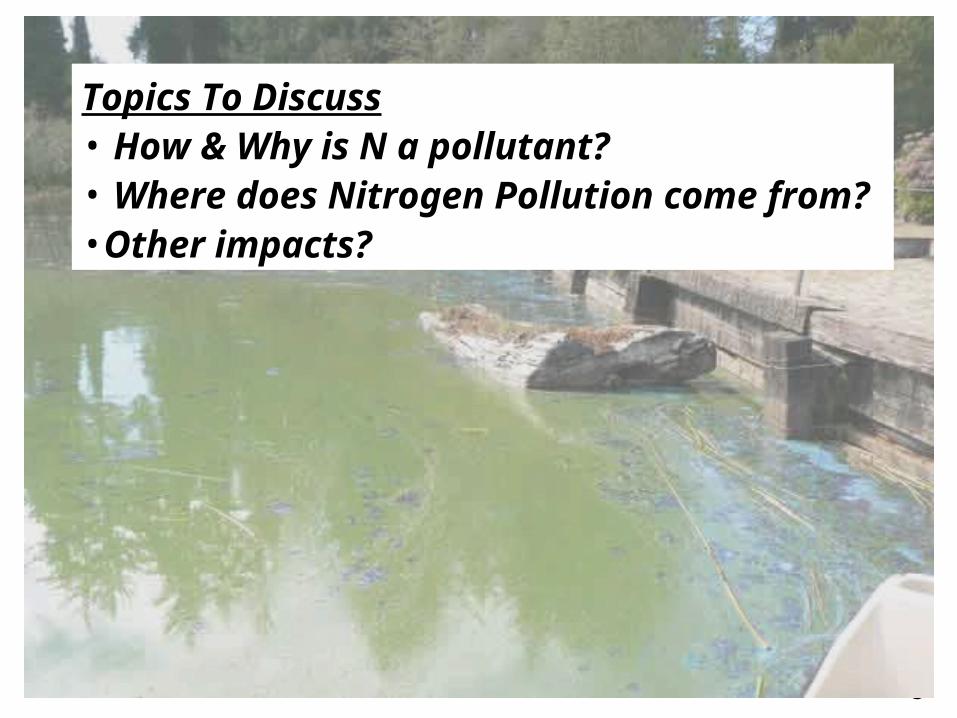
Topics To Discuss• How & Why is N a pollutant?• Where does Nitrogen Pollution come from?•Other impacts?

6
How and Why is Nitrogen a Pollutant?
• Nitrogen is limited
• Adding N is adding “fertilizer”
• Makes things grow (algal blooms, red tide, etc.)
• These live thinks die, and consume oxygen
• O2 breathing life then die

7
Add Nitrogen to lake or Ocean…

8
Eutrophication
is the term used to describe these responses to nutrient (N) over-enrichment
9
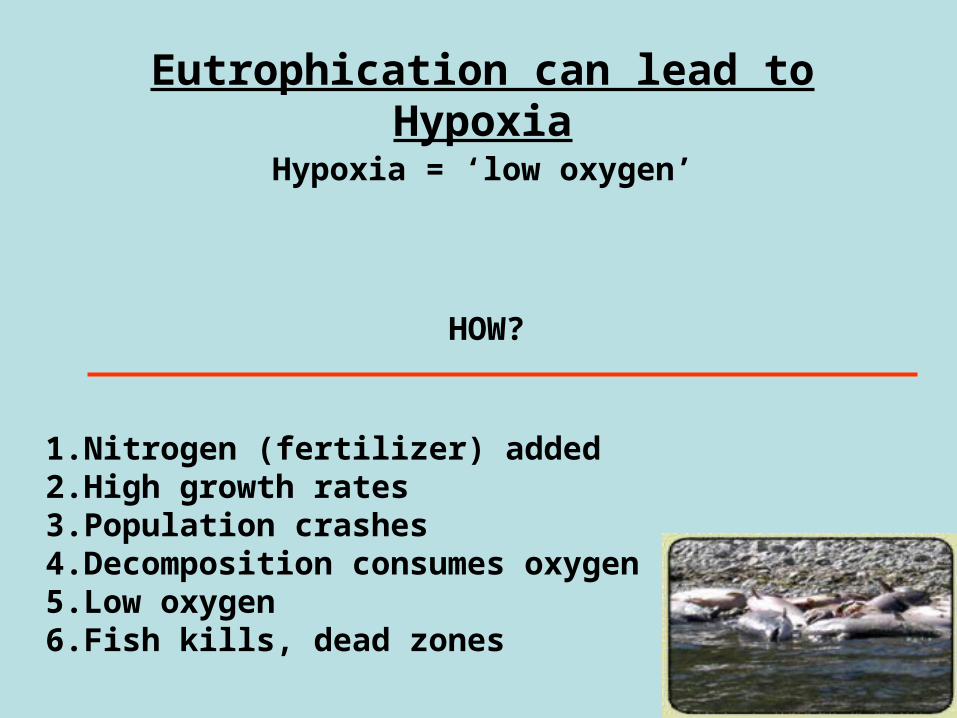
Eutrophication can lead to Hypoxia
Hypoxia = ‘low oxygen’
HOW?
1. Nitrogen (fertilizer) added2. High growth rates3. Population crashes4. Decomposition consumes oxygen5. Low oxygen 6. Fish kills, dead zones

10
Dead Zones
Red = high N fertilizers

11
Add Nitrogen to the Atmosphere?
• All nitrogen is ultimately oxidized (N2?)
• Result HNO3 (Nitric Acid)
• “Acid Rain, snow and fog”
NO2 + OH∙ + M ↔ HNO3 + M
HNO3 + H2O ↔ H+ + NO3-
12
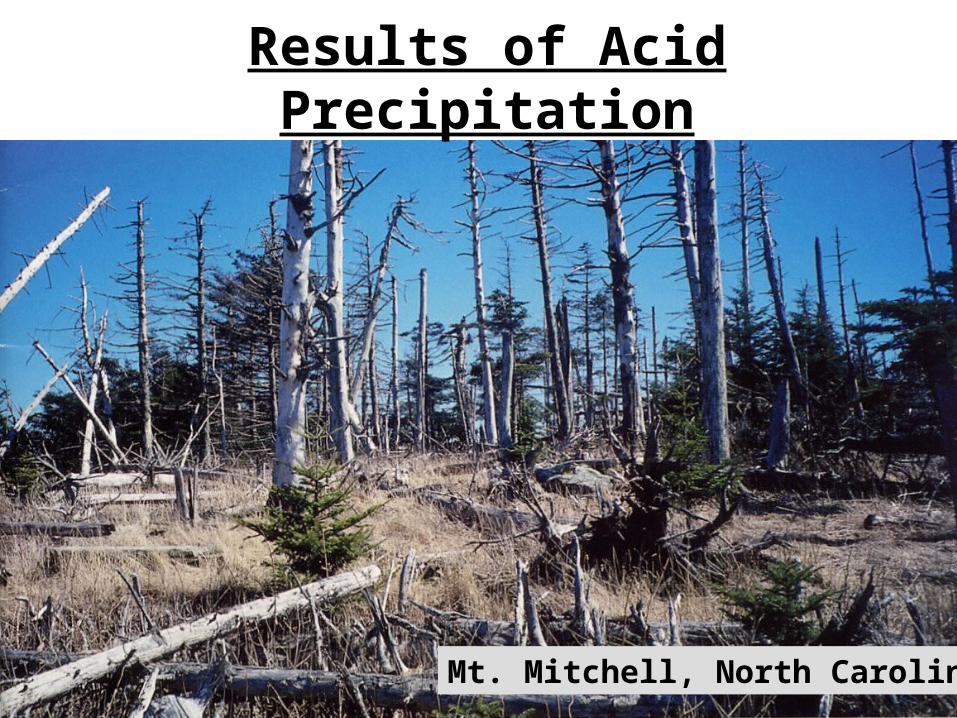
Results of Acid Precipitation
Mt. Mitchell, North Carolina
13
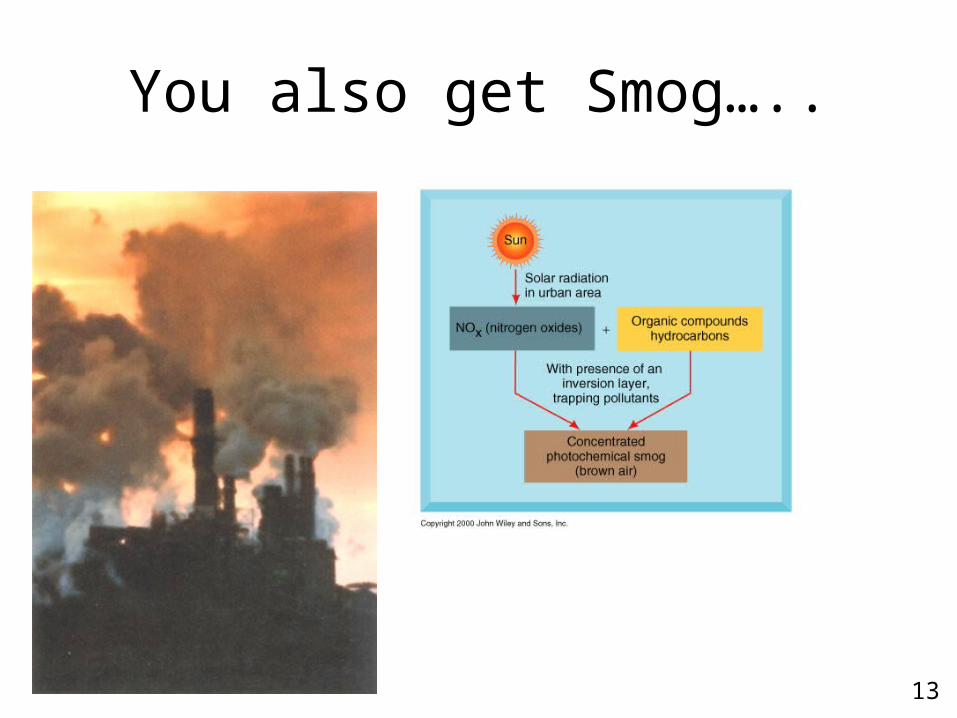
You also get Smog…..
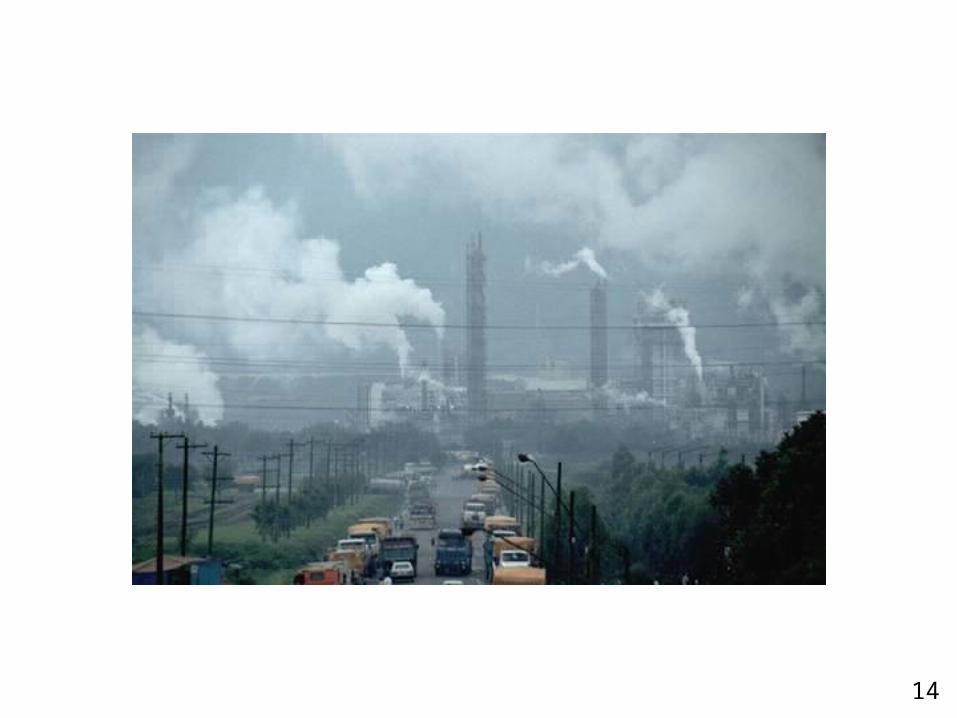
14
15
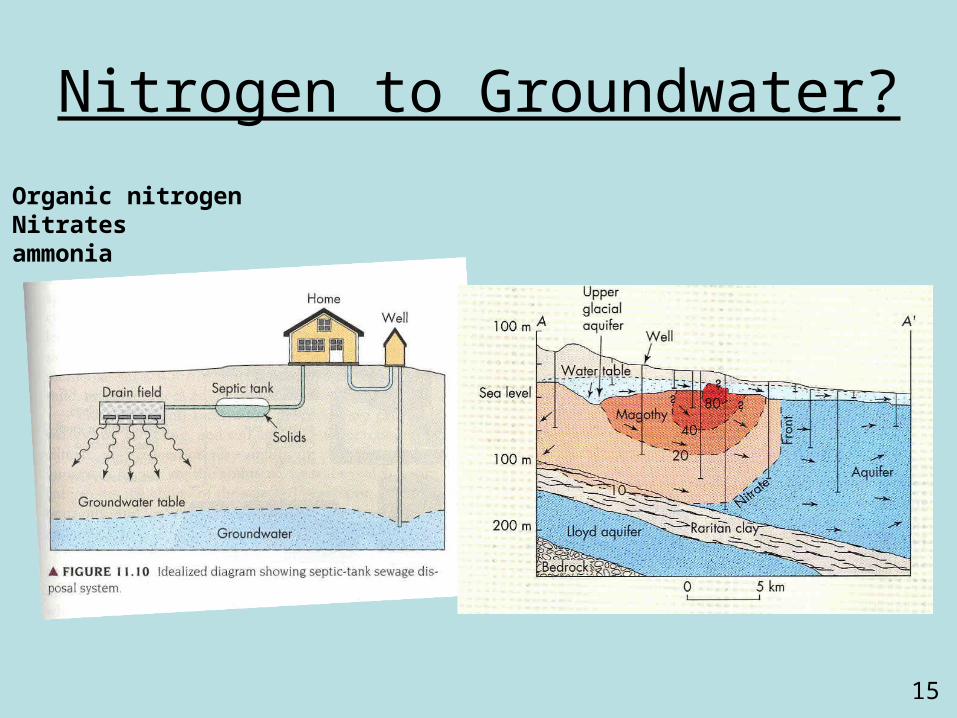
Nitrogen to Groundwater?
Organic nitrogenNitratesammonia
16
So………
Where does Nitrogen Pollution Come From?

17
Nitrogen comes in Lots of Forms
Nitrogen gas
Compound Reactivity Mobility Misc.ChemicalFormula
N2 Not very Very
Nitrate NO3 Moderately Very
Organic N lots depends depends
Fertilizer, combustion, explosives
Example: Urea
Ammonia (gas)
NH3 Very ModeratelyProduct of HB, Fert

18
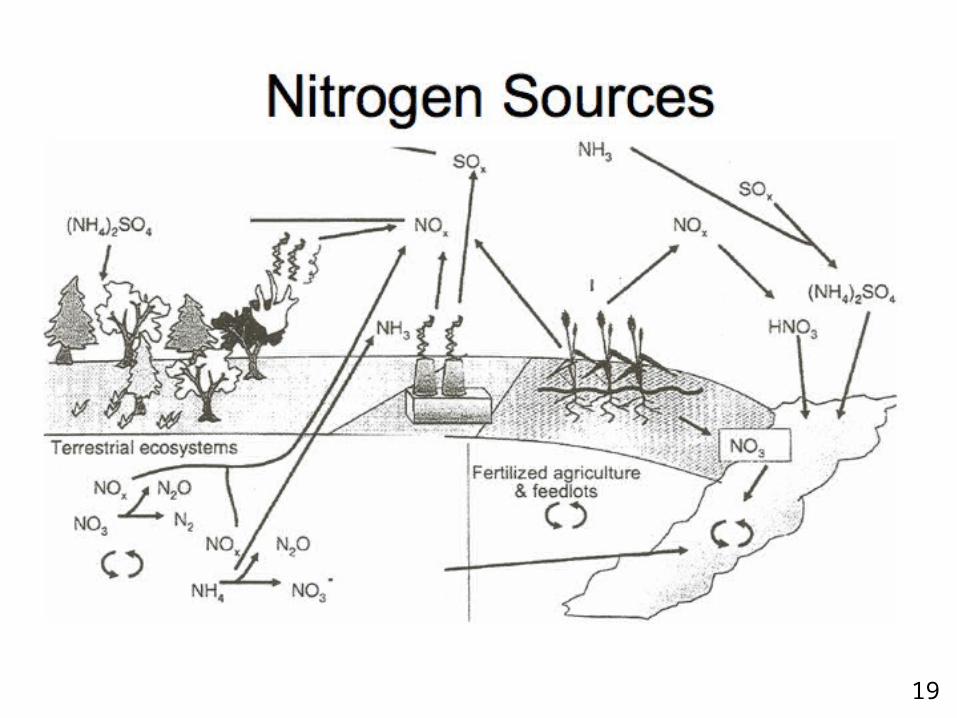
Nitrogen is Moving Around the Environment
• Denitrification in Soil– Bacteria change NO3 in the soil to atmospheric N2.
• Volatilization from Soil– urea fertilizers and manures on the soil surface converts to
atmospheric NH3.
• Runoff over Soil– Carries the N fertilizers and manure into rivers and
streams; water quality concerns.
• Leaching from Soil– Carries NO3s down past where plants can use, into
groundwater
19

20
Nitrogen Cycle

21
Sources of Nitrogento the Atmosphere
Burning(oxidized nitrogen, particularly) Animals
(ammonia)

22
Hog Production in USA(1 dot= 10,000 Hogs and Pigs)
23
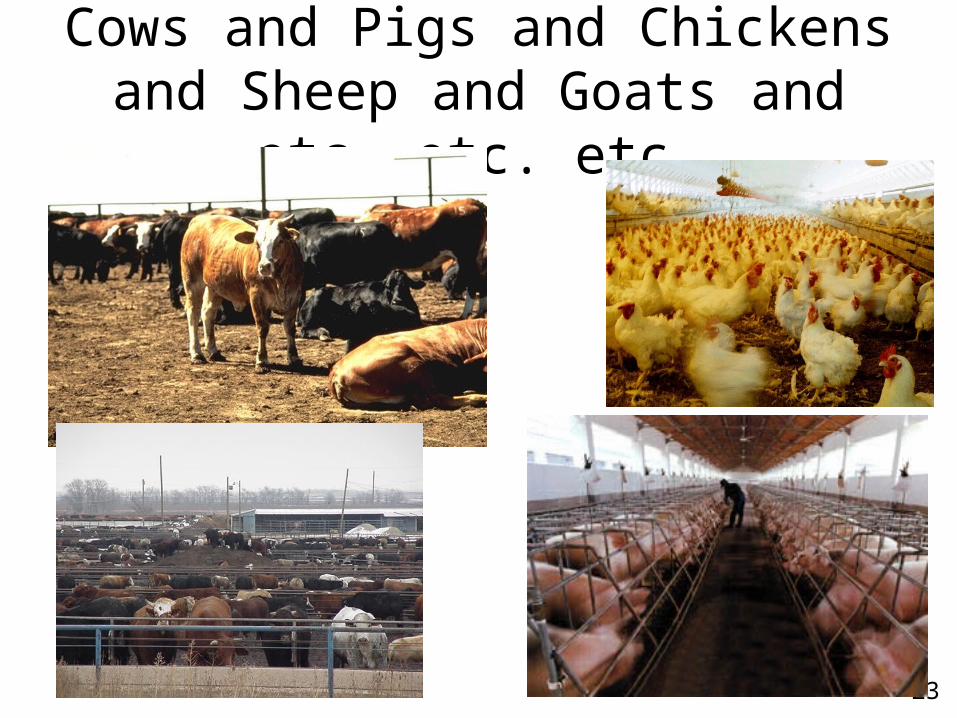
Cows and Pigs and Chickens and Sheep and Goats and etc.
etc. etc.
24
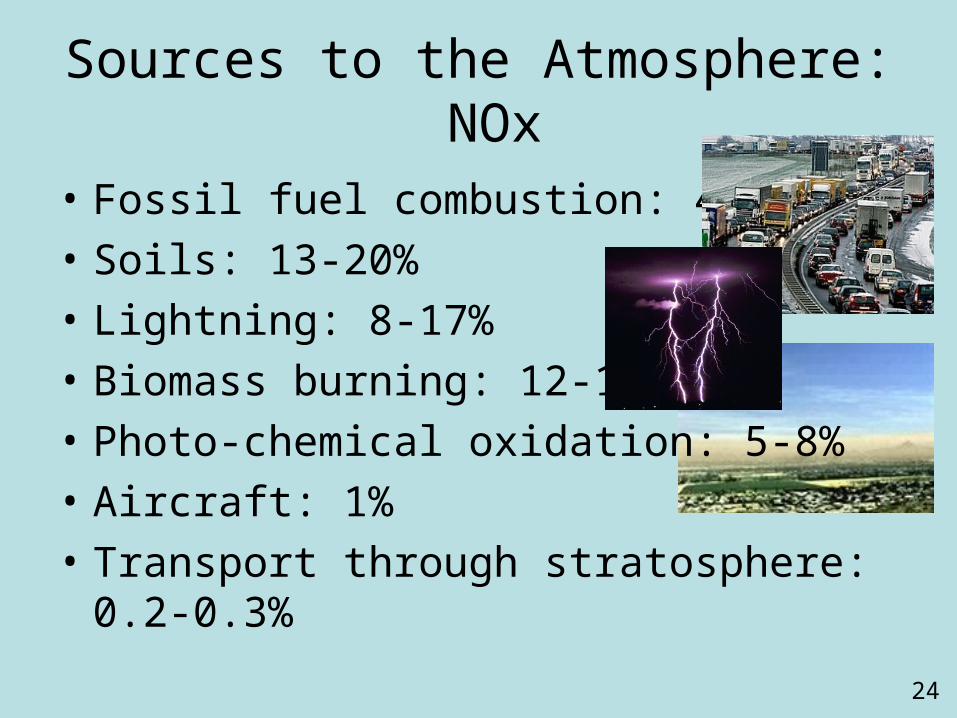
Sources to the Atmosphere: NOx
• Fossil fuel combustion: 40-58%• Soils: 13-20%• Lightning: 8-17%• Biomass burning: 12-17%• Photo-chemical oxidation: 5-8%• Aircraft: 1%• Transport through stratosphere: 0.2-
0.3%
25
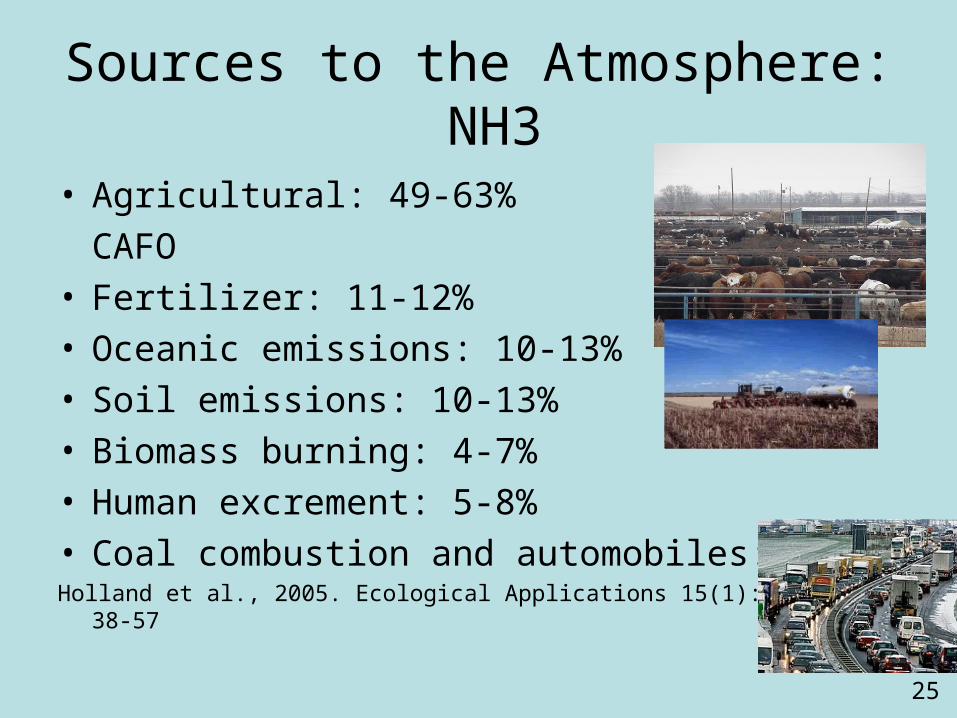
• Agricultural: 49-63%CAFO
• Fertilizer: 11-12%• Oceanic emissions: 10-13%• Soil emissions: 10-13%• Biomass burning: 4-7%• Human excrement: 5-8%• Coal combustion and automobiles:3-4%Holland et al., 2005. Ecological Applications 15(1): 2005, pp 38-57
Sources to the Atmosphere: NH3
26
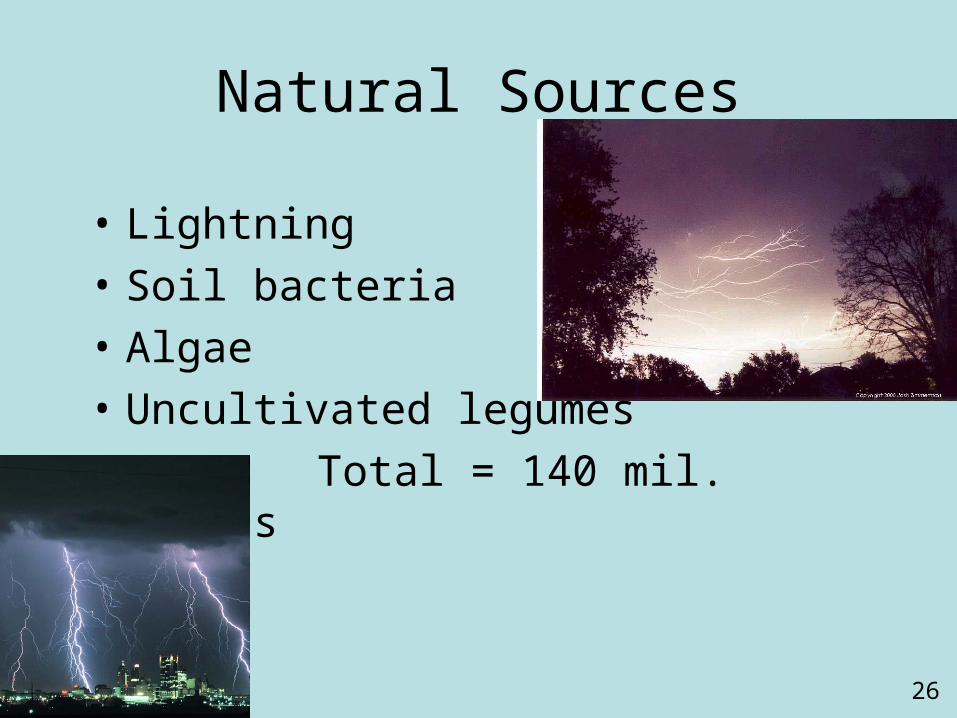
Natural Sources
• Lightning• Soil bacteria• Algae• Uncultivated legumes
Total = 140 mil. M.tons

27
Fertilizers
• Soil bacteria fix atmospheric nitrogen – N2 gas to reactive forms in the soil)
• Haber Process (fertilizer production) is the same thing; – artificial nitrogen fixation

28
The Fate of Reactive Nitrogen
N Fertilizer Produced
N Fertilizer Applied
N in Crop
N In Feed
Nin Store
NConsumed
-6 -47 -3
100 44794 731
-24-16
Only 4% of the reative N produced in the Haber-Bosch process and used for animal production enters the human mouth.
Galloway JN and Cowling EB. 2002Galloway 2002
The rest ( 96%) escapes into air, soil, surface water (rivers, streams)and groundwater (aquifers) and cascades towards the oceans
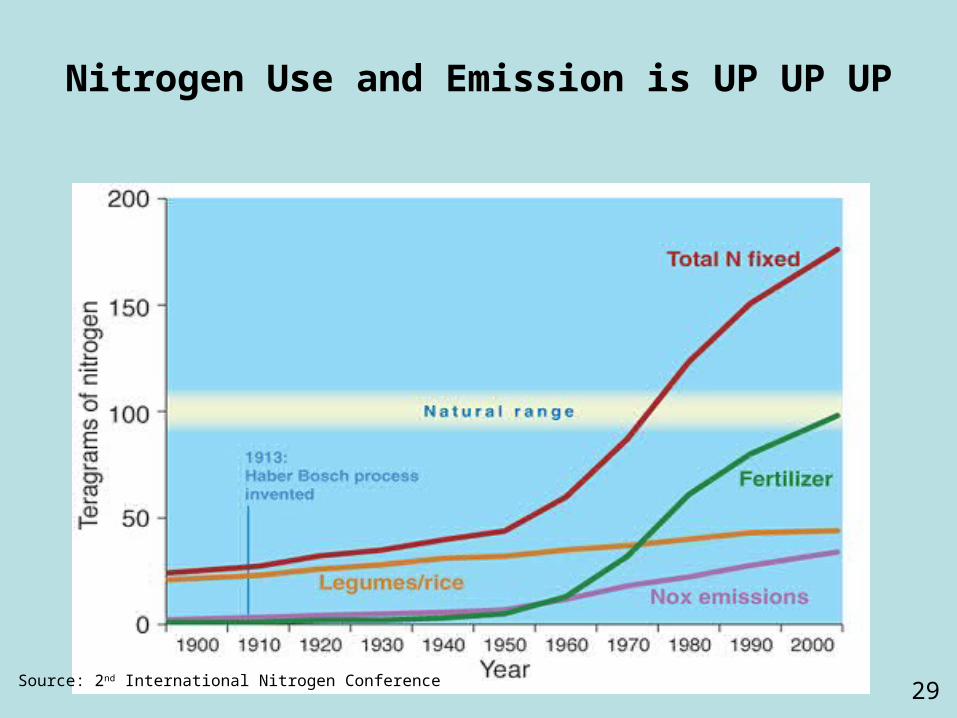
29Source: 2nd International Nitrogen Conference
Nitrogen Use and Emission is UP UP UP
30
Deposition Is Also Increasing(N into Ecosystems)

31
Inorganic Nitrogen Wet Deposition, 2007
32
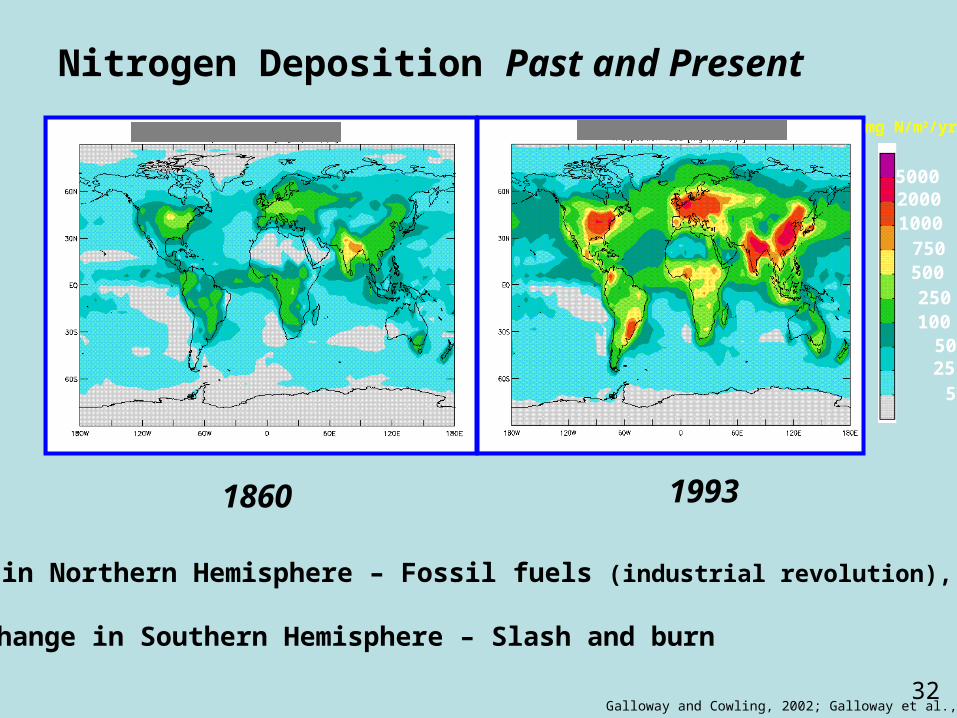
Nitrogen Deposition Past and Present
Galloway and Cowling, 2002; Galloway et al., 2002b
1860 1993
500020001000 750 500 250 100 50 25 5
mg N/m2/yr
-Change in Northern Hemisphere – Fossil fuels (industrial revolution), and ag
-Change in Southern Hemisphere – Slash and burn
33
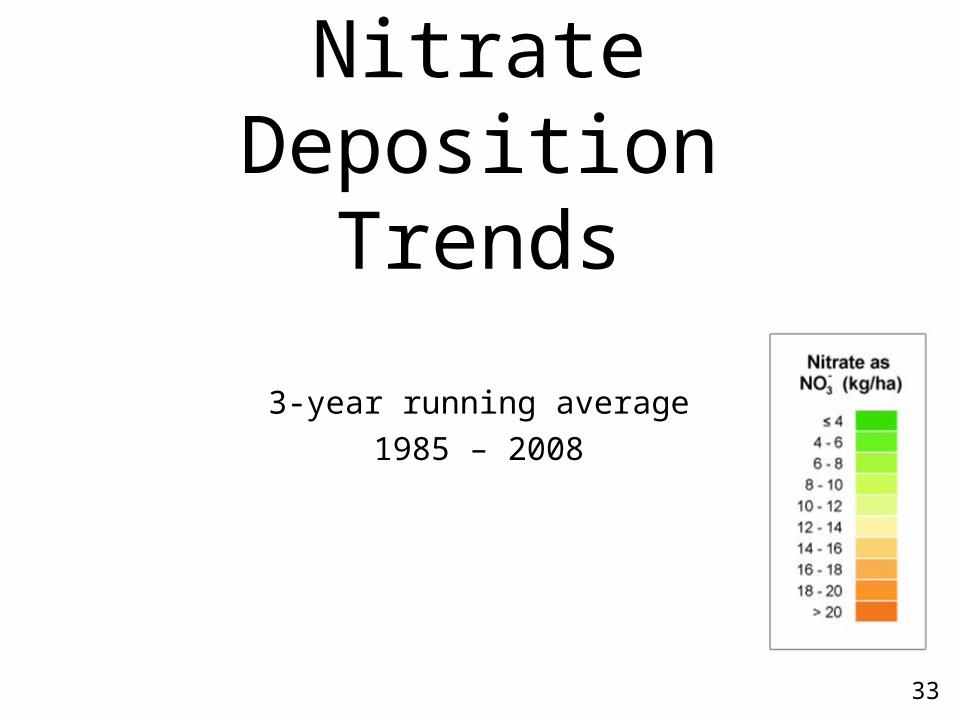
Nitrate Deposition Trends
3-year running average1985 – 2008

34
Animation

35
INCREASING
Trend
DECREASING
TrendNumber of
SitesNumber
SignificantNumber of Sites Number
Significant
29 9 122 92
Nitrate Trend in Precipitation1985-2009
Trends Emissions Concentration
-37% -22%
36
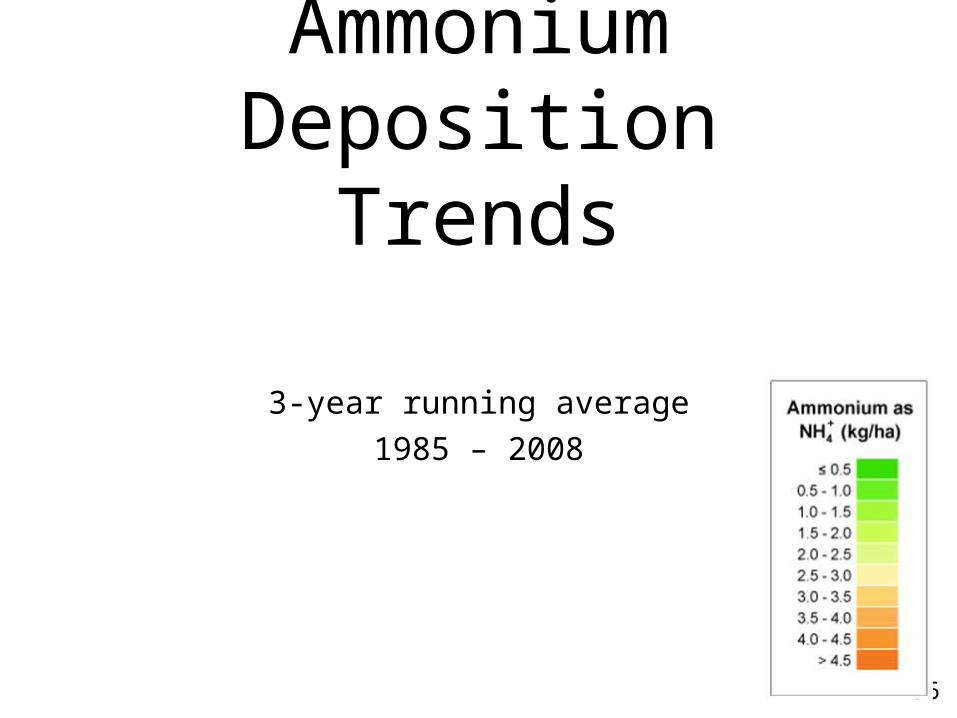
Ammonium Deposition Trends
3-year running average1985 – 2008

37
Animation
38
Nitrogen in the Environment
David Gay1 & Bob Hall2
1 NADP Program Office, [email protected], http://nadp.sws.uiuc.edu, (217) 244-0462
2 U.S. Environmental Protection Agency, Region 9, San Francisco, CA