1 oasis: a mobile cyber-physical system for accessible
TRANSCRIPT

1
Oasis: A Mobile Cyber-Physical System forAccessible Location Exploration
Chih-Chuan Cheng, Pi-Cheng Hsiu, Senior Member, IEEE, Ting-Kuei Hu, and Tei-Wei Kuo, Fellow, IEEE
F
Abstract—Users roaming cellular signal coverage with their mobiledevices essentially form a mobile cyber-physical system (CPS). Bymodeling cyber human mentality and physical signal coverage, as wellas their interplay, user mobility can be leveraged to improve users’mobile experience with limited wireless bandwidth. Through a real-worldcase study, we observed that numerous “null zones” and “hot zones”exist in cellular signal coverage areas, where mobile devices cannotobtain sufficiently high data rates for delay-sensitive applications. Overone-third of the locations in a crowded area could have weak signal cov-erage and low bandwidth shares, resulting in poor mobile connectivityexperience. This paper considers the practicality of a mobile CPS calledOasis, which guides users to leave those zones and move to nearbylocations with better mobile experience. To realize the system, we modeland maximize a user’s willingness to travel to another location, where thewillingness involves the compound impact of the travel distance and theimproved perceptual quality. We also develop a prototype system thatcreates a feedback control loop to allow self-adaptation to users’ needs.To evaluate the efficacy, we conducted a series of experiments basedon the real data collected in downtown Taipei. The results demonstratethat our mobile CPS can further reduce the average distance per unit ofquality improvement achieved with OpenSignalMaps by about 80%, andmotivate further research.
Index Terms—Mobile experience, user willingness, cellular signals,delay-sensitive applications, human-in-the-loop, cyber-physical systems
1 INTRODUCTION
Mobile cyber-physical systems (CPSs) exploit mobile sensingand computing devices tightly connected via communi-cation networks to augment human interaction with thephysical world. When a mobile user is using an application,his reaction and the application status are captured by themobile device equipped with some sensing or measurementmodules, and the captured measurements are conveyed to acloud server that then analyzes the quality of the applicationin service provisioning. The analytical results, along withconcurrent physical conditions, are used to adjust subse-quent operations. A mobile CPS can have an internal controlloop that exploits human feedback to make the serviceself-adaptable and more personalized. Mobile CPSs haverecently enabled emerging applications to tackle societal
• C.-C. Cheng, P.-C. Hsiu, and T.-K. Hu are with the Research Center forInformation Technology Innovation, Academia Sinica, Taipei 115, Taiwan.E-mail: {charleycheng, pchsiu, tkhu}@citi.sinica.edu.tw
• T.-W. Kuo is with the Department of Computer Science and InformationEngineering, National Taiwan University, Taipei 106, Taiwan. E-mail:[email protected].
problems, such as dynamic vehicle balancing [20], last-miletransit planning [30], and driving speed advisory [31].
Mobile device users roaming in a cellular signal cover-age area provide an ideal infrastructure of a mobile CPS.In cellular systems, insufficient bandwidth is a persistentproblem for delay-sensitive mobile applications [19], as newcommunication technologies often spark previously unfore-seeable mobile applications, and vice versa. The problemis complex due to user mobility [28]. Modeling and under-standing cyber-physical interactions between user percep-tion and signal coverage could facilitate the empirical designof a mobile CPS which leverages user mobility to improveusers’ mobile experience given limited wireless bandwidth.Specifically, when a mobile application cannot be executedsmoothly due to a lack of bandwidth at a location, themobile CPS allows for the visualization of surroundingsignal strengths and helps the user find nearby locationswith perceptually improved quality of the used application.
To this end, we conducted a case study in a crowdedarea covered by cellular signals in downtown Taipei, andobserved that the ISP only deployed enough base stations tohandle normal traffic levels because of cost considerations.However, the deployment leads to “null zones” with ex-tremely weak signals and cannot satisfy the demand of “hotzones” where numerous users share the limited bandwidthsimultaneously. Our statistical results show that nearly halfthe area is covered by such null and hot zones. As aresult, there was a 60-70% chance that an HSDPA-enabledsmartphone could not obtain a sufficient data rate for videostreaming, and about a 20% chance that it could not browsewebsites smoothly. For an HSPA+-enabled tablet tested inthe same experiments, the chances were 20-30% and 4-7%respectively.
Motivated by the above results, we propose a mobileCPS called Oasis, which guides users to move from thosezones to nearby locations that have sufficient bandwidth.Oasis exploration could be realized as a value-added serviceoffered by Internet service providers (ISPs) because theyusually maintain signal coverage maps and monitor radioresource usage for network planning, e.g., capacity andcoverage optimization [12]. They could further exploit thecollected information to provide the service, and therebyimprove users’ mobile experience while reducing their owndeployment costs. However, offering the service raises sev-eral challenges in modeling cyber human mentality andphysical signal coverage, as well as their interactions. Thefirst is how to model a user’s satisfaction with an applicationat different locations. Another challenge is how to quantify
2
and maximize a user’s willingness to travel to a location.This is particularly difficult because the willingness involvesthe compound impact of the travel distance and the improvedperceptual quality, as well as depends on the applicationbeing used. Finally, it is also challenging to present theservice in a way that is intuitive and requires minimumuser intervention. Meanwhile, the service should be self-adaptive to fit each user’s needs because subscribers mayhave different preferences, e.g., shorter travel distances orbetter perceptual quality.
In this paper, we posit the practicality of the mobile CPSto provide the oasis exploration service. Our contributionsare as follows. First, we formulate the underlying problemof the service that requires accounting for the role of humansin the loop. Specifically, we link a user’s satisfaction withan application’s perceptual quality in different locations,and quantify the user’s willingness to travel to differentlocations in exchange for better perceptual quality. Then,we solve the underlying problem, which involves findingan accessible location that maximizes the user’s willingness.Next, we describe the prototype mobile CPS that we builtto realize the service1. The system, which is comprised of anonline server and an Android mobile app, creates a feedbackcontrol loop to allow self-adaptation. Further, we conducteda series of experiments based on the real data collected indowntown Taipei. The results demonstrate that the servicecan capture users’ travel intentions, and gradually convergetoward users’ needs. We observed that a subscriber usingan HTC smartphone or ASUS tablet can usually gain asignificant improvement in perceptual quality as a trade-offfor traveling a reasonable distance. The average distance perunit of quality improvement is only one-fifth that requiredby an approach motivated by OpenSignalMaps. Our exper-iments showed that the oasis exploration service is practica-ble. Finally, based on the experience learned from this study,we identify issues which require further investigation anddiscuss possible extensions for future research.
The remainder of this paper is organized as follows.Section 2 describes the case study we conducted in Taipei. InSection 3, we formulate and solve the underlying problem.Section 4 presents the implementation of the prototypesystem. The experiment results are reported in Section 5.Section 6 discusses the limitations of our work and futureextensions. Finally, we review related work in Section 7 anddraw our conclusions in Section 8.
2 WHY OASIS EXPLORATION?In this section, we establish the motivation for oasis explo-ration through a real world case study, which shows that astronger signal does not always imply a higher data rate andthe data rates provided by ISPs are not always satisfactory.We consider some of the major causes and explain how oasisexploration can help solve the problem.
2.1 A Real-World Case StudyThe data rate varies from location to location and oftenchanges over time. A real-world case study needs the in-stant data rate at every location to analyze the variation
1. Interested readers may refer to a demonstration for the oasisexploration service on YouTube at https://youtu.be/sDB4tjTUMRE.
in bandwidth. From the perspective of an ISP, it is nothard to perform instant data rate estimation, which will bediscussed in more detail in Section 6.1. In this study, wecollected data rates in a way similar to that Google collectsstreet views. It is well known that the data rate achievable ata location depends highly on the signal strength (due to theadaptive modulation and power control in wireless systems[23]) and the users who share the bandwidth (due to theshared nature of radio networks [12]). Because the signalstrength at a location is generally stable [23], analyzingthe distribution of signal strengths provides a good senseof data rates achievable at different locations. Moreover,understanding how bandwidth is shared by users helpsidentify the variation in data rates among locations. Al-though the data was not collected in a real-time manner, theanalytic results could still provide a general pattern of datarate distributions and are adequate to draw major causes ofbandwidth insufficiency.
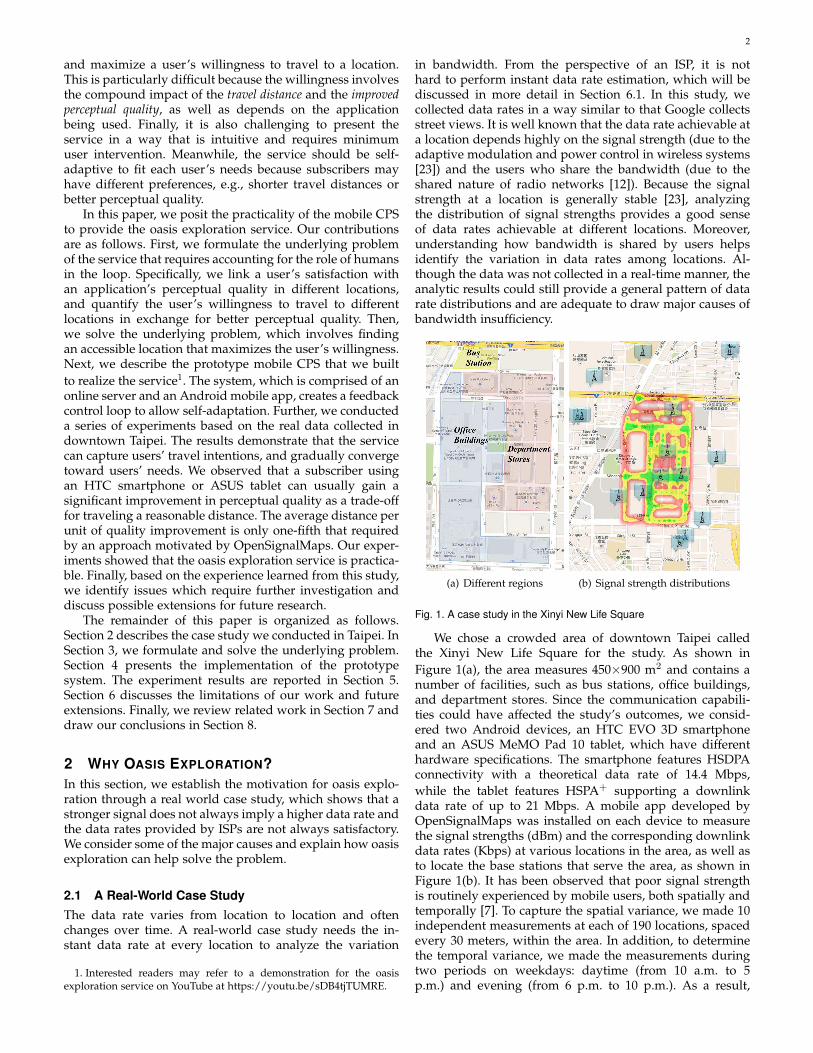
(a) Different regions (b) Signal strength distributions
Fig. 1. A case study in the Xinyi New Life Square
We chose a crowded area of downtown Taipei calledthe Xinyi New Life Square for the study. As shown inFigure 1(a), the area measures 450×900 m2 and contains anumber of facilities, such as bus stations, office buildings,and department stores. Since the communication capabili-ties could have affected the study’s outcomes, we consid-ered two Android devices, an HTC EVO 3D smartphoneand an ASUS MeMO Pad 10 tablet, which have differenthardware specifications. The smartphone features HSDPAconnectivity with a theoretical data rate of 14.4 Mbps,while the tablet features HSPA+ supporting a downlinkdata rate of up to 21 Mbps. A mobile app developed byOpenSignalMaps was installed on each device to measurethe signal strengths (dBm) and the corresponding downlinkdata rates (Kbps) at various locations in the area, as well asto locate the base stations that serve the area, as shown inFigure 1(b). It has been observed that poor signal strengthis routinely experienced by mobile users, both spatially andtemporally [7]. To capture the spatial variance, we made 10independent measurements at each of 190 locations, spacedevery 30 meters, within the area. In addition, to determinethe temporal variance, we made the measurements duringtwo periods on weekdays: daytime (from 10 a.m. to 5p.m.) and evening (from 6 p.m. to 10 p.m.). As a result,

3
each device collected approximately 1900 samples for eachperiod, i.e., 7600 samples in total. The compiled data sets arecalled Phone@daytime, Phone@evening, Tab@daytime, andTab@evening, respectively.
2.2 Null Zones - Weak Signal Strengths
−90 −80 −70 −60 −50
0.0
0.2
0.4
0.6
0.8
1.0
Signal strength (dBm)
CD
F
(a) Phone@daytime
−90 −80 −70 −60 −50
0.0
0.2
0.4
0.6
0.8
1.0
Signal strength (dBm)
CD
F
(b) Phone@evening
−90 −80 −70 −60 −50
0.0
0.2
0.4
0.6
0.8
1.0
Signal strength (dBm)
CD
F
(c) Tab@daytime
−90 −80 −70 −60 −50
0.0
0.2
0.4
0.6
0.8
1.0
Signal strength (dBm)
CD
F
(d) Tab@evening
Fig. 2. The CDF of signal strengths
Because the signal strength has a direct impact on thedownlink data rate [23], we first analyze the cumulativedistribution function (CDF) of the collected signal strengths.Figures 2(a) and 2(b) show the CDFs of the signal strengthsin Phone@daytime and Phone@evening respectively. Thesignal strengths are distributed widely and evenly overthe range [-90,-50] dBm. Based on statistical analysis, theexpected value of the signal strength is approximately -65dBm, and the corresponding data rate in the signal-dataratemodel2 is 2.7 Mbps. In other words, there is a 50% chancethat the data rate of the smartphone will be less than 2.7Mbps. Figures 2(c) and 2(d) show that the signal strengthsmeasured by the tablet have similar patterns to those ofthe smartphone. Although the tablet has a more powerfulmodule, half of the signal strengths are still below theexpected value of -60 dBm, with a corresponding data rate ofup to 5.2 Mbps in the model. The results indicate that, in halfthe trials, both devices could only achieve approximately25% of their theoretical data rates.
To analyze the causes of weak signal strengths, we plotthe distribution of the signal strengths in Phone@daytimeand the locations of the base stations in Figure 1(b). Weobserve that most base stations are erected along the area’sperimeter, with an inter-site distance of approximately 500meters, so as to provide sufficiently large coverage in aneconomic manner, while additional base stations are set upat the most densely populated locations to improve thespectral efficiency. With such a deployment, the avenues
2. The relationship between downlink data rates and signal strengthscan be established with a monotonic function using regression-basedtechniques [5]. In this relationship, each signal strength corresponds to adata rate.
and the plazas near the bus stations, as well as the depart-ment stores, are covered by strong signals above -61 dBm.However, the signals are obstructed by the buildings andfade with distance. As a consequence, they barely hit thestreets, resulting in numerous null zones where the signalstrengths are below -75 dBm. The signal samples collectedby the tablet also reveal similar distribution patterns, exceptthat the measured signals are stronger on the tablet than onthe smartphone. We observed that, although signal strengthmay fluctuate over time, the signal strength at a locationis close to the expected strength with a standard deviationup to 4 dBm, and the standard deviations are smaller than2 dBm at most locations [6]. Thus, the signal strength at alocation is deemed generally stable over time, which alsoagrees with the phenomenon observed in [23].
2.3 Hot Zones - Low Bandwidth Shares
0.0 0.5 1.0 1.5 2.0 2.5 3.00.
00.
20.
40.
60.
81.
0
Bandwidth share
CD
F
(a) Phone@daytime
0.0 0.5 1.0 1.5 2.0 2.5 3.0
0.0
0.2
0.4
0.6
0.8
1.0
Bandwidth share
CD
F
(b) Phone@evening
0.0 0.5 1.0 1.5 2.0 2.5 3.0
0.0
0.2
0.4
0.6
0.8
1.0
Bandwidth share
CD
F
(c) Tab@daytime
0.0 0.5 1.0 1.5 2.0 2.5 3.0
0.0
0.2
0.4
0.6
0.8
1.0
Bandwidth shareC
DF
(d) Tab@evening
Fig. 3. The CDF of bandwidth shares
The data rate measured at a location also depends onthe users who share the bandwidth simultaneously. Thus,we estimate the traffic burden at a location by the band-width share, which is defined as the ratio of the data ratemeasured at the location to the data rate under the samesignal strength in the signal-datarate model. Figures 3(a)and 3(b) show that the bandwidth shares of Phone@daytimeand Phone@evening are spread over a wide range withabout 50% below 1. For the tablet, about 30% and 50%of the bandwidth shares are below 1 during the day andthe evening, as shown in Figures 3(c) and 3(d) respectively.Among the locations with bandwidth shares below 1, themaximum data rate measured by the smartphone is 4.1Mbps during the day and 5.4 Mbps during the evening;while the comparable measurements for the tablet are 5.9Mbps and 9.5 Mbps respectively. Surprisingly, during theevening, the maximum data rates achieved by the smart-phone and the tablet in 50% of the area are only about 40%of their theoretical data rates. During the day, the devicescould not achieve more than 28% of their theoretical datarates in 50% and 30% of the area respectively.
To conjecture the population distribution of mobile usersin this area, we plot two respective bubble charts based
4
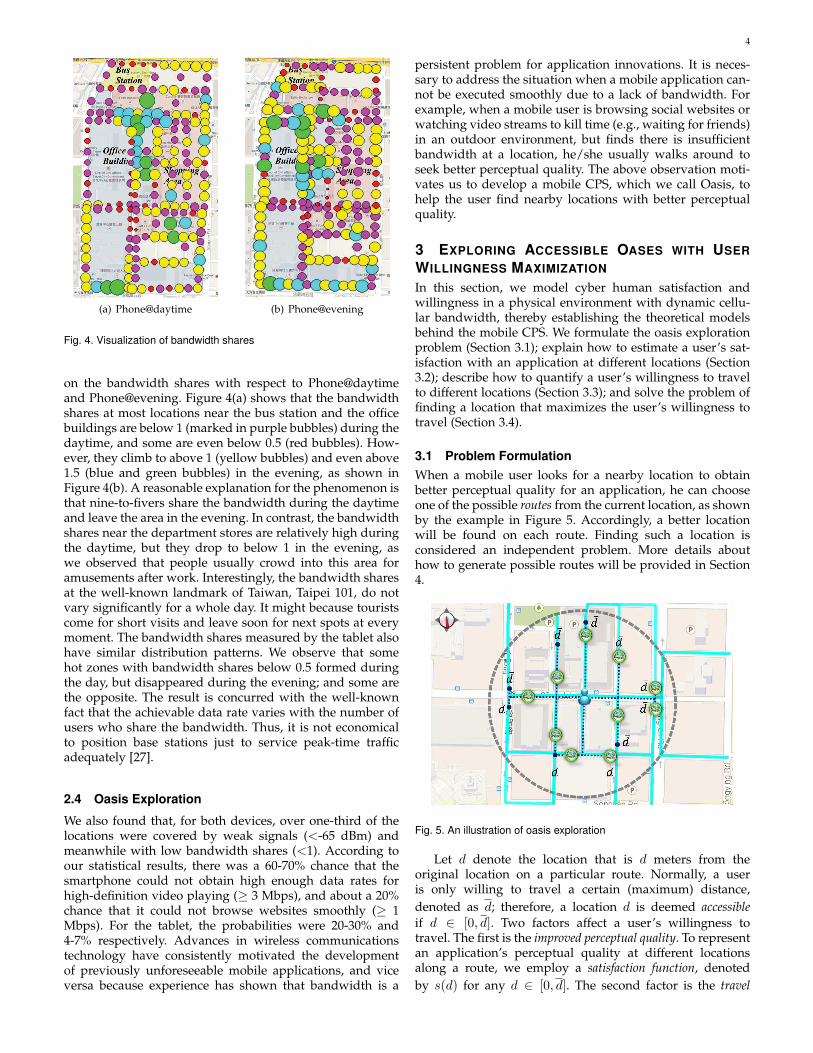
(a) Phone@daytime (b) Phone@evening
Fig. 4. Visualization of bandwidth shares
on the bandwidth shares with respect to Phone@daytimeand Phone@evening. Figure 4(a) shows that the bandwidthshares at most locations near the bus station and the officebuildings are below 1 (marked in purple bubbles) during thedaytime, and some are even below 0.5 (red bubbles). How-ever, they climb to above 1 (yellow bubbles) and even above1.5 (blue and green bubbles) in the evening, as shown inFigure 4(b). A reasonable explanation for the phenomenon isthat nine-to-fivers share the bandwidth during the daytimeand leave the area in the evening. In contrast, the bandwidthshares near the department stores are relatively high duringthe daytime, but they drop to below 1 in the evening, aswe observed that people usually crowd into this area foramusements after work. Interestingly, the bandwidth sharesat the well-known landmark of Taiwan, Taipei 101, do notvary significantly for a whole day. It might because touristscome for short visits and leave soon for next spots at everymoment. The bandwidth shares measured by the tablet alsohave similar distribution patterns. We observe that somehot zones with bandwidth shares below 0.5 formed duringthe day, but disappeared during the evening; and some arethe opposite. The result is concurred with the well-knownfact that the achievable data rate varies with the number ofusers who share the bandwidth. Thus, it is not economicalto position base stations just to service peak-time trafficadequately [27].
2.4 Oasis Exploration
We also found that, for both devices, over one-third of thelocations were covered by weak signals (<-65 dBm) andmeanwhile with low bandwidth shares (<1). According toour statistical results, there was a 60-70% chance that thesmartphone could not obtain high enough data rates forhigh-definition video playing (≥ 3 Mbps), and about a 20%chance that it could not browse websites smoothly (≥ 1Mbps). For the tablet, the probabilities were 20-30% and4-7% respectively. Advances in wireless communicationstechnology have consistently motivated the developmentof previously unforeseeable mobile applications, and viceversa because experience has shown that bandwidth is a
persistent problem for application innovations. It is neces-sary to address the situation when a mobile application can-not be executed smoothly due to a lack of bandwidth. Forexample, when a mobile user is browsing social websites orwatching video streams to kill time (e.g., waiting for friends)in an outdoor environment, but finds there is insufficientbandwidth at a location, he/she usually walks around toseek better perceptual quality. The above observation moti-vates us to develop a mobile CPS, which we call Oasis, tohelp the user find nearby locations with better perceptualquality.
3 EXPLORING ACCESSIBLE OASES WITH USERWILLINGNESS MAXIMIZATION
In this section, we model cyber human satisfaction andwillingness in a physical environment with dynamic cellu-lar bandwidth, thereby establishing the theoretical modelsbehind the mobile CPS. We formulate the oasis explorationproblem (Section 3.1); explain how to estimate a user’s sat-isfaction with an application at different locations (Section3.2); describe how to quantify a user’s willingness to travelto different locations (Section 3.3); and solve the problem offinding a location that maximizes the user’s willingness totravel (Section 3.4).
3.1 Problem FormulationWhen a mobile user looks for a nearby location to obtainbetter perceptual quality for an application, he can chooseone of the possible routes from the current location, as shownby the example in Figure 5. Accordingly, a better locationwill be found on each route. Finding such a location isconsidered an independent problem. More details abouthow to generate possible routes will be provided in Section4.
Fig. 5. An illustration of oasis exploration
Let d denote the location that is d meters from theoriginal location on a particular route. Normally, a useris only willing to travel a certain (maximum) distance,denoted as d; therefore, a location d is deemed accessibleif d ∈ [0, d]. Two factors affect a user’s willingness totravel. The first is the improved perceptual quality. To representan application’s perceptual quality at different locationsalong a route, we employ a satisfaction function, denotedby s(d) for any d ∈ [0, d]. The second factor is the travel

5
distance. Intuitively, a user’s willingness is linked to thedistance d as well as the perceptual quality s(0) and s(d)at the original location and the new location respectively.To quantify the user’s willingness to travel a distance d toimprove the perceptual quality of s(d) − s(0), we define awillingness function, denoted by ω(d, s(0), s(d)). We explainhow the two functions are derived in Sections 3.2 and 3.3respectively.
A technical problem that arises in the above process ishow to find an accessible location d ∈ [0, d] on a route rsuch that the user’s willingness to travel to the location ismaximized. We call an accessible location an oasis, denotedby o, as shown by the green bullets in Figure 5. A mappingof a route to an oasis is called an oasis exploration. Weformally define the problem as follows:
Instance: A route, r, associated with a satisfaction func-tion s(d) and a willingness function ω(d, s(0), s(d)), ford ∈ [0, d].
Objective: Find an oasis o that is on the route r andmaximizes the user’s willingness, i.e.,
o = arg maxd∈[0,d]
{ω(d, s(0), s(d))}.
3.2 User Satisfaction ModelingNext, we consider how to derive a satisfaction function,i.e., s(d), for d ∈ [0, d], for a type of mobile application.Basically, mobile applications can be categorized into fourtypes: streaming, interactive, conversational, and best-effort[12]. The Mean Opinion Score (MOS), which provides a nu-merical indication, is widely used to quantify user satisfac-tion with an application under various downlink data rates[16]. Many studies have tried to establish MOS functions forthe above applications [2, 3, 8, 13, 18, 24]. With regard to thedownlink data rate, any MOS function could be used foroasis exploration. In the following, we consider the first typeof application, namely TCP-based video streaming, as anexample. We describe its behavior and the rationale behindits MOS function.
TCP-based video streaming applications, such as IMDb,exploit the TCP protocol to deliver video content to endusers, so that lost packets can be detected and retransmitted.However, if the downlink data rate is lower than the videobitrate, the video playback process will gradually emptythe buffer and result in stalling events. Then, the user willexperience intermittent video playback, which will impacthis satisfaction. As indicated in [13], the number of stallingevents and the length of an event are the decisive factorsin user satisfaction. Given a video stream, the number ofstalling events can be approximated by an equation that con-siders the video bitrate, the video length, and the downlinkdata rate. The length of a stalling event, which depends onthe video playout buffer’s implementation, is usually a fixedinteger. Based on the number of stalling events per videostream, an MOS function for video streaming was presentedin [13] using crowdsourcing, a subjective quality evaluationmethod. Interested readers may refer to [13] for the func-tion’s closed-form expression. Note that the MOS functionborrowed from [13] was established for video streams withconstant bitrate. For video streams with adaptive bitrate,like YouTube, the MOS function derived from [18] or [3]could be used instead.
Different types of application may have different MOSfunctions. For example, web browsing (like Chrome) andfile synchronization (like Dropbox) are two popular appli-cations that belong to the interactive and best-effort typesof application respectively. User satisfaction is dominatedby the page load time and the file download time [9], whichcan be calculated based on the downlink data rate plus thenumber and size of the data items to be downloaded [17].Accordingly, their MOS functions with respect to the datarate were established in [9].
The satisfaction function for a type of application can bederived if its MOS function with respect to the downlinkdata rate has been established3. Given an MOS function,we map the downlink data rate at each location to an MOSvalue at the location, so each application type has its ownsatisfaction function with respect to the locations along aroute. Because the MOS value varies irregularly along aroute, we apply a polynomial regression method [29] to theMOS values and obtain a satisfaction function as follows
s(d) =∑q
i=0 aidi, for d ∈ [0, d], (1)
where ai is the coefficient of the term with degree i and q isthe highest degree of the polynomial.
3.3 User Willingness Modeling
Next, we explain how to derive a willingness func-tion on a route, i.e., ω(d, s(0), s(d)), for d ∈ [0, d], foran application type. The willingness to travel couldbe influenced by d, s(0), and s(d); or by a combina-tion of them. Let x be the vector of the seven com-binations of the three influencing factors, i.e., x =
(d, s(0), s(d), s(0)d, s(d)d, s(0)s(d), s(0)s(d)d)T , andlet x(k), k = 1, 2, ..., 7, denote the k-th element. Then,assigning the respective values to d, s(0), and s(d) yieldsa corresponding setting of x. Given a setting xj , let π(xj)be the probability that the user is willing to travel. Now,we have to establish the relationship between xj and π(xj).Because the user’s response will be either Yes or No, theresponse to xj is binary; thus, the relationship between xj
and π(xj) is generally nonlinear. In statistics, logistic regres-sion is widely used to predict the odds of being a case basedon the values of the independent variables. Binary logisticregression (or called a logit model [1]) deals with situationswhen the response takes one of only two possible valuesrepresenting Yes and No, or more generally the presence orabsence of a variable of interest. Here, the variable of interestis user willingness, i.e., willing or unwilling to travel to anoasis in exchange for better perceptual equality.
Moreover, the nonlinear relationship is often monotonic,either increasing or decreasing continuously, where a fixedchange in xj often has less impact when π(xj) is close to0 or 1 than when π(xj) is close to 0.5. Typically, such arelationship has a model formula [1] given by
π(xj) =eα+βT xj
1 + eα+βT xj,
3. For applications without MOS functions, our prototype systemrecommends the closest location with the strongest signal on each routeinstead.

6
where α and β = (β1, β2, ..., β7)T are the coefficients of theformula. With some rearrangements, the log odds of π(xj)reveal the linear relationship, i.e.,
logπ(xj)
1− π(xj)= α+ βTxj ,
where the odds indicate a comparison between the proba-bilities to travel, i.e., π(xj), and not to travel, i.e, 1− π(xj).The above model is a logit model in which the responsesto the same setting are treated as an independent binomialexperiment. Undoubtedly, the larger the number (and themore diverse) the settings and the responses gathered, themore accurately the logit model will reflect the user’s will-ingness to travel. Suppose there are N settings, i.e., xj , forj = 1, 2, ..., N . We can simply use the maximum likelihoodmethod [1] to determine a pair of α̂ and β̂ = (β̂1, β̂2, ..., β̂7)T
so that the response to each of the N settings is the mostprobable. Then, the resultant logit model is derived by
logπ(x)
1− π(x)= α̂+ β̂
Tx, (2)
where β̂k, k = 1, 2, ..., 7, indicates the influence of the k-thelement, x(k), on the user’s willingness to travel.
There are seven elements in the vector x, but it is notnecessary to include all of them in the logit model. Toofew elements would not be sufficient to reflect the influenceof the three factors on the log odds; in contrast, too manyelements could disturb the estimation of the log odds. Theobjective of model selection is two-fold [1]: the selectedmodel should 1) be complex enough to fit the data well,and 2) be relatively simple to interpret. We utilize AkaikeInformation Criterion to evaluate how well a model reflectsthe user’s willingness to travel. In addition, we use aniterative variable-selection method, called backward elimina-tion, to eliminate unnecessary elements in the above logitmodel. Note that β̂k is set at zero if it is the coefficient ofan eliminated element x(k). By substituting Equation (1)into Equation (2), the general form of the user willingnessfunction on a route for an application type is given by
ω(d, s(0), s(d)) = α̂+ β̂2a0 + (β̂1 + β̂4a0)d (3)
+ (β̂3 + β̂6a0)∑q
i=0 aidi
+ (β̂5 + β̂7a0)∑q
i=0 aidi+1.
3.4 User Willingness MaximizationFinally, given a route associated with a user’s satisfac-tion and willingness functions, we explain how to searchfor an oasis that will maximize the user’s willingness totravel. As shown in Equation (3), after substitution andrearrangement, a willingness function is a function of d.In other words, we have to find a location o ∈ [0, d] suchthat ω(o, s(0), s(o)) is maximized. Because Equation (3) is apolynomial function, the location, o, can be determined bythe first and second derivatives of the equation. By settingthe first derivative, i.e., ω′(d, s(0), s(d)), equal to zero andsolving the derivation for d, Newton’s method can be usedto obtain the roots of the first derivative. Let ∆ be theset of roots. A root in ∆ can be a maximum, minimum,or saddle point; however, it is only a maximum when the
second derivative, i.e., ω′′(d, s(0), s(d)), is less than zero.Let ∆< be the set of the roots in ∆ such that the secondderivative is less than zero. Note that, in addition to theroots in ∆<, the boundaries 0 and d must also be consideredin the maximization. Hence, an oasis that maximizes theuser willingness function can be found by examining eachlocation d ∈ {0, d} ∪∆<, i.e.,
o = arg maxd∈{0,d}∪∆<
{ω(d, s(0), s(d))}.
4 A MOBILE CPS FOR OASIS EXPLORATION
4.1 Design and Implementation
Fig. 6. The oasis exploration system
Next, we describe a mobile CPS that runs the oasis ex-ploration service, where the theoretical models discussed inSection 3 serve as the underlying techniques. Our oasis ex-ploration system comprises an online server and an Androidmobile app, as shown in Figure 6. The system is structuredwith a feedback loop control composed of three phases:the data collection phase, the oasis exploration phase, and theself-adaptation phase. In the data collection phase, all thedata required to initiate the service is collected and storedin separate databases on the server. The oasis explorationphase is invoked when a mobile device containing the Oasisapp sends a request to the server. On receipt of the request,the server searches for oases nearby and responds to theapp. The app also provides a GUI to seek feedback fromusers to facilitate the adaptation of the service to their realneeds in the self-adaptation phase. The design has severaladvantages. First, as the server performs most of the compu-tations, mobile devices do not incur a significant overhead.Second, user intervention is minimized because nearly allthe information needed is monitored automatically by thesystem. Third, the communication traffic is reduced becausea request or response will only contain a small amountof information. Fourth, the service is adaptable to eachuser’s needs. This property is especially important becausethe initial satisfaction and willingness functions based oncrowdsourcing studies may not accurately reflect a users’needs. We discuss the three phases in detail in the followingsub-sections.
4.2 The Data Collection PhaseIf the service is offered by an ISP, the data rate at a locationcan be estimated in a real-time fashion. More detail will be
7
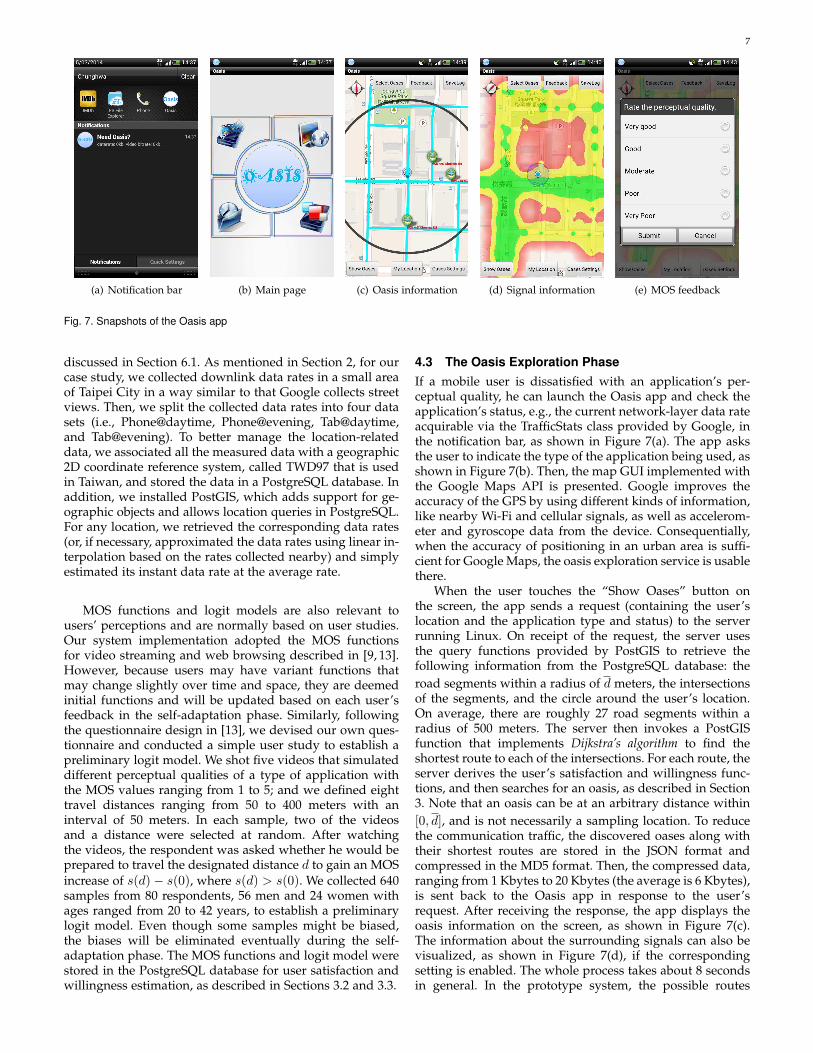
(a) Notification bar (b) Main page (c) Oasis information (d) Signal information (e) MOS feedback
Fig. 7. Snapshots of the Oasis app
discussed in Section 6.1. As mentioned in Section 2, for ourcase study, we collected downlink data rates in a small areaof Taipei City in a way similar to that Google collects streetviews. Then, we split the collected data rates into four datasets (i.e., Phone@daytime, Phone@evening, Tab@daytime,and Tab@evening). To better manage the location-relateddata, we associated all the measured data with a geographic2D coordinate reference system, called TWD97 that is usedin Taiwan, and stored the data in a PostgreSQL database. Inaddition, we installed PostGIS, which adds support for ge-ographic objects and allows location queries in PostgreSQL.For any location, we retrieved the corresponding data rates(or, if necessary, approximated the data rates using linear in-terpolation based on the rates collected nearby) and simplyestimated its instant data rate at the average rate.
MOS functions and logit models are also relevant tousers’ perceptions and are normally based on user studies.Our system implementation adopted the MOS functionsfor video streaming and web browsing described in [9, 13].However, because users may have variant functions thatmay change slightly over time and space, they are deemedinitial functions and will be updated based on each user’sfeedback in the self-adaptation phase. Similarly, followingthe questionnaire design in [13], we devised our own ques-tionnaire and conducted a simple user study to establish apreliminary logit model. We shot five videos that simulateddifferent perceptual qualities of a type of application withthe MOS values ranging from 1 to 5; and we defined eighttravel distances ranging from 50 to 400 meters with aninterval of 50 meters. In each sample, two of the videosand a distance were selected at random. After watchingthe videos, the respondent was asked whether he would beprepared to travel the designated distance d to gain an MOSincrease of s(d)− s(0), where s(d) > s(0). We collected 640samples from 80 respondents, 56 men and 24 women withages ranged from 20 to 42 years, to establish a preliminarylogit model. Even though some samples might be biased,the biases will be eliminated eventually during the self-adaptation phase. The MOS functions and logit model werestored in the PostgreSQL database for user satisfaction andwillingness estimation, as described in Sections 3.2 and 3.3.
4.3 The Oasis Exploration PhaseIf a mobile user is dissatisfied with an application’s per-ceptual quality, he can launch the Oasis app and check theapplication’s status, e.g., the current network-layer data rateacquirable via the TrafficStats class provided by Google, inthe notification bar, as shown in Figure 7(a). The app asksthe user to indicate the type of the application being used, asshown in Figure 7(b). Then, the map GUI implemented withthe Google Maps API is presented. Google improves theaccuracy of the GPS by using different kinds of information,like nearby Wi-Fi and cellular signals, as well as accelerom-eter and gyroscope data from the device. Consequentially,when the accuracy of positioning in an urban area is suffi-cient for Google Maps, the oasis exploration service is usablethere.
When the user touches the “Show Oases” button onthe screen, the app sends a request (containing the user’slocation and the application type and status) to the serverrunning Linux. On receipt of the request, the server usesthe query functions provided by PostGIS to retrieve thefollowing information from the PostgreSQL database: theroad segments within a radius of d meters, the intersectionsof the segments, and the circle around the user’s location.On average, there are roughly 27 road segments within aradius of 500 meters. The server then invokes a PostGISfunction that implements Dijkstra’s algorithm to find theshortest route to each of the intersections. For each route, theserver derives the user’s satisfaction and willingness func-tions, and then searches for an oasis, as described in Section3. Note that an oasis can be at an arbitrary distance within[0, d], and is not necessarily a sampling location. To reducethe communication traffic, the discovered oases along withtheir shortest routes are stored in the JSON format andcompressed in the MD5 format. Then, the compressed data,ranging from 1 Kbytes to 20 Kbytes (the average is 6 Kbytes),is sent back to the Oasis app in response to the user’srequest. After receiving the response, the app displays theoasis information on the screen, as shown in Figure 7(c).The information about the surrounding signals can also bevisualized, as shown in Figure 7(d), if the correspondingsetting is enabled. The whole process takes about 8 secondsin general. In the prototype system, the possible routes
8
originated at the current location are processed sequentially.Since finding an oasis on each route can be consideredan independent problem (as described in Section 3.1, theoasis exploration phase could be further speeded up with aparallel implementation.
4.4 The Self-Adaptation Phase
For self-adaptation, the Oasis app runs a daemon to peri-odically monitor the foreground application’s status, suchas the downlink data rate. The daemon also gathers addi-tional information if necessary. For example, it records avideo’s bitrate and length when the video is streamed inthe foreground. In addition, after the Oasis app is launched,it asks the user to rate the application’s perceptual quality,as shown in Figure 7(e). Then, it sends a request to theserver for oasis exploration, as described in Section 4.3.When the daemon receives the server’s response, it starts tomonitor the device’s position until the original applicationis switched back to the foreground to track the oasis pickedby the user. After the application is terminated, the Oasisapp asks the user to rate the perceptual quality again.The selected oasis, the two MOS values rated by the userrespectively at the original location and the oasis, as wellas the corresponding downlink data rates monitored by thedaemon, are uploaded to the server. Note that the length ofthe monitoring interval has an impact on whether the mea-sured data rate can reflect the actual data rate correspondingto the MOS value rated by the user. A long interval maynot capture the up-to-date data rate, while a short intervalmay make the measured data rate sensible to a bursty datarate. We adopt the average data rate over an interval of 5seconds as an appropriate compromise. Finally, based onthe feedback, the server adjusts the logit model and theMOS function to better fit the user’s needs after each servicerequest.
To adjust the logit model, the server draws some rea-sonable inferences based on the selected oasis. Let the MOSvalue of the selected oasis be v and let its distance be d.Moreover, let d∗v denote the maximum distance of thoseoases whose MOS = v ever selected by the user. If thereare oases whose MOS values ≥ v and distances ≤ d, theuser should also be willing to travel to them. In contrast,if there is any unselected oasis whose MOS value > v butwhose distance > d, the user should be unwilling to travelto oases further away (if any) whose MOS values ≤ v.Moreover, for any unselected oases whose MOS values = v,if their travel distances> d∗v , the user should be unwilling totravel to these oases; otherwise, the user should be willingto travel to the unselected oases whose distances ≤ d∗v ifthere is no better choice among discovered oases. Basedon the inferences, the server generates new samples in asimilar way to that described in Section 4.2; then, the logitmodel is adjusted based on all the samples in the databaseusing the method described in Section 3.3. We sampled eachMOS function taken from [9, 13] at 35 different data rates togenerate initial samples and stored them in the databasebeforehand. Each pair of the uploaded MOS values anddownlink data rates is added as a new sample. Because therelationship between MOS values and data rates is an expo-nential function [9, 13], the corresponding MOS function isadjusted using a nonlinear regression-based technique [22]
based on the latest 35 samples (which are sufficient to derivean appropriate function in our study).
5 PERFORMANCE EVALUATION
5.1 Experiment SetupTo evaluate the efficacy, and better understand the prop-erties, of oasis exploration, we conducted extensive exper-iments in the Xinyi New Life Square. The Oasis app wasinstalled on an HTC smartphone and an ASUS tablet, withthe maximum distance d set at 500 meters; and the servicewas deployed on a Linux server based on the preliminarydatabases described in Section 4.2. In the experiments, weconsidered a TCP-based video streaming app, called IMDb,in accordance with the MOS function derived based onconstant bitrate video streams in [13]. To assign appropriateparameters for the adopted MOS function, the Oasis appobtained the chosen trailer’s length and the video bitratefrom the IMDb website automatically. We also measured astalling event’s length (4 seconds) used in the implementa-tion of the video playout buffer.
The oasis exploration service trades off the travel dis-tance for improved perceptual quality. Thus, we evaluate itsperformance in terms of the improved MOS and the traveldistance. Moreover, the failure rate is used as another metricto validate the service’s availability. The failure rate is thepercentage of failed explorations over the total explorationsconducted for all possible routes from a location, wherean exploration is deemed a failure if the traveling distanceper unit of MOS improvement is larger than the maximumdistance d (i.e., the improved MOS value is only marginalor even negative).
To show the performance gain, we compared the pro-posed OASIS approach with an intuitive approach, denotedas MAXSIG, motivated by OpenSignalMaps. For each route,OASIS finds the location that maximizes a user’s will-ingness to travel, while MAXSIG recommends the closestlocation with the maximum signal strength. As observedin [23], downlink data rates are generally proportionalto signal strengths. OpenSignalMaps, which visualizes thecrowdsource signal strengths in the form of color-codedmaps, aids identifying accessible locations and motivatesMAXSIG. However, MAXSIG does not consider applica-tions’ perceptual quality and users’ travel intentions, whichare reflected respectively by the MOS functions and logitmodels in OASIS. Comparison with MAXSIG allows us tounderstand the compound impact of the travel distance andthe improved perceptual quality on users’ willingness totravel.
In Section 5.2, we consider some preliminary studies thathelped us re-examine the design of the service and identifyissues that require further enhancements. In Section 5.3, weaddress the identified issues and enhance the service; and inSection 5.4, we evaluate the performance of the service thathas been adapted to meet users’ needs.
5.2 Preliminary StudiesFor the preliminary studies, we chose an HD movie trailer,The Wolf of Wall Street, whose length is 153 seconds andvideo bitrate is 3022 Kbps. We watched the trailer and mea-sured the average data rate at a randomly selected location.

9
Then, OASIS or MAXSIG searched for an accessible locationon each of all possible routes that originated from the loca-tion. We walked to the oasis along each route and watchedthe trailer again in order to assess the travel distance andthe perceptual quality. The experiment was performed onboth devices during the day and the evening, and repeatedat different locations with a variety of downlink data ratesuntil a convergence of the performance trend was observed.We identified several issues that affected the efficacy of theoasis exploration service. The findings detailed below arebased on 60 original locations, where the numbers of theselected locations for OASIS (/MAXSIG) were, respectively,9 (/14), 6 (/7), 6 (/8), and 5 (/5) for Phone@daytime,Phone@evening, Tab@daytime, and Tab@evening.
0
20
40
60
80
100
500 1000 1500 2000 2500 3000 3500
Fai
lure
rat
e (%
)
Downlink datarate (Kbps)
(14)(7)(8)(5)
MAXSIG-P@dMAXSIG-P@eMAXSIG-T@dMAXSIG-T@e
0
20
40
60
80
100
500 1000 1500 2000 2500 3000 3500
Fai
lure
rat
e (%
)
Downlink datarate (Kbps)
(14)(7)(8)(5)
(9)(6)(6)(5)
OASIS-P@dOASIS-P@eOASIS-T@dOASIS-T@e
Fig. 8. Failure rates
First, we investigate the failure rates of MAXSIG andOASIS at each of the randomly selected locations withvarious downlink data rates. As shown in Figure 8, thefailure rates of MAXSIG vary significantly with explo-rations at different locations. It is because MAXSIG rec-ommends the closest location with the maximum signalstrength along each route; however, a stronger signal doesnot always imply a higher data rate (and thus a largerMOS value) because the available bandwidth may beshared by multiple users. The average failure rates withrespect to Phone@daytime, Phone@evening, Tab@daytime,and Tab@evening are 57.47%, 54.67%, 36.14% and 22.03%,respectively. In contrast, OASIS achieves the ideal failurerate of 0% at half of the 26 selected locations. One possiblereason for the failures at the other half of the locations isthat the data collected previously may not have accuratelyreflected the instant data rates because of users’ move-ments. The corresponding failure rates of OASIS are 35.14%,18.18%, 9.09% and 0%, respectively. Although OASIS isgreatly superior to MAXSIG, the numerical results indicatethe need of real-time radio resource estimation.
Next, we investigate the improved MOS. According tothe borrowed MOS function [13], which maps a downlinkdata rate to an MOS value, the minimum and maximumMOS values of 1.62 and 4.97 for the trailer respectivelyoccurs when the downlink data rate ≤ 2840 Kbps and ≥3220 Kbps. Figure 9 shows the improved MOS as far asthose successful explorations are considered4. Surprisingly,OASIS achieves the maximum or only marginal MOS im-provements in different scenarios, but rarely yields modestimprovements. We observed that traveling from a location
4. The data points are slightly “jittered” horizontally and vertically tobetter identify overlapping points.
0
1
2
3
4
5
500 1000 1500 2000 2500 3000 3500
Impro
ved
MO
S
Downlink datarate (Kbps)
MAXSIGOASIS
0
1
2
3
4
5
500 1000 1500 2000 2500 3000 3500
Impro
ved
MO
S
Downlink datarate (Kbps)
0
1
2
3
4
5
500 1000 1500 2000 2500 3000 3500
Impro
ved
MO
S
Downlink datarate (Kbps)
(a) Phone@daytime
0
1
2
3
4
5
500 1000 1500 2000 2500 3000 3500
Impro
ved
MO
S
Downlink datarate (Kbps)
MAXSIGOASIS
0
1
2
3
4
5
500 1000 1500 2000 2500 3000 3500
Impro
ved
MO
S
Downlink datarate (Kbps)
0
1
2
3
4
5
500 1000 1500 2000 2500 3000 3500
Impro
ved
MO
S
Downlink datarate (Kbps)
(b) Phone@evening
0
1
2
3
4
5
500 1000 1500 2000 2500 3000 3500
Impro
ved
MO
S
Downlink datarate (Kbps)
MAXSIGOASIS
0
1
2
3
4
5
500 1000 1500 2000 2500 3000 3500
Impro
ved
MO
S
Downlink datarate (Kbps)
0
1
2
3
4
5
500 1000 1500 2000 2500 3000 3500
Impro
ved
MO
S
Downlink datarate (Kbps)
(c) Tab@daytime
0
1
2
3
4
5
500 1000 1500 2000 2500 3000 3500
Impro
ved
MO
S
Downlink datarate (Kbps)
MAXSIGOASIS
0
1
2
3
4
5
500 1000 1500 2000 2500 3000 3500
Impro
ved
MO
S
Downlink datarate (Kbps)
0
1
2
3
4
5
500 1000 1500 2000 2500 3000 3500
Impro
ved
MO
S
Downlink datarate (Kbps)
(d) Tab@evening
Fig. 9. Improved MOS
with a data rate of 600 Kbps to another with 2700 Kbpssignificantly improved the trailer’s perceptual quality; how-ever, the MOS values under 600 Kbps and 2700 Kbps onlymade a marginal difference, and this exploration may bedeemed a failure as a consequence. In other words, thepreliminary MOS function’s effective range (i.e., from 2840to 3220 Kbps [13]) is too narrow and cannot fit every user’sperception.
0
100
200
300
400
500
600
500 1000 1500 2000 2500 3000 3500
Tra
vel
ing d
ista
nce
(m
)
Downlink datarate (Kbps)
MAXSIGOASIS
(a) Phone@daytime
0
100
200
300
400
500
600
500 1000 1500 2000 2500 3000 3500
Tra
vel
ing d
ista
nce
(m
)
Downlink datarate (Kbps)
MAXSIGOASIS
(b) Phone@evening
0
100
200
300
400
500
600
500 1000 1500 2000 2500 3000 3500
Tra
vel
ing d
ista
nce
(m
)
Downlink datarate (Kbps)
MAXSIGOASIS
(c) Tab@daytime
0
100
200
300
400
500
600
500 1000 1500 2000 2500 3000 3500
Tra
vel
ing d
ista
nce
(m
)
Downlink datarate (Kbps)
MAXSIGOASIS
(d) Tab@evening
Fig. 10. Traveling distances
Finally, we investigate the traveling distances ofthose successful explorations. As shown in Figure 10,the traveling distances under MAXSIG vary significantlyand irregularly within the maximum distance d, i.e., 500meters. The reason is that the strongest signal on a routecan be at an arbitrary distance from the original location.Under MAXSIG, the traveling distance is approximately300 meters on average. By contrast, the traveling distancesunder OASIS are much shorter. All the locations that
10
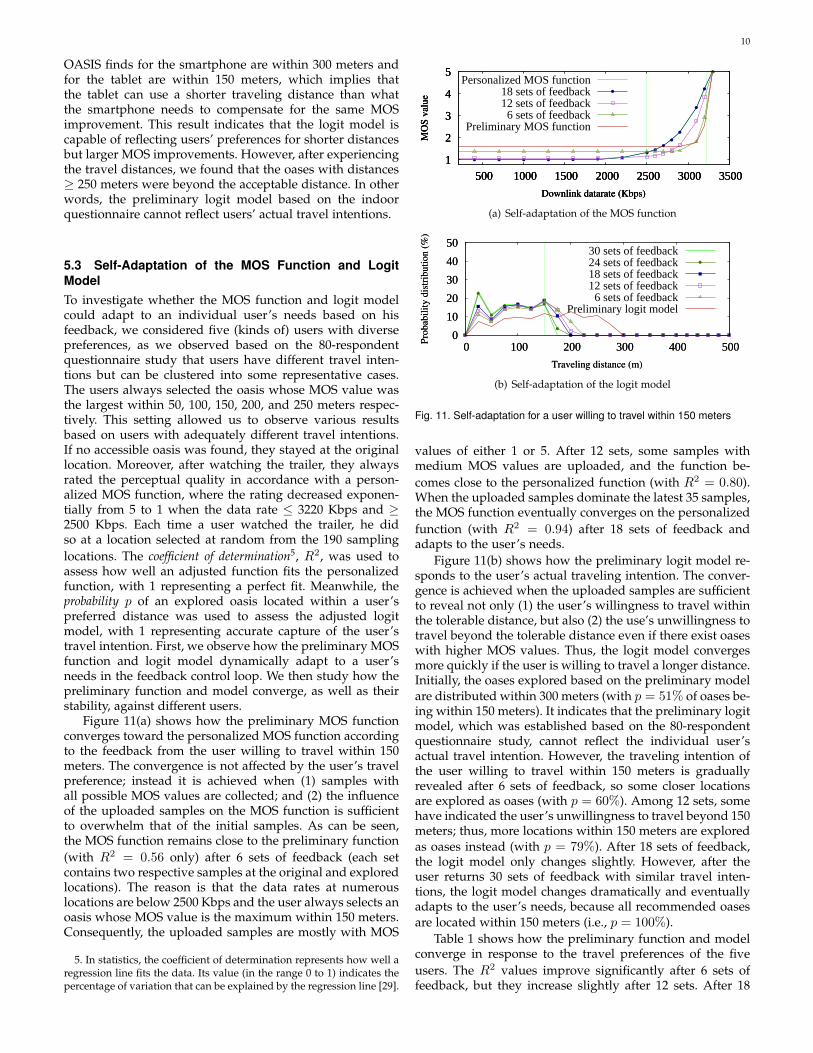
OASIS finds for the smartphone are within 300 meters andfor the tablet are within 150 meters, which implies thatthe tablet can use a shorter traveling distance than whatthe smartphone needs to compensate for the same MOSimprovement. This result indicates that the logit model iscapable of reflecting users’ preferences for shorter distancesbut larger MOS improvements. However, after experiencingthe travel distances, we found that the oases with distances≥ 250 meters were beyond the acceptable distance. In otherwords, the preliminary logit model based on the indoorquestionnaire cannot reflect users’ actual travel intentions.
5.3 Self-Adaptation of the MOS Function and LogitModelTo investigate whether the MOS function and logit modelcould adapt to an individual user’s needs based on hisfeedback, we considered five (kinds of) users with diversepreferences, as we observed based on the 80-respondentquestionnaire study that users have different travel inten-tions but can be clustered into some representative cases.The users always selected the oasis whose MOS value wasthe largest within 50, 100, 150, 200, and 250 meters respec-tively. This setting allowed us to observe various resultsbased on users with adequately different travel intentions.If no accessible oasis was found, they stayed at the originallocation. Moreover, after watching the trailer, they alwaysrated the perceptual quality in accordance with a person-alized MOS function, where the rating decreased exponen-tially from 5 to 1 when the data rate ≤ 3220 Kbps and ≥2500 Kbps. Each time a user watched the trailer, he didso at a location selected at random from the 190 samplinglocations. The coefficient of determination5, R2, was used toassess how well an adjusted function fits the personalizedfunction, with 1 representing a perfect fit. Meanwhile, theprobability p of an explored oasis located within a user’spreferred distance was used to assess the adjusted logitmodel, with 1 representing accurate capture of the user’stravel intention. First, we observe how the preliminary MOSfunction and logit model dynamically adapt to a user’sneeds in the feedback control loop. We then study how thepreliminary function and model converge, as well as theirstability, against different users.
Figure 11(a) shows how the preliminary MOS functionconverges toward the personalized MOS function accordingto the feedback from the user willing to travel within 150meters. The convergence is not affected by the user’s travelpreference; instead it is achieved when (1) samples withall possible MOS values are collected; and (2) the influenceof the uploaded samples on the MOS function is sufficientto overwhelm that of the initial samples. As can be seen,the MOS function remains close to the preliminary function(with R2 = 0.56 only) after 6 sets of feedback (each setcontains two respective samples at the original and exploredlocations). The reason is that the data rates at numerouslocations are below 2500 Kbps and the user always selects anoasis whose MOS value is the maximum within 150 meters.Consequently, the uploaded samples are mostly with MOS
5. In statistics, the coefficient of determination represents how well aregression line fits the data. Its value (in the range 0 to 1) indicates thepercentage of variation that can be explained by the regression line [29].
1
2
3
4
5
500 1000 1500 2000 2500 3000 3500
MO
S v
alue
Downlink datarate (Kbps)
Personalized MOS function18 sets of feedback12 sets of feedback6 sets of feedback
Preliminary MOS function
1
2
3
4
5
500 1000 1500 2000 2500 3000 3500
MO
S v
alue
Downlink datarate (Kbps)
1
2
3
4
5
500 1000 1500 2000 2500 3000 3500
MO
S v
alue
Downlink datarate (Kbps)
(a) Self-adaptation of the MOS function
0
10
20
30
40
50
0 100 200 300 400 500
Pro
bab
ilit
y d
istr
ibuti
on (
%)
Traveling distance (m)
30 sets of feedback24 sets of feedback18 sets of feedback12 sets of feedback6 sets of feedback
Preliminary logit model
0
10
20
30
40
50
0 100 200 300 400 500
Pro
bab
ilit
y d
istr
ibuti
on (
%)
Traveling distance (m)
(b) Self-adaptation of the logit model
Fig. 11. Self-adaptation for a user willing to travel within 150 meters
values of either 1 or 5. After 12 sets, some samples withmedium MOS values are uploaded, and the function be-comes close to the personalized function (with R2 = 0.80).When the uploaded samples dominate the latest 35 samples,the MOS function eventually converges on the personalizedfunction (with R2 = 0.94) after 18 sets of feedback andadapts to the user’s needs.
Figure 11(b) shows how the preliminary logit model re-sponds to the user’s actual traveling intention. The conver-gence is achieved when the uploaded samples are sufficientto reveal not only (1) the user’s willingness to travel withinthe tolerable distance, but also (2) the use’s unwillingness totravel beyond the tolerable distance even if there exist oaseswith higher MOS values. Thus, the logit model convergesmore quickly if the user is willing to travel a longer distance.Initially, the oases explored based on the preliminary modelare distributed within 300 meters (with p = 51% of oases be-ing within 150 meters). It indicates that the preliminary logitmodel, which was established based on the 80-respondentquestionnaire study, cannot reflect the individual user’sactual travel intention. However, the traveling intention ofthe user willing to travel within 150 meters is graduallyrevealed after 6 sets of feedback, so some closer locationsare explored as oases (with p = 60%). Among 12 sets, somehave indicated the user’s unwillingness to travel beyond 150meters; thus, more locations within 150 meters are exploredas oases instead (with p = 79%). After 18 sets of feedback,the logit model only changes slightly. However, after theuser returns 30 sets of feedback with similar travel inten-tions, the logit model changes dramatically and eventuallyadapts to the user’s needs, because all recommended oasesare located within 150 meters (i.e., p = 100%).
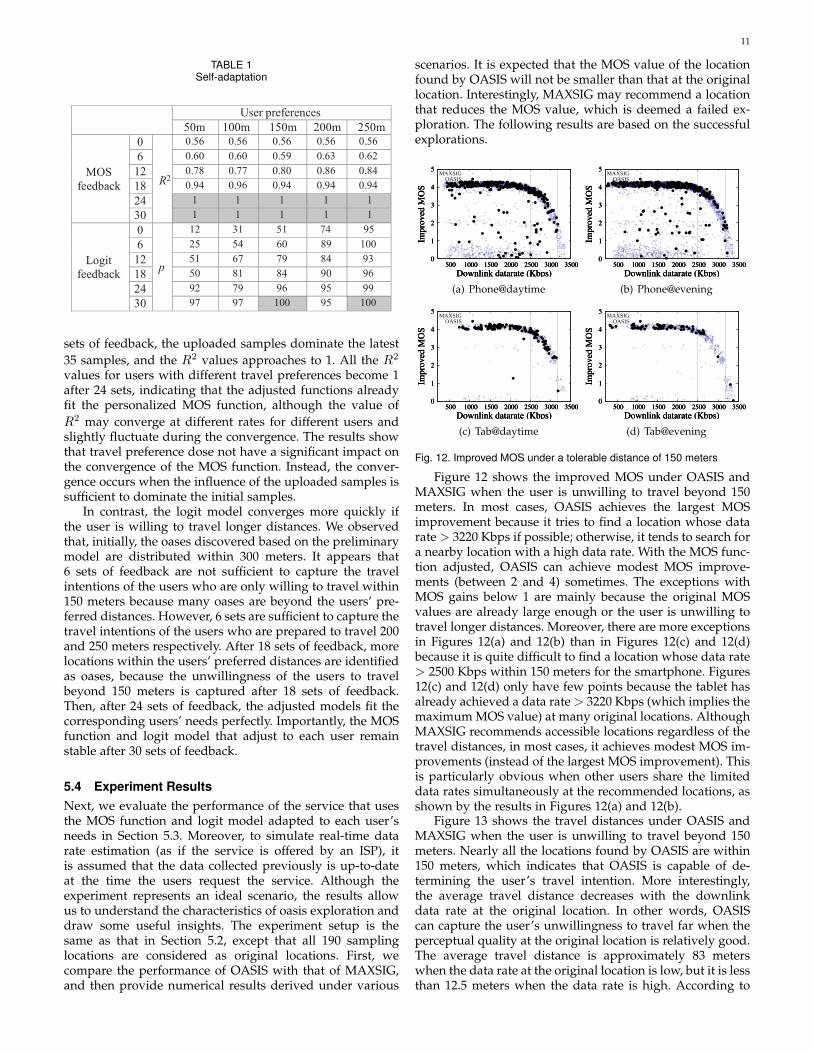
Table 1 shows how the preliminary function and modelconverge in response to the travel preferences of the fiveusers. The R2 values improve significantly after 6 sets offeedback, but they increase slightly after 12 sets. After 18
11
TABLE 1Self-adaptation
User preferences
50m 100m 150m 200m 250m
MOS
feedback
0
R2
0.56 0.56 0.56 0.56 0.56
6 0.60 0.60 0.59 0.63 0.62
12 0.78 0.77 0.80 0.86 0.84
18 0.94 0.96 65
0.94 0.94 0.94
24 1 1 1 1 1
30 1 1 1 1 1
Logit
feedback
0
p
12 31 51 74 95
6 25 54 60 89 100
12 51 67 79 84 93
18 50 81 84 90 96
24 92 79 96 95 99
30 97 97 100 95 100
sets of feedback, the uploaded samples dominate the latest35 samples, and the R2 values approaches to 1. All the R2
values for users with different travel preferences become 1after 24 sets, indicating that the adjusted functions alreadyfit the personalized MOS function, although the value ofR2 may converge at different rates for different users andslightly fluctuate during the convergence. The results showthat travel preference dose not have a significant impact onthe convergence of the MOS function. Instead, the conver-gence occurs when the influence of the uploaded samples issufficient to dominate the initial samples.
In contrast, the logit model converges more quickly ifthe user is willing to travel longer distances. We observedthat, initially, the oases discovered based on the preliminarymodel are distributed within 300 meters. It appears that6 sets of feedback are not sufficient to capture the travelintentions of the users who are only willing to travel within150 meters because many oases are beyond the users’ pre-ferred distances. However, 6 sets are sufficient to capture thetravel intentions of the users who are prepared to travel 200and 250 meters respectively. After 18 sets of feedback, morelocations within the users’ preferred distances are identifiedas oases, because the unwillingness of the users to travelbeyond 150 meters is captured after 18 sets of feedback.Then, after 24 sets of feedback, the adjusted models fit thecorresponding users’ needs perfectly. Importantly, the MOSfunction and logit model that adjust to each user remainstable after 30 sets of feedback.
5.4 Experiment ResultsNext, we evaluate the performance of the service that usesthe MOS function and logit model adapted to each user’sneeds in Section 5.3. Moreover, to simulate real-time datarate estimation (as if the service is offered by an ISP), itis assumed that the data collected previously is up-to-dateat the time the users request the service. Although theexperiment represents an ideal scenario, the results allowus to understand the characteristics of oasis exploration anddraw some useful insights. The experiment setup is thesame as that in Section 5.2, except that all 190 samplinglocations are considered as original locations. First, wecompare the performance of OASIS with that of MAXSIG,and then provide numerical results derived under various
scenarios. It is expected that the MOS value of the locationfound by OASIS will not be smaller than that at the originallocation. Interestingly, MAXSIG may recommend a locationthat reduces the MOS value, which is deemed a failed ex-ploration. The following results are based on the successfulexplorations.
0
1
2
3
4
5
500 1000 1500 2000 2500 3000 3500
Impro
ved
MO
S
Downlink datarate (Kbps)
MAXSIGOASIS
0
1
2
3
4
5
500 1000 1500 2000 2500 3000 3500
Impro
ved
MO
S
Downlink datarate (Kbps)
0
1
2
3
4
5
500 1000 1500 2000 2500 3000 3500
Impro
ved
MO
S
Downlink datarate (Kbps)
(a) Phone@daytime
0
1
2
3
4
5
500 1000 1500 2000 2500 3000 3500
Impro
ved
MO
S
Downlink datarate (Kbps)
MAXSIGOASIS
0
1
2
3
4
5
500 1000 1500 2000 2500 3000 3500
Impro
ved
MO
S
Downlink datarate (Kbps)
0
1
2
3
4
5
500 1000 1500 2000 2500 3000 3500
Impro
ved
MO
S
Downlink datarate (Kbps)
(b) Phone@evening
0
1
2
3
4
5
500 1000 1500 2000 2500 3000 3500
Impro
ved
MO
SDownlink datarate (Kbps)
MAXSIGOASIS
0
1
2
3
4
5
500 1000 1500 2000 2500 3000 3500
Impro
ved
MO
SDownlink datarate (Kbps)
0
1
2
3
4
5
500 1000 1500 2000 2500 3000 3500
Impro
ved
MO
SDownlink datarate (Kbps)
(c) Tab@daytime
0
1
2
3
4
5
500 1000 1500 2000 2500 3000 3500
Impro
ved
MO
S
Downlink datarate (Kbps)
MAXSIGOASIS
0
1
2
3
4
5
500 1000 1500 2000 2500 3000 3500
Impro
ved
MO
S
Downlink datarate (Kbps)
0
1
2
3
4
5
500 1000 1500 2000 2500 3000 3500
Impro
ved
MO
S
Downlink datarate (Kbps)
(d) Tab@evening
Fig. 12. Improved MOS under a tolerable distance of 150 meters
Figure 12 shows the improved MOS under OASIS andMAXSIG when the user is unwilling to travel beyond 150meters. In most cases, OASIS achieves the largest MOSimprovement because it tries to find a location whose datarate > 3220 Kbps if possible; otherwise, it tends to search fora nearby location with a high data rate. With the MOS func-tion adjusted, OASIS can achieve modest MOS improve-ments (between 2 and 4) sometimes. The exceptions withMOS gains below 1 are mainly because the original MOSvalues are already large enough or the user is unwilling totravel longer distances. Moreover, there are more exceptionsin Figures 12(a) and 12(b) than in Figures 12(c) and 12(d)because it is quite difficult to find a location whose data rate> 2500 Kbps within 150 meters for the smartphone. Figures12(c) and 12(d) only have few points because the tablet hasalready achieved a data rate> 3220 Kbps (which implies themaximum MOS value) at many original locations. AlthoughMAXSIG recommends accessible locations regardless of thetravel distances, in most cases, it achieves modest MOS im-provements (instead of the largest MOS improvement). Thisis particularly obvious when other users share the limiteddata rates simultaneously at the recommended locations, asshown by the results in Figures 12(a) and 12(b).
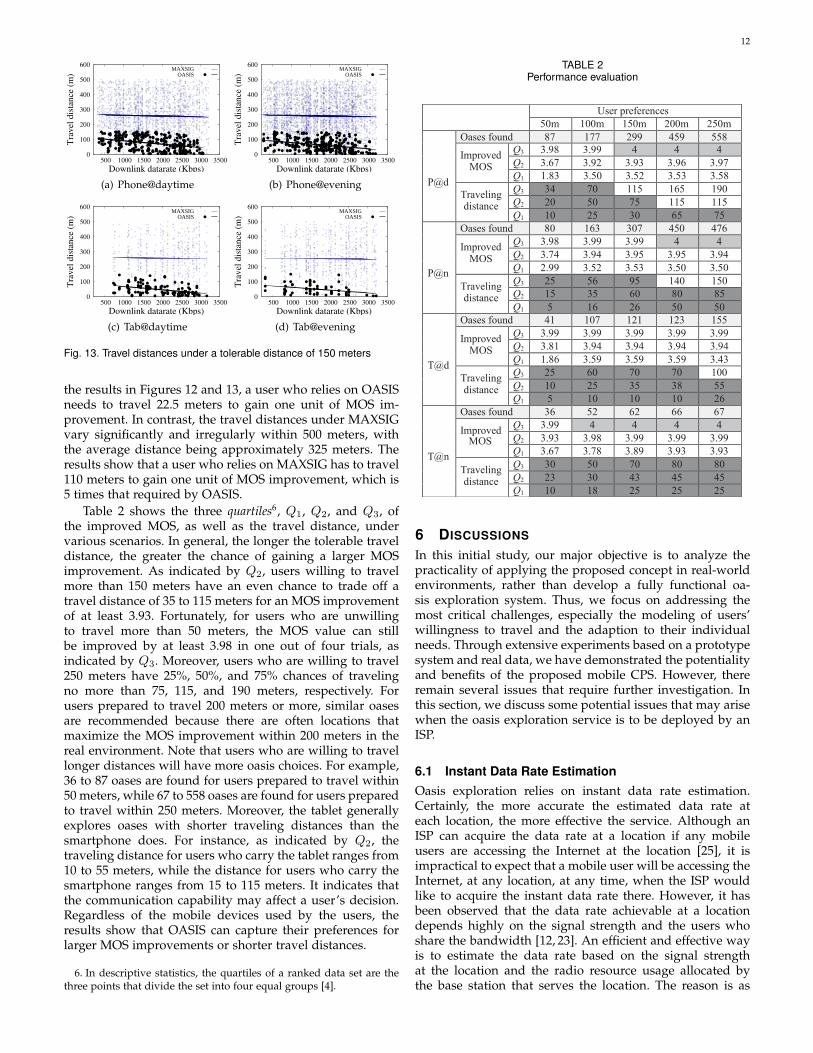
Figure 13 shows the travel distances under OASIS andMAXSIG when the user is unwilling to travel beyond 150meters. Nearly all the locations found by OASIS are within150 meters, which indicates that OASIS is capable of de-termining the user’s travel intention. More interestingly,the average travel distance decreases with the downlinkdata rate at the original location. In other words, OASIScan capture the user’s unwillingness to travel far when theperceptual quality at the original location is relatively good.The average travel distance is approximately 83 meterswhen the data rate at the original location is low, but it is lessthan 12.5 meters when the data rate is high. According to
12
0
100
200
300
400
500
600
500 1000 1500 2000 2500 3000 3500
Tra
vel
dis
tance
(m
)
Downlink datarate (Kbps)
MAXSIGOASIS
(a) Phone@daytime
0
100
200
300
400
500
600
500 1000 1500 2000 2500 3000 3500
Tra
vel
dis
tance
(m
)
Downlink datarate (Kbps)
MAXSIGOASIS
(b) Phone@evening
0
100
200
300
400
500
600
500 1000 1500 2000 2500 3000 3500
Tra
vel
dis
tance
(m
)
Downlink datarate (Kbps)
MAXSIGOASIS
(c) Tab@daytime
0
100
200
300
400
500
600
500 1000 1500 2000 2500 3000 3500
Tra
vel
dis
tance
(m
)
Downlink datarate (Kbps)
MAXSIGOASIS
(d) Tab@evening
Fig. 13. Travel distances under a tolerable distance of 150 meters
the results in Figures 12 and 13, a user who relies on OASISneeds to travel 22.5 meters to gain one unit of MOS im-provement. In contrast, the travel distances under MAXSIGvary significantly and irregularly within 500 meters, withthe average distance being approximately 325 meters. Theresults show that a user who relies on MAXSIG has to travel110 meters to gain one unit of MOS improvement, which is5 times that required by OASIS.
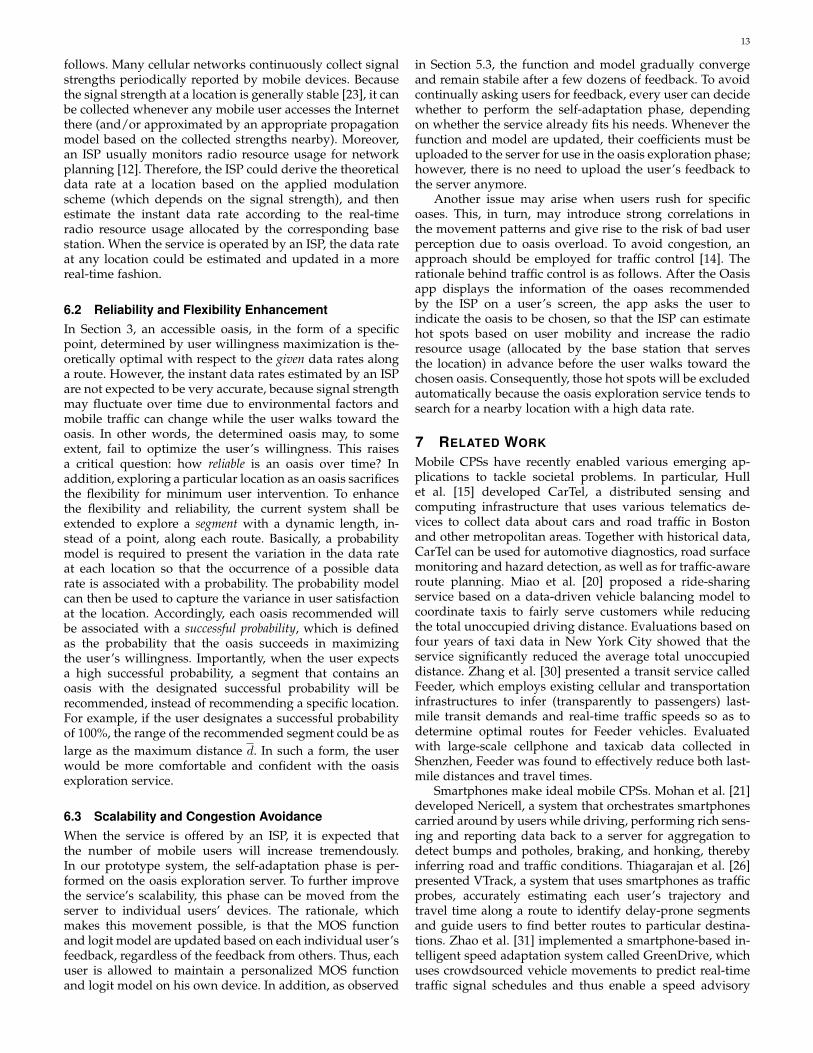
Table 2 shows the three quartiles6, Q1, Q2, and Q3, ofthe improved MOS, as well as the travel distance, undervarious scenarios. In general, the longer the tolerable traveldistance, the greater the chance of gaining a larger MOSimprovement. As indicated by Q2, users willing to travelmore than 150 meters have an even chance to trade off atravel distance of 35 to 115 meters for an MOS improvementof at least 3.93. Fortunately, for users who are unwillingto travel more than 50 meters, the MOS value can stillbe improved by at least 3.98 in one out of four trials, asindicated by Q3. Moreover, users who are willing to travel250 meters have 25%, 50%, and 75% chances of travelingno more than 75, 115, and 190 meters, respectively. Forusers prepared to travel 200 meters or more, similar oasesare recommended because there are often locations thatmaximize the MOS improvement within 200 meters in thereal environment. Note that users who are willing to travellonger distances will have more oasis choices. For example,36 to 87 oases are found for users prepared to travel within50 meters, while 67 to 558 oases are found for users preparedto travel within 250 meters. Moreover, the tablet generallyexplores oases with shorter traveling distances than thesmartphone does. For instance, as indicated by Q2, thetraveling distance for users who carry the tablet ranges from10 to 55 meters, while the distance for users who carry thesmartphone ranges from 15 to 115 meters. It indicates thatthe communication capability may affect a user’s decision.Regardless of the mobile devices used by the users, theresults show that OASIS can capture their preferences forlarger MOS improvements or shorter travel distances.
6. In descriptive statistics, the quartiles of a ranked data set are thethree points that divide the set into four equal groups [4].
TABLE 2Performance evaluation
User preferences
50m 100m 150m 200m 250m
P@d
Oases found 87 177 299 459 558 Improved
MOS
Q3 3.98 3.99 4 4 4
Q2 3.67 3.92 3.93 3.96 3.97
Q1 1.83 3.50 3.52 3.53 3.58
Traveling distance
Q3 34 70 115 165 190
Q2 20 50 75 115 115
Q1 10 25 30 65 75
P@n
Oases found 80 163 307 450 476 Improved
MOS
Q3 3.98 3.99 3.99 4 4
Q2 3.74 3.94 3.95 3.95 3.94
Q1 2.99 3.52 3.53 3.50 3.50
Traveling distance
Q3 25 56 95 140 150
Q2 15 35 60 80 85
Q1 5 16 26 50 50
T@d
Oases found 41 107 121 123 155 Improved
MOS
Q3 3.99 3.99 3.99 3.99 3.99
Q2 3.81 3.94 3.94 3.94 3.94
Q1 1.86 3.59 3.59 3.59 3.43
Traveling distance
Q3 25 60 70 70 100
Q2 10 25 35 38 55
Q1 5 10 10 10 26
T@n
Oases found 36 52 62 66 67 Improved
MOS
Q3 3.99 4 4 4 4
Q2 3.93 3.98 3.99 3.99 3.99
Q1 3.67 3.78 3.89 3.93 3.93
Traveling distance
Q3 30 50 70 80 80
Q2 23 30 43 45 45
Q1 10 18 25 25 25
6 DISCUSSIONS
In this initial study, our major objective is to analyze thepracticality of applying the proposed concept in real-worldenvironments, rather than develop a fully functional oa-sis exploration system. Thus, we focus on addressing themost critical challenges, especially the modeling of users’willingness to travel and the adaption to their individualneeds. Through extensive experiments based on a prototypesystem and real data, we have demonstrated the potentialityand benefits of the proposed mobile CPS. However, thereremain several issues that require further investigation. Inthis section, we discuss some potential issues that may arisewhen the oasis exploration service is to be deployed by anISP.
6.1 Instant Data Rate EstimationOasis exploration relies on instant data rate estimation.Certainly, the more accurate the estimated data rate ateach location, the more effective the service. Although anISP can acquire the data rate at a location if any mobileusers are accessing the Internet at the location [25], it isimpractical to expect that a mobile user will be accessing theInternet, at any location, at any time, when the ISP wouldlike to acquire the instant data rate there. However, it hasbeen observed that the data rate achievable at a locationdepends highly on the signal strength and the users whoshare the bandwidth [12, 23]. An efficient and effective wayis to estimate the data rate based on the signal strengthat the location and the radio resource usage allocated bythe base station that serves the location. The reason is as
13
follows. Many cellular networks continuously collect signalstrengths periodically reported by mobile devices. Becausethe signal strength at a location is generally stable [23], it canbe collected whenever any mobile user accesses the Internetthere (and/or approximated by an appropriate propagationmodel based on the collected strengths nearby). Moreover,an ISP usually monitors radio resource usage for networkplanning [12]. Therefore, the ISP could derive the theoreticaldata rate at a location based on the applied modulationscheme (which depends on the signal strength), and thenestimate the instant data rate according to the real-timeradio resource usage allocated by the corresponding basestation. When the service is operated by an ISP, the data rateat any location could be estimated and updated in a morereal-time fashion.
6.2 Reliability and Flexibility EnhancementIn Section 3, an accessible oasis, in the form of a specificpoint, determined by user willingness maximization is the-oretically optimal with respect to the given data rates alonga route. However, the instant data rates estimated by an ISPare not expected to be very accurate, because signal strengthmay fluctuate over time due to environmental factors andmobile traffic can change while the user walks toward theoasis. In other words, the determined oasis may, to someextent, fail to optimize the user’s willingness. This raisesa critical question: how reliable is an oasis over time? Inaddition, exploring a particular location as an oasis sacrificesthe flexibility for minimum user intervention. To enhancethe flexibility and reliability, the current system shall beextended to explore a segment with a dynamic length, in-stead of a point, along each route. Basically, a probabilitymodel is required to present the variation in the data rateat each location so that the occurrence of a possible datarate is associated with a probability. The probability modelcan then be used to capture the variance in user satisfactionat the location. Accordingly, each oasis recommended willbe associated with a successful probability, which is definedas the probability that the oasis succeeds in maximizingthe user’s willingness. Importantly, when the user expectsa high successful probability, a segment that contains anoasis with the designated successful probability will berecommended, instead of recommending a specific location.For example, if the user designates a successful probabilityof 100%, the range of the recommended segment could be aslarge as the maximum distance d. In such a form, the userwould be more comfortable and confident with the oasisexploration service.
6.3 Scalability and Congestion AvoidanceWhen the service is offered by an ISP, it is expected thatthe number of mobile users will increase tremendously.In our prototype system, the self-adaptation phase is per-formed on the oasis exploration server. To further improvethe service’s scalability, this phase can be moved from theserver to individual users’ devices. The rationale, whichmakes this movement possible, is that the MOS functionand logit model are updated based on each individual user’sfeedback, regardless of the feedback from others. Thus, eachuser is allowed to maintain a personalized MOS functionand logit model on his own device. In addition, as observed
in Section 5.3, the function and model gradually convergeand remain stabile after a few dozens of feedback. To avoidcontinually asking users for feedback, every user can decidewhether to perform the self-adaptation phase, dependingon whether the service already fits his needs. Whenever thefunction and model are updated, their coefficients must beuploaded to the server for use in the oasis exploration phase;however, there is no need to upload the user’s feedback tothe server anymore.
Another issue may arise when users rush for specificoases. This, in turn, may introduce strong correlations inthe movement patterns and give rise to the risk of bad userperception due to oasis overload. To avoid congestion, anapproach should be employed for traffic control [14]. Therationale behind traffic control is as follows. After the Oasisapp displays the information of the oases recommendedby the ISP on a user’s screen, the app asks the user toindicate the oasis to be chosen, so that the ISP can estimatehot spots based on user mobility and increase the radioresource usage (allocated by the base station that servesthe location) in advance before the user walks toward thechosen oasis. Consequently, those hot spots will be excludedautomatically because the oasis exploration service tends tosearch for a nearby location with a high data rate.
7 RELATED WORK
Mobile CPSs have recently enabled various emerging ap-plications to tackle societal problems. In particular, Hullet al. [15] developed CarTel, a distributed sensing andcomputing infrastructure that uses various telematics de-vices to collect data about cars and road traffic in Bostonand other metropolitan areas. Together with historical data,CarTel can be used for automotive diagnostics, road surfacemonitoring and hazard detection, as well as for traffic-awareroute planning. Miao et al. [20] proposed a ride-sharingservice based on a data-driven vehicle balancing model tocoordinate taxis to fairly serve customers while reducingthe total unoccupied driving distance. Evaluations based onfour years of taxi data in New York City showed that theservice significantly reduced the average total unoccupieddistance. Zhang et al. [30] presented a transit service calledFeeder, which employs existing cellular and transportationinfrastructures to infer (transparently to passengers) last-mile transit demands and real-time traffic speeds so as todetermine optimal routes for Feeder vehicles. Evaluatedwith large-scale cellphone and taxicab data collected inShenzhen, Feeder was found to effectively reduce both last-mile distances and travel times.
Smartphones make ideal mobile CPSs. Mohan et al. [21]developed Nericell, a system that orchestrates smartphonescarried around by users while driving, performing rich sens-ing and reporting data back to a server for aggregation todetect bumps and potholes, braking, and honking, therebyinferring road and traffic conditions. Thiagarajan et al. [26]presented VTrack, a system that uses smartphones as trafficprobes, accurately estimating each user’s trajectory andtravel time along a route to identify delay-prone segmentsand guide users to find better routes to particular destina-tions. Zhao et al. [31] implemented a smartphone-based in-telligent speed adaptation system called GreenDrive, whichuses crowdsourced vehicle movements to predict real-timetraffic signal schedules and thus enable a speed advisory
14
service that reduces unnecessary accelerations and stops toreduce fuel consumption while meeting travel time require-ments. The above mobile CPSs do not require modeling hu-man mentality, such as user willingness, and little attentionhas been paid to human feedback that would allow for self-adaptation to users’ needs.
To mitigate the bandwidth shortage problem in cellularnetworks, it was recently advocated that ISPs should movetowards time-dependent pricing by providing incentive pricesto users for transferring their data traffic from peak to off-peak periods, thereby better managing the growing demandfor bandwidth [10, 11]. The rationale behind the notion isthat many mobile applications do not require real-time datatransfer and can be deferred to less-congested periods. Thus,an ISP can flatten the temporal distribution of demand forbandwidth by offering reduced prices to motivate users toshift their data traffic in the timeline. Ha et al. [11] pre-sented an architecture and implementation of a functionalprototype, called TUBE, to realize time-dependent pricingfor mobile data and conduct an experimental study. The trialresults showed that TUBE benefits both ISPs and end users,allowing users to save money while ISPs flatten the tem-poral demand for bandwidth. Gabale et al. [10] applied thesame concept to video content delivery. An asynchronousdelivery system, called Async, was developed to demon-strate that leveraging the delivery times and prices cansignificantly improve overall user satisfaction with videoplayback. The results indicate that users are willing to shifttheir traffic if proper incentives are provided. The “time-shifting” solution can alleviate the bandwidth pressure inhot zones, but not in null zones. Motivated by the aboveresults, we propose a “space-shifting” solution wherebyusers move from those zones to nearby accessible locationsand realize the notion by a mobile CPS called Oasis. Time-dependent pricing and oasis exploration are orthogonalto each other, thereby alleviating the bandwidth shortageproblem in the time and space domains respectively.
8 CONCLUDING REMARKS
We have presented a mobile CPS, called Oasis, to exploreaccessible locations for delay-sensitive mobile application.Oasis models an underlying optimization problem to maxi-mize a user’s willingness to travel to a nearby location in ex-change for better perceptual quality of the used application.The application’s perceptual quality and the user’s travelintention are characterized respectively by a self-adaptiveMOS function and logit model. To validate the CPS sys-tem’s practicality, we designed a prototype implementation,which comprises an online server and a mobile app, to turntheoretical models into a practical oasis exploration service.Through extensive experiments based on real data collectedin downtown Taipei with commercial mobile devices, wedemonstrate that the service can often locate oases withinusers’ tolerable travel distances to significantly improve anapplication’s perceptual quality. Of course, the farther theuser is willing to travel, the greater will be the improvementin the perceptual quality. The experiment results also pro-vide valuable insights that will motivate further research.
In the future, we will address the reliability and con-gestion issues to further improve the OASIS system’s prac-ticality. We will also enhance our mobile app so that wecan crowdsource signal data more widely and frequently
from mobile users, like OpenSignalMaps. Commercializingthe service obviously involves addressing more challenges.We hope our initial efforts will stimulate further research.
ACKNOWLEDGMENT
This work was supported in part by the Project for ExcellentJunior Research Investigators, Ministry of Science and Tech-nology of Taiwan under Grant MOST 104-2628-E-001-003-MY3, as well as financially supported under Grant MOST105-2622-8-002-002 and sponsored by MediaTek Inc., Hsin-chu, Taiwan.
REFERENCES
[1] Alan Agresti. Categorical Data Analysis, pages 163–243. Wiley-Interscience, 3rd edition, 2012.
[2] Athula Balachandran, Vaneet Aggarwal, Emir Halepovic, JeffreyPang, Srinivasan Seshan Shobha Venkataraman, and He Yan.Modeling Web Quality-of-Experience on Cellular Networks. InProc. of ACM MobiCom, pages 213–224, 2014.
[3] Athula Balachandran, Vyas Sekar, Aditya Akella, Srinivasan Se-shan, Ion Stoica, and Hui Zhang. Developing a Predictive Modelof Quality of Experience for Internet Video. In Proc. of ACMSIGCOMM, pages 339–350, 2013.
[4] Adrian W. Bowman and Derek R. Robinson. Introduction toStatistics, page 23. Computer illustrated text. Taylor & Francis,1987.
[5] Chih-Chuan Cheng and Pi-Cheng Hsiu. Extend Your Journey:Introducing Signal Strength into Location-based Applications. InProc. of IEEE INFOCOM, pages 2742–2750, 2013.
[6] Chih-Chuan Cheng and Pi-Cheng Hsiu. Extend Your Journey:Considering Signal Strength and Fluctuation in Location-BasedApplications. IEEE/ACM Trans. on Networking, 23(2):451–464, 2015.
[7] Ning Ding, Daniel Wagner, Xiaomeng Chen, Abhinav Pathak,Y. Charlie Hu, and Andrew Rice. Characterizing and Modeling theImpact of Wireless Signal Strength on Smartphone Battery Drain.In Proc. of ACM SIGMETRICS, pages 29–40, 2013.
[8] Florin Dobrian, Vyas Sekar, Asad Awan, Ion Stoica, Dilip Joseph,Aditya Ganjam, Jibin Zhan, and Hui Zhang. Understanding theImpact of Video Quality on User Engagement. In Proc. of ACMSIGCOMM, pages 362–373, 2011.
[9] Sebastian Egger, Peter Reichl, Tobias Hossfeld, and RaimundSchatz. Time is Bandwidth? Narrowing the Gap between Sub-jective Time Perception and Quality of Experience. In proc. of IEEEICC, pages 1325–1330, 2012.
[10] Vijay Gabale, UmaMaheswari Devi, Ravi Kokku, Vinay Kolar,Mukundan Madhavan, and Shivkumar Kalyanaraman. Async:De-congestion and Yield Management in Cellular Data Networks.In Proc. of IEEE ICNP, pages 1–10, 2013.
[11] Sangtae Ha, Soumya Sen, Carlee Joe-Wong, Youngbin Im, andMung Chiang. TUBE: Time-dependent Pricing for Mobile Data.In Proc. of ACM SIGCOMM, pages 247–258, 2012.
[12] Harri Holma and Antti Toskala. WCDMA for UMTS: HSPAEvolution and LTE. John Wiley & Sons, Inc., 4th edition, 2007.
[13] Tobias Hoßfeld, Michael Seufert, Matthias Hirth, Thomas Zinner,Phuoc Tran-Gia, and Raimund Schatz. Quantification of YouTubeQoE via Crowdsourcing. In Proc. of IEEE ISM, pages 494–499, 2011.
[14] Sahar Hoteit, Stefano Secci, Guy Pujolle, Vinh Hoa La, CezaryZiemlicki, and Zbigniew Smoreda. Mobility-aware Estimation ofContent Consumption Hotspots for Urban Cellular Networks. InProc. of IEEE NOMS, pages 1–7, 2014.
[15] Bret Hull, Vladimir Bychkovsky, Yang Zhang, Kevin Chen, MichelGoraczko, Allen Miu, Eugene Shih, Hari Balakrishnan, andSamuel Madden. CarTel: A Distributed Mobile Sensor ComputingSystem. In Proc. of ACM SenSys, pages 125–138, 2006.
[16] ITU-T. Recommandation, P.800. Methods for Subjective Determi-nation of Transmission Quality. Technical report, InternationalTelecommunication Union, Aug. 1996.
15
[17] ITU-T. Recommendation, G.1030. Estimating End-To-End Perfor-mance in IP Networks for Data Applications. Technical report,International Telecommunication Union, Nov. 2005.
[18] S. Shunmuga Krishnan and Ramesh K. Sitaraman. Video StreamQuality Impacts Viewer Behavior: Inferring Causality UsingQuasi-experimental Designs. In Proc. of ACM IMC, pages 211–224,2012.
[19] Andreas Kunz, Athul Prasad, Konstantinos Samdanis, Syed Hu-sain, and JaeSeung Song. Enhanced 3GPP system for MachineType Communications and Internet of Things. In Proc. of IEEECSCN, pages 48–53, 2015.
[20] Fei Miao, Shuo Han, Abdeltawab M. Hendawi, Mohamed EKhalefa, John A. Stankovic, and George J. Pappas. Data-drivenDistributionally Robust Vehicle Balancing Using Dynamic RegionPartitions. In Proc. of ACM ICCPS, pages 261–271, 2017.
[21] Prashanth Mohan, Venkata N. Padmanabhan, and RamachandranRamjee. Nericell: Rich Monitoring of Road and Traffic ConditionsUsing Mobile Smartphones. In Proc. of ACM SenSys, pages 323–336, 2008.
[22] Christian Ritz and Jens Carl Streibig. Nonlinear Regression with R.Springer, 1st edition, 2008.
[23] Aaron Schulman, Vishnu Navda, Ramachandran Ramjee, NeilSpring, Pralhad Deshpande, Calvin Grunewald, Kamal Jain, andVenkata N. Padmanabhan. Bartendr: A Practial Approach toEnergy-aware Cellular Data Scheduling. In Proc. of ACM MobiCom,pages 85–96, 2010.
[24] Muhammad Zubair Shafiq, Jeffrey Erman, Lusheng Ji, Alex X. Liu,Jeffrey Pang, and Jia Wang. Understanding the Impact of NetworkDynamics on Mobile Video User Engagement. In Proc. of ACMSIGCOMM, pages 367–379, 2014.
[25] Muhammad Zubair Shafiq, Lusheng Ji, Alex X. Liu, Jeffrey Pang,and Jia Wang. Characterizing Geospatial Dynamics of ApplicationUsage in a 3G Cellular Data Network. In Proc. of IEEE INFOCOM,pages 1341–1349, 2012.
[26] Arvind Thiagarajan, Lenin Ravindranath, Katrina LaCurts,Samuel Madden, Hari Balakrishnan, Sivan Toledo, and JakobEriksson. VTrack: Accurate, Energy-aware Road Traffic DelayEstimation Using Mobile Phones. In Proc. of ACM SenSys, pages85–98, 2009.
[27] Ionut Trestian, Supranamaya Ranjan, Aleksandar Kuzmanovic,and Antonio Nucci. Taming the Mobile Data Deluge with DropZones. IEEE/ACM Trans. on Networking, 20(4):1010–1023, Jun. 2012.
[28] Fung Po Tso, Jin Teng, Weijia Jia, and Dong Xuan. Mobility: ADouble-Edged Sword for HSPA Networks: A Large-Scale Test onHong Kong Mobile HSPA Networks. IEEE Trans. on Parallel andDistributed Systems, 23(10):1895–1907, 2012.
[29] Sanford Weisberg. Applied Linear Regression, pages 115–146. JohnWiley & Sons, Inc., 3rd edition, 2005.
[30] Desheng Zhang, Juanjuan Zhao, Fan Zhang, Ruobing Jiang, TianHe, and Nikos Papanikolopoulos. Last-Mile Transit Service withUrban Infrastructure Data. ACM Trans. on Cyber-Physical Systems,1(2):6:1–6:26, Nov. 2016.
[31] Yiran Zhao, Shen Li, Shaohan Hu, Lu Su, Shuochao Yao, Hua-jie Shao, Hongwei Wang, and Tarek Abdelzaher. GreenDrive:A Smartphone-based Intelligent Speed Adaptation System withReal-time Traffic Signal Prediction. In Proc. of ACM ICCPS, pages229–238, 2017.
Chih-Chuan Cheng received the B.S. degreefrom Minghsin University of Science and Tech-nology, Taiwan, in 2000, and the M.S. and Ph.D.degrees from National Chung Cheng University(NCCU), Taiwan, in 2005 and 2011, respectively,all in electrical engineering. He is currently aSenior Software Engineer with MediaTek Inc. In2010, he was a visiting Ph.D. student with theDepartment of Electrical and Computer Engi-neering, San Diego State University, USA. From2011 to 2015, he was a Postdoctoral Fellow with
the Research Center for Information Technology Innovation, AcademiaSinica, Taiwan. His research interests include wireless networks andmobile systems.
Pi-Cheng Hsiu received the B.S. degree in com-puter information science from National ChiaoTung University, Taiwan, in 2002, and the M.S.and Ph.D. degrees in computer science and in-formation engineering from National Taiwan Uni-versity, Taiwan, in 2004 and 2009, respectively.He is currently a Research Fellow and DeputyDirector of the Research Center for InformationTechnology Innovation (CITI), where he leadsthe Embedded and Mobile Computing Labora-tory (EMCLab), and is also a Joint Research
Fellow with the Institute of Information Science (IIS), Academia Sinica,Taiwan. He was a Visiting Scholar with the Department of Computer Sci-ence, University of Illinois at Urbana-Champaign, USA, in 2007. Dr. Hsiujoined CITI as an Assistant Research Fellow in 2009, and was promotedto an Associate Research Fellow in 2013 and to a Research Fellow in2018. He serves as an Associate Editor of the ACM Transactions onCyber-Physical Systems and in the Organizing/Program Committees ofmany international conferences in his field, such as IEEE/ACM ISLPED.His research interests include embedded systems, mobile systems, andreal-time systems. He is a senior member of the IEEE and a seniormember of the ACM.
Ting-Kuei Hu received the B.S. degree in elec-tronic engineering from National Chiao Tung Uni-versity in 2014. He is currently a Research As-sistant with the Research Center for Informa-tion Technology Innovation, Academia Sinica,Taiwan. His research interests include mobilesystems and machine learning.
Tei-Wei Kuo received his B.S. and Ph.D. de-grees in computer science from National TaiwanUniversity, Taiwan, and the University of Texasat Austin, USA, in 1986 and 1994, respectively.He is a Distinguished Professor of the Depart-ment of Computer Science and Information En-gineering, where he served as the DepartmentChairman from 2005 to 2008, and the Execu-tive Vice President for Academics and Research,National Taiwan University. Prof. Kuo was a Dis-tinguished Research Fellow and the Director of
the Research Center for Information Technology Innovation, AcademiaSinica, Taiwan, between 2015 and 2016, and the Program Director of theComputer Science Division of the Ministry of Science and Technologyfrom 2013 to 2015. He is an executive committee member of both theIEEE Technical Committee on Real-Time Systems and IEEE TechnicalCommittee on Cyber-Physical Systems and the Vice Chair of ACMSIGAPP. He serves as the Editor-in-Chief of the ACM Transactions onCyber-Physical Systems and in the editorial board of the Journal ofReal-Time Systems, IEEE Transactions on Industrial Informatics, andACM Transactions on Transactions on Design Automation of ElectronicSystems. He was the General Chair of the IEEE Real-Time SystemsSymposium (RTSS 2008) and serves in the Organizing/Program Com-mittees of many international conferences in his field. He receivedthe 2017 Outstanding Technical Achievement and Leadership Awardsof the IEEE Technical Committee on Real-Time Systems, the 2017Distinguished Leadership Award from the IEEE Technical Committeeon Cyber-Physical Systems, the TECO Award in 2015, the ROC TenYoung Outstanding Persons Award in 2004, the Young Scholar Re-search Award from Academia Sinica in 2001, and the DistinguishedResearch Award from the National Science Council/Ministry of Scienceand Technology for three times. His research areas include embeddedsystems, real-time systems, and non-volatile memory. He is a fellow ofthe IEEE and a fellow of the ACM.