1 perceived safety and separated bike lanes in the midwest
TRANSCRIPT

1
Perceived Safety and Separated Bike Lanes in the Midwest: Results from a Roadway Design 1
Survey in Michigan 2
3
Rebecca L. Sanders, PhD* 4
Toole Design Group, LLC 6
319 SW Washington Street, Suite 800 7
Portland, OR 97204 8
Tel: 503-205-4607 9
10
Belinda Judelman 11
Toole Design Group, LLC 13
319 SW Washington Street, Suite 800 14
Portland, OR 97204 15
Tel: 503-205-4607 16
17
*Corresponding author 18
19
20
21
22
23
24
25
26
27
28
29
30
31
32
33
34
Word count: 5746 words + 7 figures and tables (1750words) = 7496 words 35

2
ABSTRACT 1
This article presents the results of an address-based sample survey (n=351) conducted in the fall of 2
2016 for the Michigan Department of Transportation (MDOT) as part of an effort to provide 3
guidance for building sidepaths. The survey investigated attitudes toward bicycling among drivers 4
and bicyclists, bicycling habits, barriers to bicycling, and roadway design preferences regarding 5
bicycle infrastructure in Michigan. In particular, this survey explored design preferences while 6
bicycling with children, bicycling by oneself, and driving. 7
Safety emerged as a key barrier to cycling, as did distance, weather, and the difficulty of carrying 8
things or traveling with others. Roadway design preferences were clearly weighted toward greater 9
separation when sharing the roadway whether as a bicyclist or a driver, and this trend was most 10
pronounced (p<0.001) when considering bicycling with children. In all cases, ratings for one-way 11
separated bike lanes were similar to those for sidepaths, suggesting that separated bike lanes could 12
be a key part of addressing safety and comfort concerns of more cautious riders. Preferences for 13
separation were strongly associated with perceived safety as a barrier. These results were even 14
stronger for non-transport cyclists, although all groups, regardless of frequency or type of cycling, 15
preferred more separation. 16
These results corroborate past research and add compelling evidence for separated facilities as a key 17
part of expanding the potential for bicycling trips in general, and particularly with children. The 18
survey findings will inform guidance about sidepath design for MDOT. 19
20
21
22
23
24
25
26
27

3
1. INTRODUCTION 1
The last two decades have seen tremendous growth in bicycling in the U.S. In the last decade alone, 2
major U.S. cities have experienced an average 47 percent increase in bike commuting (1). In some 3
cities, such as Lexington, Kentucky, and Portland, Oregon, the percentage of bike commuters has 4
grown over 300 percent since 2000, and many other U.S. cities have seen growth in excess of 100-5
200 percent (2). This trend toward increased cycling has led to a need to better understand how to 6
accommodate bicyclists into streets historically designed for the car. Additionally, cities attempting 7
to encourage bicycling are exploring ways to make cycling more attractive for the “interested but 8
concerned” cyclists, which many see as key to increasing cycling mode share (3). 9
This paper presents findings from research examining roadway design preferences when bicycling 10
with children, bicycling alone, and driving on multi-lane, commercial streets. The findings are 11
based on results from a recent survey exploring attitudes toward driving and bicycling, bicycling 12
habits, barriers to bicycling, and roadway design preferences among Michigan residents. The results 13
corroborate past research findings on bicyclists’ and drivers’ roadway design preferences, and 14
contribute a new understanding of design preferences for bicyclists specifically traveling with 15
children. These findings also clearly tie perceived safety to preferences, and support an alignment 16
between roadway users for design preferences, with both drivers and cyclists—regardless of cycling 17
frequency or type of bicycling—preferring greater separation on the roadway. 18
19
2. LITERATURE REVIEW 20
2.1 Barriers to Bicycling 21
Research on barriers to bicycling in North America has documented strong desires for additional 22
bicycle facilities. For example, in their 2009 online survey of 1,605 Texas cyclists, Sener, Uluru, 23
and Bhat found that nearly 80 percent of respondents characterized the overall quality of bicycle 24
facilities in their communities as “inadequate” or “very inadequate” (4). Similarly, Dill and Voros 25
conducted a telephone survey of 566 Portland residents, and found that 37 percent of those who 26
wanted to bicycle more reported that there were not enough bike lanes or trails near where they 27
wanted to go (5). In their adaptive stated preference survey of 167 University of Minnesota 28
employees, Tilahun, Levinson, and Krizek found that the presence of a bicycle lane had a much 29
greater impact on the odds of choosing a facility than did the elimination of on-street parking or the 30
presence of an off-road facility (6). This pattern was magnified among women, and was not 31
significantly tied to cycling experience. 32
2.2 Bicyclists’ Roadway Design Preferences 33
More recent research has focused specifically on roadway design preferences. In their survey of 34
1,402 Vancouver cyclists (all experience levels, including potential cyclists), Winters and Teschke 35
found that off-street paths were the most preferred by all cyclist types, while major city streets 36
without bicycle facilities were the least preferred. Barrier-separated cycle paths next to major streets 37
were the fourth-ranked option for potential and occasional cyclists, and ranked second and third, 38
respectively, for regular and frequent cyclists (7). A telephone survey of 908 residents from 39
Portland, Oregon, found similarly strong preferences—particularly among potential cyclists and 40
women—for separated bicycle facilities (8). These results were corroborated by a more recent 41

4
survey of nearly 2,300 residents in five major U.S. cities (9). A separate national study of 3,000 1
people in 50 major U.S. cities found that the “interested but concerned” group of cyclists strongly 2
preferred separation in the form of a path or trail over a major street with a striped bike lane (3). 3
Research on route choice supports these preferences. Winters et al. examined the routes of 74 4
participants to determine the distance people detour from the shortest path to use a bicycle facility 5
(10). They found that bike trips were significantly more likely to occur along routes with enhanced 6
bicycle facilities including traffic calming, stencils, and signage; while only 21 percent of trips 7
would be along designated bike routes in a shortest path scenario, on average, 49 percent of actual 8
trip distance took place along a bike route. Broach, Dill and Gliebe used GPS monitors to gather 9
data on the routes of 164 cyclists over several days in Portland, Oregon. After modeling the results 10
to account for trade-offs in topography, traffic volumes, and street network characteristics, they 11
found that cyclists travel out of their way to reach bicycle infrastructure, and particularly bicycle 12
boulevards (11). 13
2.3 Gap in the Literature 14
Knowing cyclists’ roadway design preferences is critical to encouraging more cycling, but research 15
has not always examined these preferences in a nuanced way. For example, a person may prefer the 16
most direct route when commuting, but may prioritize roads with low-stress bicycle facilities when 17
riding with children. Furthermore, given the needs of practitioners to plan for all modes, they also 18
need to know how motorists who share the road with bicyclists view various design options. Few 19
studies have examined drivers’ design preferences, although Sanders (12) found strong preferences 20
for separation among both drivers and bicyclists in the SF Bay Area. The research presented in this 21
paper strengthens the findings about drivers’ roadway design preferences and contributes to a 22
nuanced understanding of bicyclists’ design preferences, including how they differ when bicycling 23
by oneself versus with children. 24
25
3. METHODOLOGY 26
3.1 Survey Construction and Recruitment 27
The findings presented in this paper are based on research conducted as part of a larger project to 28
develop design guidance for sidepaths for the Michigan Department of Transportation (MDOT). 29
The survey was developed based on past research on attitudes, behavior, and roadway design 30
preferences (3, 12) and was designed to take 10-15 minutes to complete. The survey focused on 31
drivers and bicyclists in order to capture as wide of an audience as possible, and because conflicts 32
on sidepaths often involve motor vehicles. An effort was made to collaborate with related national 33
research (NCHRP 08-102), and the Michigan survey modeled the NHCRP survey where feasible. In 34
particular, the survey graphics were almost all developed by the NCHRP team (13). This 35
collaboration will allow for certain responses to be compared to a larger sample from around the 36
country, which may ultimately enhance the reach of the end-user tool. More detail about the entire 37
project, including a copy of the survey, can be found in the related MDOT report (14). 38
In October of 2016, approximately 5,000 letters printed in both English and Spanish were mailed to 39
a random selection of Michigan residents who were in the telephone directory asking them to take 40

5
the survey. To increase the likelihood that recipients would open the letters, the research team hand-1
addressed each envelope and used first-class stamps. The letter explained the purpose of the survey 2
and directed the recipients to the website www.michdrivebike.org, where there was a link to take 3
the survey in either English or Spanish; recipients could also request a paper copy of the survey. 4
The first 250 respondents were offered a $5 “gourmet coffee” gift card upon completion of the 5
survey; the remaining respondents were entered into a raffle for one of twenty $5 gift cards. 6
Respondents were given two weeks to respond to the survey, and two reminder postcards were sent 7
out, approximately six days apart. To mitigate potential response bias, the letter requested that only 8
the person in the household whose birthday was most recent and who was at least age 18 take the 9
survey. 10
Seven pairs of duplicates were detected, after which one of each pair was randomly removed from 11
the sample. The final cleaned sample contained 351 respondents, resulting in a 4.9 percent response 12
rate. Guidance on surveys suggests that this percentage is well within the range of what one can 13
expect from a mail survey (15). 14
3.2 Respondent Cyclist Typology 15
To facilitate analysis, respondents were categorized according to how often they bicycled for 16
“work/school”, “transportation other than to work or school (e.g., errands)”, and recreation or 17
exercise. The categories equated to the following: 18
Frequent cyclist (n=116): Respondent who reported bicycling at least once a week for any purpose 19
(transportation, recreation, or exercise), and not being “absolutely limited” by not having a bike or 20
not knowing how to ride a bike. 21
Occasional cyclist (n=83): Respondent who reported bicycling at least once a month (but less than 22
once a week) for any purpose, or reported biking at least once a week but also reported being 23
“absolutely limited” by not having a bike or not knowing how to bike. 24
Rare cyclist (n=93): Respondent who reported bicycling occasionally, but less than once a month 25
for any purpose. 26
Never cyclist (n=54): Respondent who reported never bicycling for any purpose; or who did not 27
indicate how often they bike for a particular purpose, but is either “absolutely limited” by not 28
knowing how to ride a bike or not owning a bike, or indicated that they “cannot bike at all”. 29
Five respondents were unable to be classified because they did not indicate: 1) how often they biked 30
for transportation, recreation, or exercise purposes, 2) whether they can ride a bike at all, or 3) 31
whether they are limited by not having a bike or not knowing how to bike. 32
The findings in this paper focus on roadway design preferences. Respondents were asked to 33
indicate their agreement or disagreement with comfort for 1) bicycling by oneself, 2) bicycling with 34
children, and 3) driving on a series of seven multi-lane, commercial roadway designs (with one two-35
lane exception). Agreement was measured on a five-part Likert scale, with a neutral option and the 36
modifier “completely” for the ends of the scale. The photos, displayed together in Figure 4 on p. 37
14, were manipulated via photo-editing software to show a variation on the original roadway 38
design. Respondents were presented with the photos one-by-one, and the photos were randomized 39
6
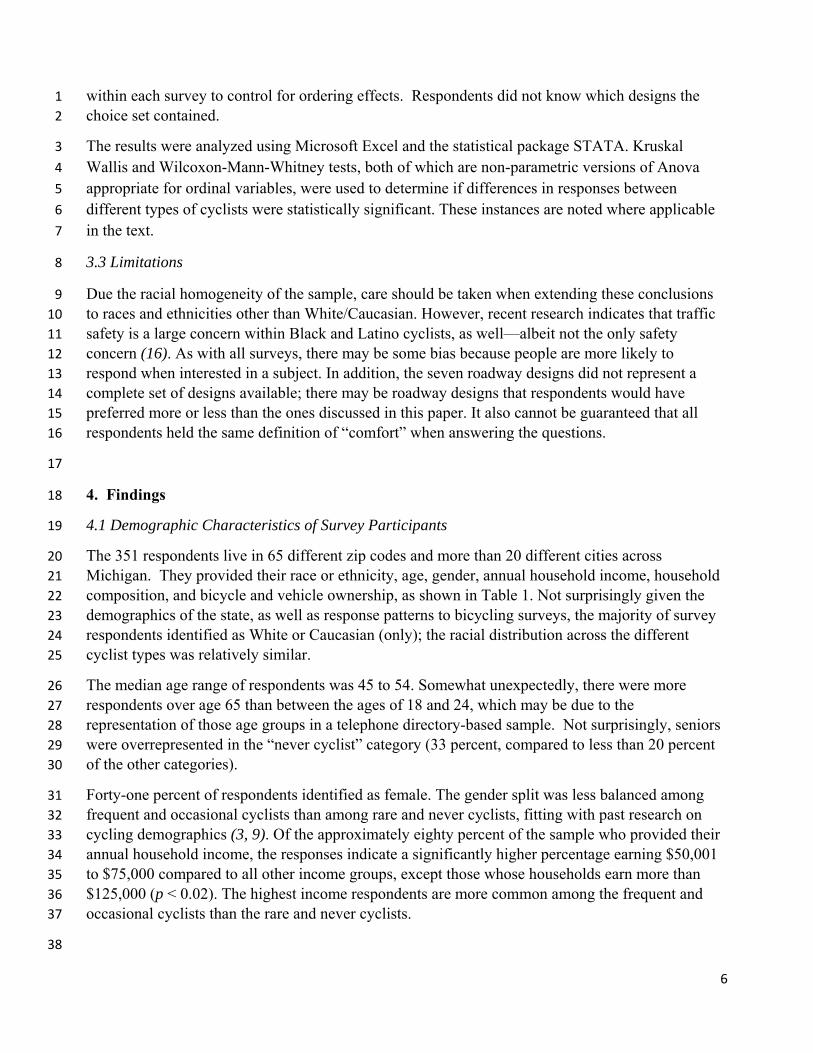
within each survey to control for ordering effects. Respondents did not know which designs the 1
choice set contained. 2
The results were analyzed using Microsoft Excel and the statistical package STATA. Kruskal 3
Wallis and Wilcoxon-Mann-Whitney tests, both of which are non-parametric versions of Anova 4
appropriate for ordinal variables, were used to determine if differences in responses between 5
different types of cyclists were statistically significant. These instances are noted where applicable 6
in the text. 7
3.3 Limitations 8
Due the racial homogeneity of the sample, care should be taken when extending these conclusions 9
to races and ethnicities other than White/Caucasian. However, recent research indicates that traffic 10
safety is a large concern within Black and Latino cyclists, as well—albeit not the only safety 11
concern (16). As with all surveys, there may be some bias because people are more likely to 12
respond when interested in a subject. In addition, the seven roadway designs did not represent a 13
complete set of designs available; there may be roadway designs that respondents would have 14
preferred more or less than the ones discussed in this paper. It also cannot be guaranteed that all 15
respondents held the same definition of “comfort” when answering the questions. 16
17
4. Findings 18
4.1 Demographic Characteristics of Survey Participants 19
The 351 respondents live in 65 different zip codes and more than 20 different cities across 20
Michigan. They provided their race or ethnicity, age, gender, annual household income, household 21
composition, and bicycle and vehicle ownership, as shown in Table 1. Not surprisingly given the 22
demographics of the state, as well as response patterns to bicycling surveys, the majority of survey 23
respondents identified as White or Caucasian (only); the racial distribution across the different 24
cyclist types was relatively similar. 25
The median age range of respondents was 45 to 54. Somewhat unexpectedly, there were more 26
respondents over age 65 than between the ages of 18 and 24, which may be due to the 27
representation of those age groups in a telephone directory-based sample. Not surprisingly, seniors 28
were overrepresented in the “never cyclist” category (33 percent, compared to less than 20 percent 29
of the other categories). 30
Forty-one percent of respondents identified as female. The gender split was less balanced among 31
frequent and occasional cyclists than among rare and never cyclists, fitting with past research on 32
cycling demographics (3, 9). Of the approximately eighty percent of the sample who provided their 33
annual household income, the responses indicate a significantly higher percentage earning $50,001 34
to $75,000 compared to all other income groups, except those whose households earn more than 35
$125,000 (p < 0.02). The highest income respondents are more common among the frequent and 36
occasional cyclists than the rare and never cyclists. 37
38

7
TABLE 1. Demographic Characteristics of Survey Participants by Cyclists Type 1
Demographic Characteristics Never
Cyclists (n=54)
Rare Cyclists (n=93)
Occasional Cyclists (n=83)
Frequent Cyclists (n=116)
Total (n=351)1
Age
18-24 4% 3% 0% 1% 2%
25-34 7% 22% 17% 14% 15%
35-44 11% 12% 24% 19% 17%
45-54 20% 23% 23% 22% 23%
55-64 22% 22% 23% 24% 23%
65+ 33% 17% 12% 19% 18%
Unknown 2% 2% 1% 2% 2%
Kruskal Wallis significant (p < 0.05)
Sex
Female 46% 52% 37% 31% 41%
Male 52% 46% 60% 68% 58%
Unknown 2% 2% 2% 1% 1%
Kruskal Wallis significant (p < 0.05)
Race/Ethnicity
White or Caucasian (only) 85% 81% 83% 83% 83%
Hispanic or Latino 2% 2% 4% 1% 2%
Black or African American 4% 1% 5% 3% 3%
Asian or Pacific Islander 0% 3% 4% 2% 2%
American Indian or Alaskan Native 2% 0% 0% 0% 0%
Multiracial 0% 3% 0% 2% 1%
Unknown 7% 10% 5% 10% 9%
Kruskal Wallis not significant
Annual Household Income
$30,000 or less 7% 10% 8% 3% 9%
$30,001 to $50,000 13% 13% 7% 15% 12%
$50,000 to $75,000 24% 20% 13% 20% 19%
$75,001 to $100,000 7% 15% 18% 9% 12%
$100,001 to $125,000 13% 14% 10% 12% 12%
More than $125,000 9% 8% 24% 22% 17%
Unknown 26% 20% 19% 20% 21%
Kruskal Wallis significant (p < 0.05)
Children ≤ Age 16 in Household
None 85% 73% 59% 73% 71%
At least one 15% 27% 40% 23% 27%
Unknown 0% 0% 1% 3% 2%
Kruskal Wallis significant (p < 0.01) 1 Total includes five respondents unable to be classified in the cyclist typology. 2
8
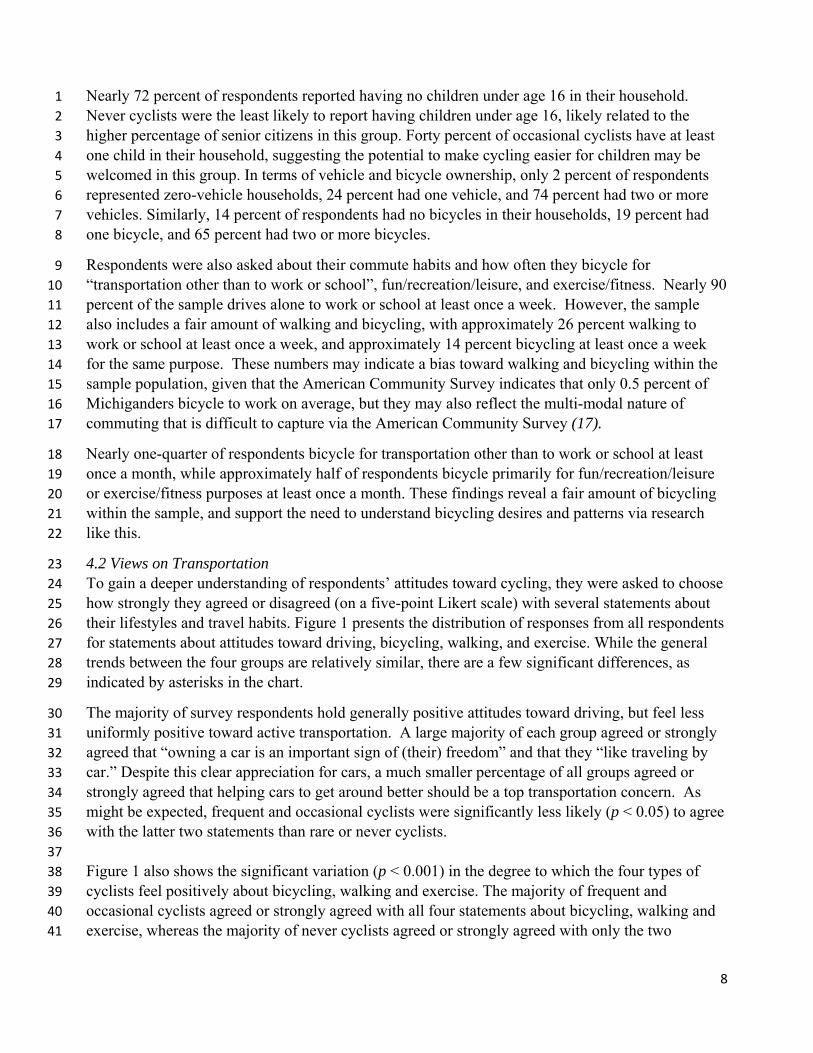
Nearly 72 percent of respondents reported having no children under age 16 in their household. 1
Never cyclists were the least likely to report having children under age 16, likely related to the 2
higher percentage of senior citizens in this group. Forty percent of occasional cyclists have at least 3
one child in their household, suggesting the potential to make cycling easier for children may be 4
welcomed in this group. In terms of vehicle and bicycle ownership, only 2 percent of respondents 5
represented zero-vehicle households, 24 percent had one vehicle, and 74 percent had two or more 6
vehicles. Similarly, 14 percent of respondents had no bicycles in their households, 19 percent had 7
one bicycle, and 65 percent had two or more bicycles. 8
Respondents were also asked about their commute habits and how often they bicycle for 9
“transportation other than to work or school”, fun/recreation/leisure, and exercise/fitness. Nearly 90 10
percent of the sample drives alone to work or school at least once a week. However, the sample 11
also includes a fair amount of walking and bicycling, with approximately 26 percent walking to 12
work or school at least once a week, and approximately 14 percent bicycling at least once a week 13
for the same purpose. These numbers may indicate a bias toward walking and bicycling within the 14
sample population, given that the American Community Survey indicates that only 0.5 percent of 15
Michiganders bicycle to work on average, but they may also reflect the multi-modal nature of 16
commuting that is difficult to capture via the American Community Survey (17). 17
Nearly one-quarter of respondents bicycle for transportation other than to work or school at least 18
once a month, while approximately half of respondents bicycle primarily for fun/recreation/leisure 19
or exercise/fitness purposes at least once a month. These findings reveal a fair amount of bicycling 20
within the sample, and support the need to understand bicycling desires and patterns via research 21
like this. 22
4.2 Views on Transportation 23
To gain a deeper understanding of respondents’ attitudes toward cycling, they were asked to choose 24
how strongly they agreed or disagreed (on a five-point Likert scale) with several statements about 25
their lifestyles and travel habits. Figure 1 presents the distribution of responses from all respondents 26
for statements about attitudes toward driving, bicycling, walking, and exercise. While the general 27
trends between the four groups are relatively similar, there are a few significant differences, as 28
indicated by asterisks in the chart. 29
The majority of survey respondents hold generally positive attitudes toward driving, but feel less 30
uniformly positive toward active transportation. A large majority of each group agreed or strongly 31
agreed that “owning a car is an important sign of (their) freedom” and that they “like traveling by 32
car.” Despite this clear appreciation for cars, a much smaller percentage of all groups agreed or 33
strongly agreed that helping cars to get around better should be a top transportation concern. As 34
might be expected, frequent and occasional cyclists were significantly less likely (p < 0.05) to agree 35
with the latter two statements than rare or never cyclists. 36
37
Figure 1 also shows the significant variation (p < 0.001) in the degree to which the four types of 38
cyclists feel positively about bicycling, walking and exercise. The majority of frequent and 39
occasional cyclists agreed or strongly agreed with all four statements about bicycling, walking and 40
exercise, whereas the majority of never cyclists agreed or strongly agreed with only the two 41

9
statements that did not focus on bicycling. Note the similarity in responses between enjoyment of 1
bicycling and wanting to “see more people bicycling in (their) city.” 2
3
FIGURE 1. Attitudes toward Driving, Bicycling, Walking, and Exercise, by Cyclist Type 4
5 *= p < 0.05, **= p < 0.01, and ***= p < 0.001 6 7
4.3 General Barriers to Bicycling 8
Respondents were also asked about general barriers to bicycling. Forty-three percent of respondents 9
agreed or strongly agreed that they would bicycle more if their friends or family came with them; 10
this seemed to be particularly salient for occasional cyclists. Only 38 percent of respondents agreed 11
or strongly agreed that they are often accompanied by children or older adults when they travel, but 12
more occasional cyclists (46 percent) expressed agreement with this statement than other groups. 13
Even fewer respondents (34 percent) agreed or strongly agreed that they live too far away from 14
things to walk or bicycle, although never cyclists were significantly more likely (p < 0.001) to agree 15
with this statement. The respondents clearly rejected the idea that bicycling was “odd” or a sign of 16
low income. 17
Respondents were also asked about concerns about bicycling, particularly with regard to safety. 18
Less than fifteen percent of each cyclist type agreed or strongly agreed that they would discourage 19
others from bicycling to work or school, although never cyclists were significantly more likely (p < 20
0.02) to agree with this statement than frequent cyclists. However, over forty percent of the sample 21
0% 20% 40% 60% 80% 100%
I would like to see more people bicycling in my city.***
I like the idea of sometimes walking or biking instead of takingthe car.***
Getting regular exercise is very important to me.***
I like bicycling.***
Our first concern for transportation should be helping cars getaround better.*
I like traveling by car.***
Owning a car is an important sign of my freedom.
Respondents who agree/completely agree
Frequent cyclist (n=116) Occasional cyclist (n=83) Rare cyclist (n=93) Never cyclist (n=54)
Attitudes toward driving
Attitudes toward active transportation

10
agreed or strongly agreed with the statement that “many bicyclists appear to have little regard for 1
their personal safety,” suggesting that behavioral trends may need to be further explored in 2
Michigan. Unsurprisingly, agreement differed by cycling frequency (45 percent of never cyclists as 3
compared to 29 percent of frequent cyclists). Moreover, the large majority (73 percent) of the 4
sample agreed or strongly agreed with the idea that “many drivers don’t seem to notice bicyclists,” 5
suggesting that people may not feel safe driving due to driver behavior. Interestingly, frequent 6
cyclists (65 percent agreement) were the least likely to agree with this statement. 7
4.4 Barriers to Bicycling to Work or School 8
Participants were also asked how much various factors limited their ability to bicycle to work or 9
school (options were “absolutely limits”, “limits quite a bit”, “limits somewhat”, or “does not 10
limit”). Figure 2 shows the percentage of each cyclist group that is limited “quite a bit” or 11
“absolutely” from biking to work or school by each barrier. The data indicate that safety, distance, 12
and weather concerns topped the list for occasional, rare, and never cyclists, while frequent cyclists 13
seemed more focused on safety and roadway/infrastructure conditions. In all instances, frequent 14
cyclists were the least likely to indicate being limited by the barriers, while never cyclists were 15
generally the most likely to indicate a higher level of limitation. However, other barriers are as 16
limiting to occasional or rare cyclists as they are to never cyclists, again suggesting that addressing 17
these barriers (e.g., building more high-quality infrastructure, teaching people how to dress for and 18
be safe while cycling in inclement weather) may encourage cycling within certain groups to 19
different degrees. Note that more cyclists of each type indicated that safety concerns were a barrier 20
than that a lack of bike lanes or trails was a barrier, although the difference between the two 21
diminishes with increasing cycling frequency. These findings suggest that the provision of bike 22
lanes and trails should be accompanied by more general traffic calming strategies where possible. 23
For example, bicycle boulevards—traffic-calmed neighborhood streets that prioritize bicycle 24
traffic—offer a potential solution to simultaneously address both barriers. 25
For the less limiting barriers in Figure 2, responses between groups varied significantly except 26
regarding security concerns about crime. Occasional cyclists were the most likely to indicate a 27
strong limitation in the case of negative effect on appearance and difficulty traveling with others, 28
but occasional and rare cyclists tend to feel similarly; a one-way ANOVA confirmed that there were 29
no significant differences between the responses of occasional and rare cyclists for any of the 30
barriers listed. 31
Note that the barrier of not having a bike/not knowing how to ride a bike was cited by some 32
respondents of each group, but overwhelmingly so by never cyclists. Only 20 percent of never 33
cyclists indicated via an earlier question that they cannot ride a bike, suggesting that this barrier 34
refers to not having a bicycle for the majority of never cyclists. 35
36
37
38
39
40

11
FIGURE 2. Strength of Barriers to Biking to Work/School, by Cyclist Type 1
2
*= p < 0.05, **= p < 0.01, and ***= p < 0.001 3 4
4.5 Factors that Would Encourage More Cycling 5
Participants were also asked to choose three changes that would encourage them to bicycle more in 6
their community (Figure 3). Seventy-five percent of all respondents indicated that the installation of 7
separated bicycle facilities would encourage them to bicycle more. Interestingly, rare cyclists were 8
more likely to choose this response than occasional cyclists, possibly corroborating past research 9
findings that a lack of perceived cycling comfort and safety is a critical barrier to increasing cycling 10
(5,12,18). The fact that about 72 percent of frequent cyclists also chose separated bike facilities 11
suggests that this lack of comfort and safety is experienced even by those who currently bicycle. 12
This connection between increased cycling and increased perceived safety and comfort is 13
0% 20% 40% 60% 80%
I do not have a bike/Don't know how to ride a bike***
It takes too much physical effort**
Need to make multiple trips during the day***
Negative effect on appearance (e.g., sweat, hair)**
Security concerns about crime
It is too slow***
Difficult to travel with others (children, older adults)**
Difficult to carry bags/heavy packages with me**
The location is too far to be reached by bicycle***
Weather (e.g., rain, heat, cold)***
Poor condition of roadways, bike lanes, or trails
Not enough bike lanes or trails
Safety concerns about riding in fast and/or busy traffic*
Respondents who are limited absolutely/limited quite a bit
Frequent cyclist (n=116) Occasional cyclist (n=83) Rare cyclist (n=93) Never cyclist (n=54)
Most
limiting
barriers
Least
limiting
barriers

12
underscored by the clear difference in the percentage of people who chose separated bike facilities 1
as compared to more bike facilities. This choice seems to be particularly salient for never and rare 2
cyclists, with almost twice as many choosing separated bike facilities over more facilities in 3
general. 4
In comparison, about half of respondents indicated that adding more bicycle facilities or a complete 5
bicycle network would encourage them to bicycle more, while a minority suggested that improved 6
law enforcement of motorist and cyclist behavior, respectively, would encourage them to bicycle 7
more. Increased law enforcement, easier access to education, and lower speed limits were unpopular 8
generally. As might be expected, never cyclists were more likely to choose increased law 9
enforcement of bicyclists over that of motorists, while frequent cyclists were much more likely to 10
choose the opposite. Overall, these findings indicate a clear preference for infrastructure in the form 11
of separated bike facilities and a complete bicycle network to encourage the sample population to 12
bicycle more often. 13
FIGURE 3. Factors that Would Encourage You to Bicycle More Often 14
15 ***p < 0.001 16 Notes: Separated bicycle facilities include those that provide increased separation from traffic (e.g., median, landscape 17 buffer, etc.). Percentages do not add up to 100 because respondents could choose up to three factors. 18 19
4.6 Confidence while Bicycling 20
Respondents were also asked how confident they felt riding a bicycle. Unsurprisingly, the majority 21
of frequent cyclists and occasional cyclists feel “very confident” riding a bicycle. Interestingly, 89 22
percent of rare cyclists feel at least “somewhat confident” riding a bicycle, as do 59 percent of never 23
cyclists, although the split between “very” and “somewhat” confident was much more even for 24
these two groups. Never cyclists were also much more likely to report not feeling confident than 25
the other cyclist types (41 percent not confident or cannot ride a bike at all, as compared to only 11 26
percent of rare cyclists not feeling confident). While cycling frequency is not solely explained by 27
0% 20% 40% 60% 80% 100%
Easy access to bike safety education***
Lower speed limits on roads w/out bike facilities***
Lower speed limits on roads w/ bike facilities***
Law enforcement of cyclist behavior***
Law enforcement of motorist behavior***
More bike facilities/a complete bike network***
Separated bike facilities***
Frequent cyclist (n=116) Occasional cyclist (n=83) Rare cyclist (n=93) Never cyclist (n=54)
Percentage of respondents selecting the factor

13
the ability to ride a bike, there is clearly a connection between the two (p < 0.001). Additionally, 1
being “somewhat confident” may be a barrier to more riding in itself, or it may be the result of not 2
being able to bicycle frequently due to other barriers. 3
4.7 Roadway Design Preferences 4
Respondents were then asked a series of questions about their level of comfort and experience 5
riding and driving on seven different roadway designs (see Figure 4). The results indicate several 6
key trends in respondents’ preferences for driving near bicyclists and bicycling near drivers. 7
8

14
FIGURE 4. Roadway Design Options 1
2
3
4
5
6
7
8
9
10
11
12
13
14
15
16
17
18
19
20
21
22
23
24
25
26
27
28
15
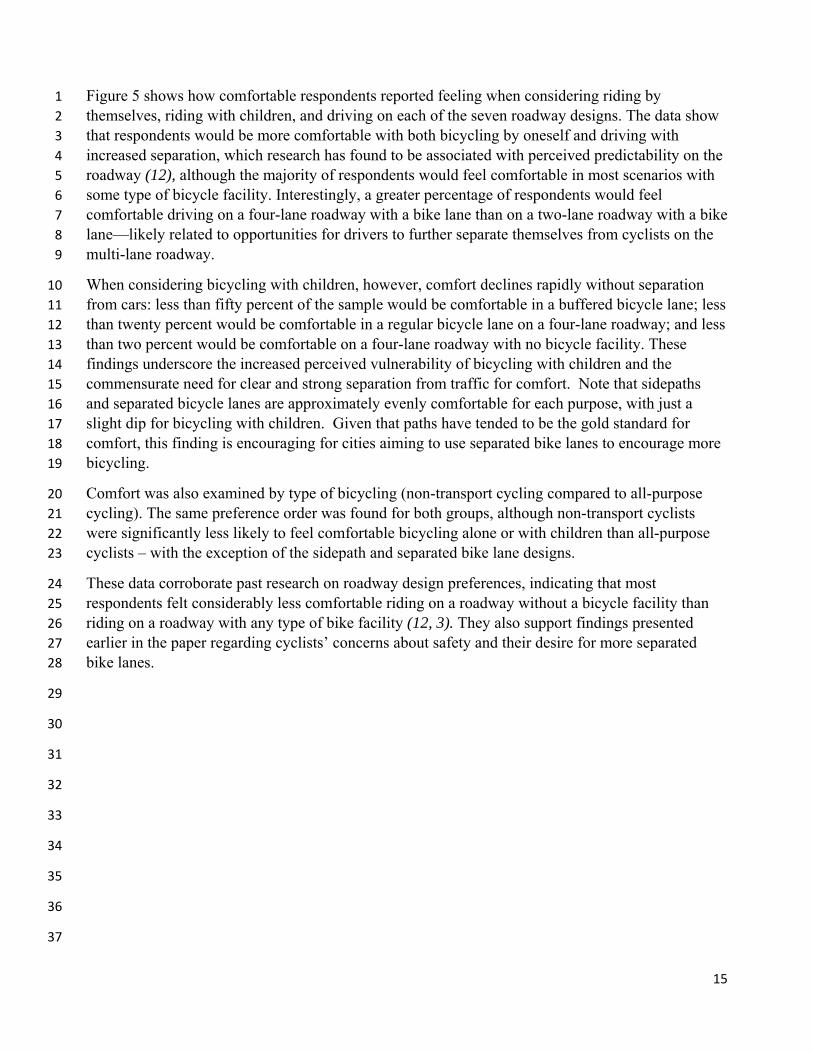
Figure 5 shows how comfortable respondents reported feeling when considering riding by 1
themselves, riding with children, and driving on each of the seven roadway designs. The data show 2
that respondents would be more comfortable with both bicycling by oneself and driving with 3
increased separation, which research has found to be associated with perceived predictability on the 4
roadway (12), although the majority of respondents would feel comfortable in most scenarios with 5
some type of bicycle facility. Interestingly, a greater percentage of respondents would feel 6
comfortable driving on a four-lane roadway with a bike lane than on a two-lane roadway with a bike 7
lane—likely related to opportunities for drivers to further separate themselves from cyclists on the 8
multi-lane roadway. 9
When considering bicycling with children, however, comfort declines rapidly without separation 10
from cars: less than fifty percent of the sample would be comfortable in a buffered bicycle lane; less 11
than twenty percent would be comfortable in a regular bicycle lane on a four-lane roadway; and less 12
than two percent would be comfortable on a four-lane roadway with no bicycle facility. These 13
findings underscore the increased perceived vulnerability of bicycling with children and the 14
commensurate need for clear and strong separation from traffic for comfort. Note that sidepaths 15
and separated bicycle lanes are approximately evenly comfortable for each purpose, with just a 16
slight dip for bicycling with children. Given that paths have tended to be the gold standard for 17
comfort, this finding is encouraging for cities aiming to use separated bike lanes to encourage more 18
bicycling. 19
Comfort was also examined by type of bicycling (non-transport cycling compared to all-purpose 20
cycling). The same preference order was found for both groups, although non-transport cyclists 21
were significantly less likely to feel comfortable bicycling alone or with children than all-purpose 22
cyclists – with the exception of the sidepath and separated bike lane designs. 23
These data corroborate past research on roadway design preferences, indicating that most 24
respondents felt considerably less comfortable riding on a roadway without a bicycle facility than 25
riding on a roadway with any type of bike facility (12, 3). They also support findings presented 26
earlier in the paper regarding cyclists’ concerns about safety and their desire for more separated 27
bike lanes. 28
29
30
31
32
33
34
35
36
37

16
FIGURE 5. Roadway Design Preferences by Percentage of Respondents who would Feel 1
Comfortable Bicycling in Various Scenarios 2
3 4
The survey also asked about respondents’ willingness to try bicycling on the various facilities. 5
Nearly 90 percent of respondents would be willing to try bicycling on a separated facility, while no 6
less than 68 percent would be willing to try even just a bicycle lane. In contrast, only 24 percent 7
indicated a willingness to try bicycling on a four-lane roadway without a bicycle facility. 8
9
4.7.1 Roadway Design Preferences by Cyclist Type 10
Comfort levels for each roadway design were also examined by the cyclist type (data not shown; 11
general patterns fit with Figure 5). In each case, “never cyclists” were the least comfortable with the 12
bicycle facilities, whether when cycling alone or with children. Comfort levels among frequent, 13
occasional, and rare cyclists were similar for all of the separated facilities, with rare cyclists slightly 14
lower in general, and the difference becoming more pronounced for non-separated facilities. The 15
percentage of respondents who indicated comfort bicycling by oneself without a bicycle facility on 16
a four-lane roadway was low for all groups (less than twenty percent), but particularly so for never 17
cyclists. 18
When considering riding with children, all cyclists felt less comfortable as separation decreased, 19
and dramatically so as the separation decreased to just a line (i.e., bike lane) and then no facility at 20
all. Comfort for driving was pretty consistently high, although less so for the bike lane on the two-21
lane roadway and the no facility option, similar to Figure 5. For both of these design options, 22
comfort increased with cycling frequency. 23
24
0% 20% 40% 60% 80% 100%
No bike facility on a four‐lane roadway
Bike lane on a four‐lane roadway
Bike lane on a two‐lane roadway
Buffered bike lane on a four‐lane roadway
Bi‐directional separated bike lane on a four‐lane roadway
Separated bike lane on a four‐lane roadway
Sidepath adjacent to a four‐lane roadway
Comfortable for biking by myself Comfortable for biking w/ children Comfortable for driving
Percentage of respondents who agree/completely agree

17
Finally, most respondents indicated a willingness to try bicycling on the various street designs, 1
although the willingness steadily decreased as separation decreased. Never cyclists were 2
consistently the least likely to indicate a willingness, although over 70 percent of them indicated a 3
willingness to try bicycling on a separated bike lane or a sidepath, potentially indicating an 4
opportunity to make headway in a group of people traditionally left out of bicycle planning. The no 5
bike facility option remained unpopular across all groups. 6
7
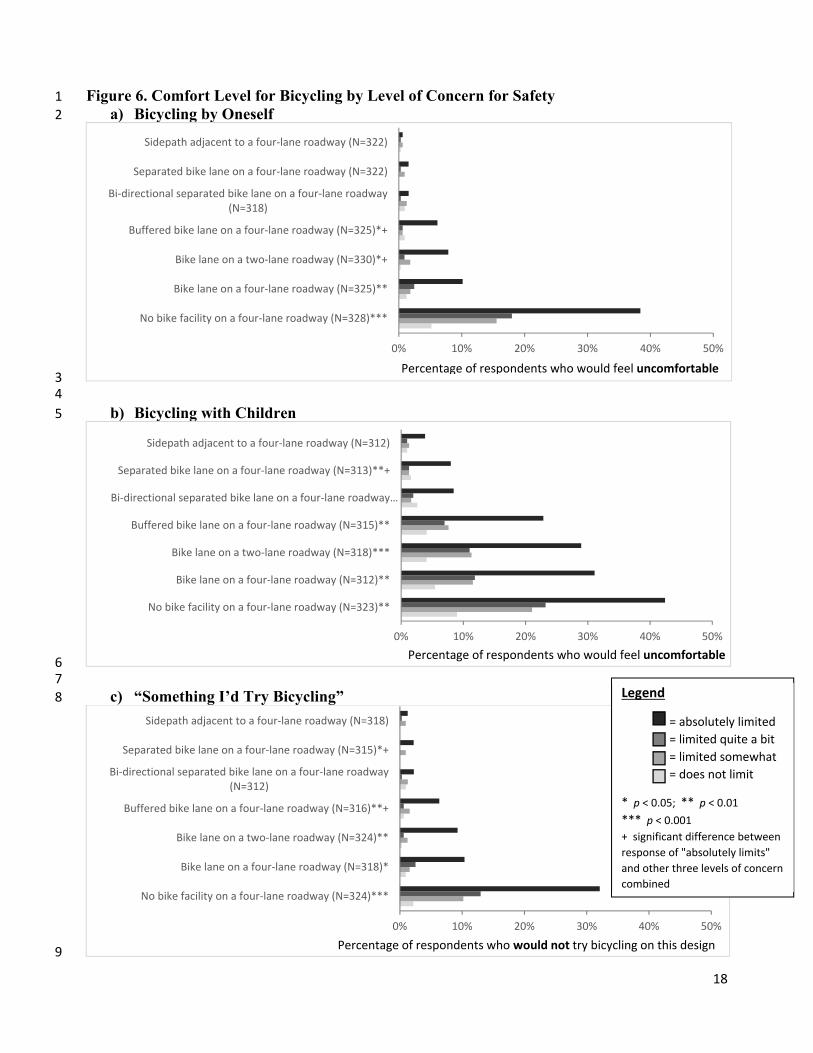
4.7.2 Roadway Design Preferences by Respondents Concerned about Safety 8
Additional exploration was conducted to determine whether reported comfort levels on various 9
roadway designs differed based on respondents’ concerns about safety. In each case, respondents 10
who were “absolutely” limited by concerns (i.e., “very concerned”) about safety were significantly 11
(p < 0.05) less likely to indicate that they would be comfortable riding on various roadways. As 12
seen in Figure 6, a significantly higher percentage of respondents who are very concerned about 13
safety reported that they would feel uncomfortable riding by themselves on a roadway with no bike 14
facilities compared to the rest of the respondents (p < 0.001). However, when physical separation is 15
present between drivers and bicyclists, very concerned cyclists feel a similar level of comfort to the 16
rest of the respondents. Additionally, very concerned respondents were the most likely to be 17
affected when a bicycle lane was added to the road. 18
In general, as the separation between drivers and cyclists increases, the percentage of respondents 19
who are very concerned with their safety and would feel uncomfortable riding on a roadway 20
decreases. Not surprisingly, the differences in the responses of those who are very concerned and 21
those who are not concerned are even more pronounced when considering bicycling with children. 22
23
24
25
26
27
28
29
30
31
32
33
34
35
36
37
38
39
18
Figure 6. Comfort Level for Bicycling by Level of Concern for Safety 1
a) Bicycling by Oneself 2
3 4
b) Bicycling with Children 5
6 7
c) “Something I’d Try Bicycling” 8
9
0% 10% 20% 30% 40% 50%
No bike facility on a four‐lane roadway (N=328)***
Bike lane on a four‐lane roadway (N=325)**
Bike lane on a two‐lane roadway (N=330)*+
Buffered bike lane on a four‐lane roadway (N=325)*+
Bi‐directional separated bike lane on a four‐lane roadway(N=318)
Separated bike lane on a four‐lane roadway (N=322)
Sidepath adjacent to a four‐lane roadway (N=322)
0% 10% 20% 30% 40% 50%
No bike facility on a four‐lane roadway (N=323)**
Bike lane on a four‐lane roadway (N=312)**
Bike lane on a two‐lane roadway (N=318)***
Buffered bike lane on a four‐lane roadway (N=315)**
Bi‐directional separated bike lane on a four‐lane roadway…
Separated bike lane on a four‐lane roadway (N=313)**+
Sidepath adjacent to a four‐lane roadway (N=312)
0% 10% 20% 30% 40% 50%
No bike facility on a four‐lane roadway (N=324)***
Bike lane on a four‐lane roadway (N=318)*
Bike lane on a two‐lane roadway (N=324)**
Buffered bike lane on a four‐lane roadway (N=316)**+
Bi‐directional separated bike lane on a four‐lane roadway(N=312)
Separated bike lane on a four‐lane roadway (N=315)*+
Sidepath adjacent to a four‐lane roadway (N=318)
Percentage of respondents who would not try bicycling on this design
Legend
= absolutely limited
= limited quite a bit
= limited somewhat
= does not limit
* p < 0.05; ** p < 0.01
*** p < 0.001 + significant difference between
response of "absolutely limits"
and other three levels of concern
combined
Percentage of respondents who would feel uncomfortable
Percentage of respondents who would feel uncomfortable

19
5. CONCLUSIONS 1
The survey successfully captured a cross-section of Michigan residents to gain a more nuanced 2
understanding of their attitudes toward bicycling and driving, bicycling habits, barriers to bicycling, 3
and roadway design preferences. The findings overwhelmingly suggest a preference for more 4
bicycle accommodations, and more separated facilities in particular. Seventy-five percent of all 5
respondents indicated that the installation of separated bicycle facilities would encourage them to 6
bicycle more, with almost twice as many rare cyclists choosing separated bike facilities over more 7
facilities in general. 8
Relatedly, safety concerns, distance, and weather appeared to be the most limiting barriers for all 9
cyclist types. Nearly 89 percent of respondents reported that safety concerns about riding in fast 10
and/or busy traffic at least somewhat limited their ability to bike to work or school, with 68 percent 11
saying that safety concerns limited them “quite a lot” or “absolutely.” As expected, frequent cyclists 12
were less likely to indicate barriers than other cyclists. 13
The presence of bicycle facilities increases respondents’ comfort and willingness to try bicycling on 14
a roadway. Most respondents felt considerably more comfortable bicycling on a roadway with any 15
type of bike facility over one lacking a bicycle facility, and this preference was even stronger when 16
the facility was separated from drivers by a physical barrier. Separation was even more important 17
when considering cycling with children, with comfort levels declining rapidly without separation 18
from cars when children are considered. Respondents were also more likely to indicate comfort 19
while driving with greater separation from bicyclists. 20
These findings corroborate past research, clarify the nuance of bicycling considering trip 21
companions, and show a clear pathway from safety as a barrier to bicycling to something that can 22
be addressed through infrastructure. Ultimately, these findings will provide an important 23
complement to the crash history when determining guidance for sidepath design. 24
25
ACKNOWLEDGMENTS 26
Thanks to Josh DeBruyn and the Michigan Department of Transportation for supporting a rigorous 27
attempt to understand design preferences among Michigan residents. We also appreciate the help of 28
Hannah Pritchard, Connor Cox, and our Wayne State partners for helping deploy the survey. 29
30
REFERENCES 31
1. Flusche, D. Bicycle Commuting Data. 2012. Retrieved June 12, 2013, from 32
http://www.bikeleague.org/news/acs2010.php. 33
2. Flusche, D. Highlights from the 2009 National Household Travel Survey. League of 34
American Bicyclists. Washington, D.C., 2010. 35
3. Dill, J., and McNeil, N. Revisiting the Four Types of Cyclists: Findings from a national 36
survey. Transportation Research Board, Washington, D.C., 2016. 37

20
4. Sener, I. N., N. Eluru, et al. Who are Bicyclists? Why and How Much Are They Bicycling? 1
Transportation Research Record: Journal of the Transportation Research Board, No. 2134, 2
2009, pp. 63-72. 3
5. Dill, J. and Voros, K. Factors Affecting Bicycling Demand: Initial Survey Findings from the 4
Portland, Oregon, Region." Transportation Research Record: Journal of the Transportation 5
Research Board, No. 2031, 2007, pp 9-17. 6
6. Tilahun, N. Y., Levinson, D.M., and Krizek, K.J. Trails, lanes, or traffic: Valuing bicycle 7
facilities with an adaptive stated preference survey. Transportation Research Part A, Vol. 8
41, 2007, pp. 287-301. 9
7. Winters, M. and Teschke, K. Route Preferences Among Adults in the Near Market for 10
Bicycling: Findings of the Cycling in Cities Study." American Journal of Health Promotion, 11
September - October 2010, pp. 40-47. 12
8. Dill, J. and McNeil, N. Four Types of Cyclists? Examination of Typology for Better 13
Understanding of Bicycling Behavior and Potential. Transportation Research Record: 14
Journal of the Transportation Research Board, No. 2387, 2012 pp.129-138. 15
9. Goddard, T., Monsere, C., and McNeil, N. Can Protected Bike Lanes Help Close the Gender 16
Gap in Cycling? Lessons from Five Cities. Urban Studies and Planning Faculty 17
Publications and Presentations, 2014, pp.123. 18
10. Winters, M., Teschke, K., Grant, M., Setton, E., and Brauer, M. How far out of the way will 19
we travel? Built environment influences on route selection for bicycle and car travel. 20
Transportation Research Record: Journal of the Transportation Research Board, No. 2190, 21
2010, pp. 1-10. 22
11. Broach, J., Dill, J., and Gliebe, J. Where do cyclists ride? A route choice model developed 23
with revealed preference GPS data. Transportation Research Part A, Vol. 46, 2012, pp/ 24
1730-1740. 25
12. Sanders, R.L. We can all get along: The alignment of driver and bicyclist roadway 26
design preferences in the San Francisco Bay Area. Transportation Research Part A, 27
Vol., 91, 2016, pp.120-133. 28
13. Watkins, K., et al., NCHRP 08-102. In progress. 29
14. Toole Design Group. The Importance of Space: Bicyclists, Drivers, and Bicycle Lanes. 30
Michigan Department of Transportation. 2017. 31
15. Aday, L.A. and Cornelius, L.J. Designing and Conducting Health Surveys. John Wiley & 32
Sons, Inc., San Francisco, California, 2006. 33
16. Brown, C. and Blickstein, S. Bicycling Among Black and Latino Women: Focus Group 34
Summary Report. Rutgers University. 2016. 35
17. American Community Survey (2011-2015). Sex of Workers by Means of Transportation to 36
Work, American Community Survey. 37
18. Manaugh, K., Boisjoly, G. and El-Geneidy, A. Overcoming barriers to cycling: 38
Understanding frequency of cycling in a University setting and the factors preventing 39
commuters from cycling on a regular basis. Transportation, Vol. 44, 2017. 40
41