1 pharmaceutical descriptive analysis texas department of insurance, workers’ compensation...
TRANSCRIPT

1
Pharmaceutical Descriptive Analysis
Texas Department of Insurance, Workers’ Compensation Research and Evaluation Group
July 2007

2
Overview
• Data and Methods• Distribution of System Costs• Utilization and Costs by Prescription Year:
– Injury Year– Injury Type– Therapeutic Classification Group– Therapeutic Classification Sub-Class
• Payment Denial Patterns• Generic Substitution Patterns• Summary of Key Results• Next Step

3
Data and Methods Data sources:
DWC 837 Medical data Medi-Span Master Drug Database (Classification Groups) ECS 2000-2004 Medical/Hospital Bills (To identify Injury Types)
Data Parameters: Injury Years 1991 – 2006Prescription Years 2005 and 2006Prescriptions for 90 Days or less (99.8% of all data)Dropped prescriptions with denials for Duplicate,
Entitlement, and Compensability issues

4
Data and Methods, Continued Measures:
Prescriptions: Number of Billing LinesUnits = Number of DaysPaymentsCharges Injured Employees (Defined by number of unique
SSN/Injury Date) Injury Types (Standard ICD9 classifications used by REG)
Data Issues: Injury Types unidentifiable for 30% of prescription billsThe number of Drug Days varied widely

5
System Measures

6
Payments in the Texas Workers’ Compensation System
Prescription Years 2005 - 2006
Source: Texas Department of Insurance, Workers’ Compensation Research and Evaluation Group, 2007.Note 1: Percent of Total Payments may not add up to 100% because of rounding. Note 2: The California Workers’ Compensation Institute (CWCI) estimates that in 2005 California’s Pharmacy cost was 7 percent of that state’s medical costs.
Medical Type
Prescription Year2005
Prescription Year2006
TotalPayments
Percent ofTotal
Payments1
TotalPayments
Percent ofTotal
Payments1
Professional $626,309,000 62% $535,603,000 57%
Hospital $250,938,000 25% $275,923,000 29%
Pharmacy $132,973,000 13%2 $131,647,000 14% 2
Dental $580,000 <1% $1,049,000 <1%

7
Percent of Medical Paymentsin the Texas Workers’ Compensation System
by Medical Type, Prescription Years 2005-2006
62%
57%
25%
29%
13% 14%
<1% <1%
0%
10%
20%
30%
40%
50%
60%
70%
Pe
rce
nt
of
Me
dic
al
Co
st
Professional Hospital Pharmacy Dental
Medical Type
2005
2006
Source: Texas Department of Insurance, Workers’ Compensation Research and Evaluation Group, 2007.Note 1: Percent of Total Payments may not add up to 100% because of rounding.

8
Payment to Charge RatioTexas Workers’ Compensation System
Prescription Years 2005 - 2006
42%39%
29% 28%
73% 72%
55%
60%
0%
10%
20%
30%
40%
50%
60%
70%
80%
Pa
y t
o C
ha
rge
Ra
tio
Professional Hospital Pharmacy Dental
Medical Type
2005
2006
Source: Texas Department of Insurance, Workers’ Compensation Research and Evaluation Group, 2007.

9
Injured Employees Receiving Prescriptions in the Texas Workers’ Compensation System
Prescription Years 2005 - 2006
171,330
171,146(50%)
176,127
168,225(49%)
0%
20%
40%
60%
80%
100%
2005 2006
Injured Employees Without Prescriptions Injured Employees With Prescriptions
Source: Texas Department of Insurance, Workers’ Compensation Research and Evaluation Group, 2007.

10
Pharmaceuticals in The Texas Workers’ Compensation System
Utilization and Costs

11
Distribution of Pharmaceutical Utilization and Payments by Injury Year
Prescription Year 2006
Injury Years
Numberand (%) of
InjuredEmployees
Number and (%) of
Prescriptions
Number and (%) of Drug Days
Total and (%) ofPayments
1991 - 2000 21,094(13%)
545,591(33%)
12,749,849(40%)
$61,061,807(46%)
2001- 2004 25,666(15%)
457,480(28%)
9,770,829(31%)
$38,651,958(29%)
2005 23,766(14%)
252,673(15%)
4,288,462(14%)
$14,898,811(11%)
2006 97,699(58%)
392,822(24%)
4,759,971(15%)
$17,034,883(13%)
Total 168,225 1,648,566 31,565,111 $131,647,459
Source: Texas Department of Insurance, Workers’ Compensation Research and Evaluation Group, 2007.Note 1: Percent of Total Payments may not add up to 100% because of rounding.

12
Pharmaceutical Utilization and Paymentsby Injury Year
Prescription Year 2006
13%
33%
40%
46%
15%
28%31% 29%
14%15%14%
11%
58%
24%
15%13%
0%
10%
20%
30%
40%
50%
60%
Pe
rce
nt
1991 - 2000 2001 - 2004 2005 2006
Injury Years
% of Injured Employees % of Prescriptions % of Drug Days % of Payments
Source: Texas Department of Insurance, Workers’ Compensation Research and Evaluation Group, 2007.

13
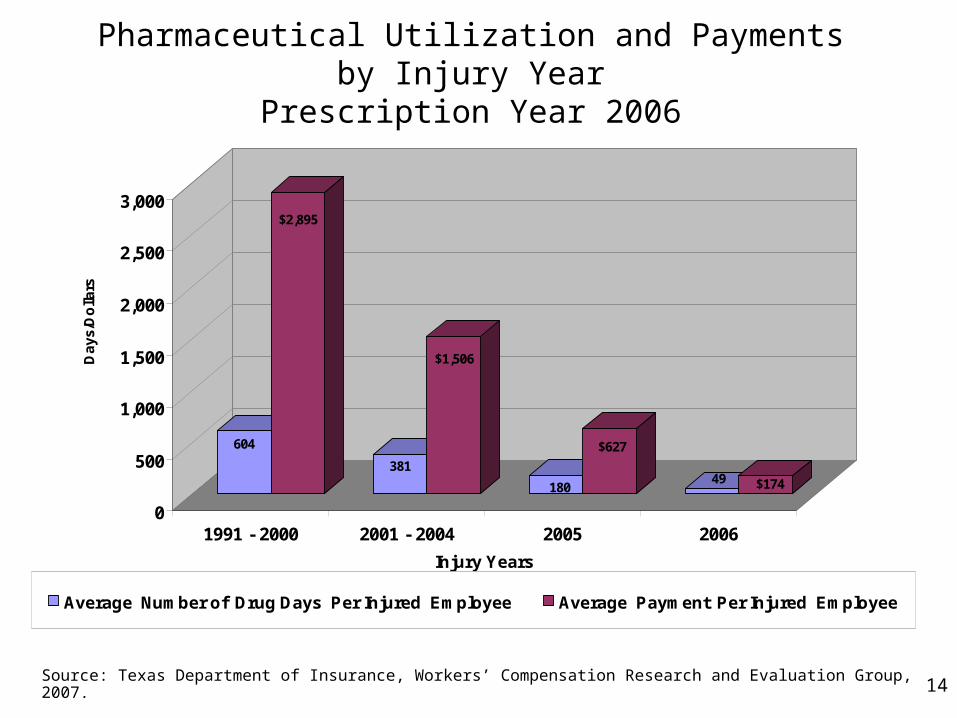
Average Pharmaceutical Utilization and Payments Per Injured Employee
by Injury Year, Prescription Year 2006
Injury Years
Number ofInjured
Employees
AverageNumber of
PrescriptionsPer InjuredEmployee
AverageNumber of Drug Days Per InjuredEmployee
AveragePayment
Per InjuredEmployee
1991 - 2000 21,094 25.8 604 $2,895
2001- 2004 25,666 17.8 381 $1,506
2005 23,766 10.6 180 $627
2006 97,699 4.0 49 $174
Source: Texas Department of Insurance, Workers’ Compensation Research and Evaluation Group, 2007.
14
Pharmaceutical Utilization and Paymentsby Injury Year
Prescription Year 2006
604
$2,895
381
$1,506
180
$627
49 $174
0
500
1,000
1,500
2,000
2,500
3,000
Da
ys
/Do
llars
1991 - 2000 2001 - 2004 2005 2006
Injury Years
Average Number of Drug Days Per Injured Employee Average Payment Per Injured Employee
Source: Texas Department of Insurance, Workers’ Compensation Research and Evaluation Group, 2007.

15
Distribution of Pharmaceutical Utilization and Payments by Injury Type, Prescription Year 2006
Injury TypeNumber
and (%) 1ofInjured
Employees
Number and (%) 1 of
Prescriptions
Number and (%) 1 of Drug Days
Total and (%) 1 ofPayments
Low Back S.T. 27,020 (16%) 293,250 (18%) 5,560,347 (18%) $21,506,129 (16%)
Shoulder 10,989 (7%) 85,193 (5%) 1,370,246 (4%) $4,851,641 (4%)
Hand-Wrist S.F. 9,645 (6%) 28,596 (2%) 352,444 (1%) $1,489,780 (1%)
Neck 8,263 (5%) 104,803 (6%) 1,995,353 (6%) $7,601,174 (6%)
Low-Back N.C. 6,287 (4%) 116,067 (7%) 2,327,423 (7%) $9,202,987 (7%)
Hand-Wrist S.T. 6,166 (4%) 31,914 (2%) 493,668 (1%) $1,748,383 (1%)
Knee 5,321 (3%) 37,710 (2%) 576,614 (2%) $2,024,647 (2%)
Ankle-Foot S.T. 4,777 (3%) 22,859 (1%) 347,788 (1%) $1,292,345 (1%)
Multiple S.T. 2,651 (2%) 20,144 (1%) 362,711 (1%) $1,248,457 (1%)
Hand-Wrist N.C. 1,725 (1%) 16,191 (1%) 312,917 (1%) $1,186,166 (1%)
Other 61,993 (36%) 436,474 (27%) 7,526,788 (24%) $29,626,946 (23%)
Unknown 2 23,388 (13%) 455,365 (28%) 10,342,812 (33%) $49,868,801 (37%)
Source: Texas Department of Insurance, Workers’ Compensation Research and Evaluation Group, 2007.Note 1: Percents may not add up to 100% because of rounding. Note 2: More than 30% of injured employees with unknown injury types were injured between 1991 and 1995

16
Pharmaceutical Utilization and Paymentsby Injury Type
Prescription Year 2006
16%18% 18%
16%
4%2%
1%1%
5%6% 6% 6%
58%
60%
33%
37%
0%
5%
10%
15%
20%
25%
30%
35%
40%
Pe
rce
nt
Low Back S.T. Hand Wrist S.T. Neck Unknown *
Injury Types
% of Injured Employees % of Prescriptions % of Drug Days % of Payments
Source: Texas Department of Insurance, Workers’ Compensation Research and Evaluation Group, 2007. Note *: More than 30% of injured employees with unknown injury types were injured between 1991 and 1995

17
Distribution of Pharmaceutical Utilization and Payments Per Injured Employee
by Injury Type, Prescription Year 2006
Injury TypeNumber of
InjuredEmployees
Average Number ofPrescriptions
Per InjuredEmployee
Average Number of Drug Days Per InjuredEmployee
AveragePayment
Per InjuredEmployee
Low Back S.T. 27,020 47 888 $3,433
Shoulder 10,989 8 126 $445
Hand-Wrist S.F. 9,645 3 37 $155
Neck 8,263 13 243 $924
Low-Back N.C. 6,287 4 87 $343
Hand-Wrist S.T. 6,166 19 287 $1,018
Knee 5,321 7 109 $383
Ankle-Foot S.T. 4,777 5 73 $272
Multiple S.T. 2,651 8 137 $472
Hand-Wrist N.C. 1,725 3 51 $194
Other 61,993 7 123 $486
Unknown 1 23,388 20 448 $2,158
Source: Texas Department of Insurance, Workers’ Compensation Research and Evaluation Group, 2007. Note 1: More than 30% of injured employees with unknown injury types were injured between 1991 and 1995

18
Pharmaceutical Utilization and Paymentsby Selected Injury TypesPrescription Year 2006
888
$3,433
287
$1,018
243
$924
448
$2,158
0
500
1,000
1,500
2,000
2,500
3,000
3,500
Day
s/D
olla
rs
Low Back Soft Tissue Hand Wrist SoftTissue
Neck Unknown *
Injury Type
Average Number of Drug Days Average Payment
Source: Texas Department of Insurance, Workers’ Compensation Research and Evaluation Group, 2007. Note *: More than 30% of injured employees with unknown injury types were injured between 1991 and 1995
19
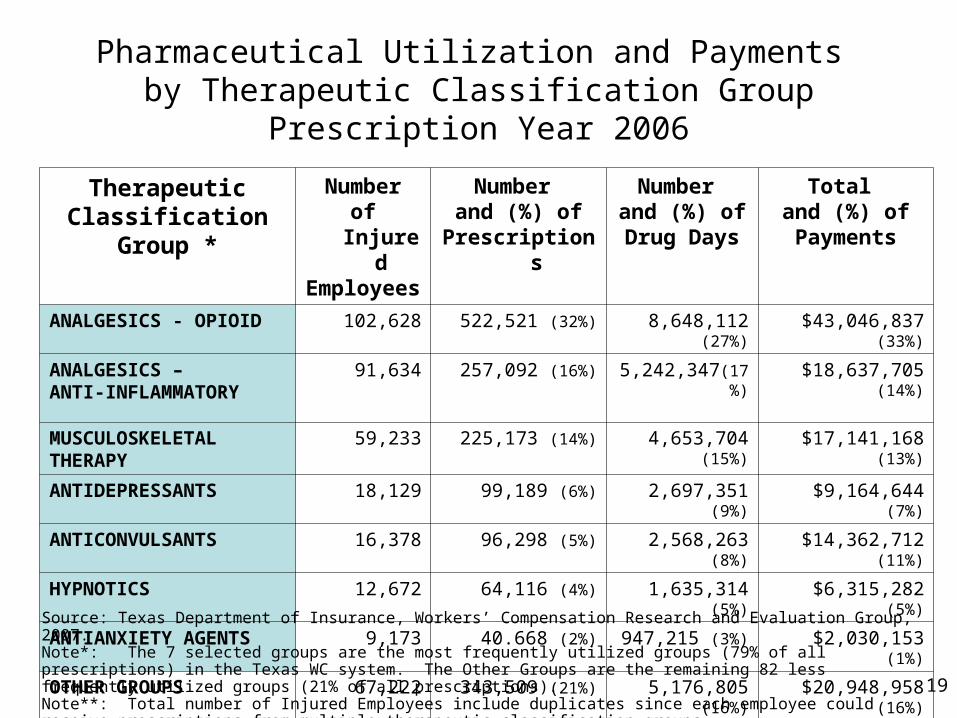
Pharmaceutical Utilization and Payments by Therapeutic Classification Group
Prescription Year 2006
TherapeuticClassification
Group *
Numberof Injured
Employees
Number and (%) of
Prescriptions
Number and (%) of Drug Days
Total and (%) ofPayments
ANALGESICS - OPIOID 102,628 522,521 (32%) 8,648,112 (27%) $43,046,837 (33%)
ANALGESICS – ANTI-INFLAMMATORY
91,634 257,092 (16%) 5,242,347(17%) $18,637,705 (14%)
MUSCULOSKELETALTHERAPY
59,233 225,173 (14%) 4,653,704 (15%) $17,141,168 (13%)
ANTIDEPRESSANTS 18,129 99,189 (6%) 2,697,351 (9%) $9,164,644 (7%)
ANTICONVULSANTS 16,378 96,298 (5%) 2,568,263 (8%) $14,362,712 (11%)
HYPNOTICS 12,672 64,116 (4%) 1,635,314 (5%) $6,315,282 (5%)
ANTIANXIETY AGENTS 9,173 40.668 (2%) 947,215 (3%) $2,030,153 (1%)
OTHER GROUPS 67,222 343,509 (21%) 5,176,805 (16%) $20,948,958 (16%)
Total 377,069 ** 1,648,566 31,569,111 $131,647,461
Source: Texas Department of Insurance, Workers’ Compensation Research and Evaluation Group, 2007.Note*: The 7 selected groups are the most frequently utilized groups (79% of all prescriptions) in the Texas WC system. The Other Groups are the remaining 82 less frequently utilized groups (21% of all prescriptions). Note**: Total number of Injured Employees include duplicates since each employee could receive prescriptions from multiple therapeutic classification groups.

20
Cumulative Distribution of Pharmaceutical Prescriptions by Therapeutic Classification Group
Prescription Year 2006Therapeutic
ClassificationGroup
Number ofPrescriptions
CumulativePercentage ofPrescriptions
Total and (%) ofPayments
CumulativePercentage of
Payments
ANALGESICS -OPIOID
522,521 (32%) 32% $43,046,837 (33%) 33%
ANALGESICS – ANTI- IFLAMMATORY
257,092 (16%) 48% $18,637,705 (14%) 47%
MUSCULOSKELETALTHERAPY
225,173 (14%) 62% $17,141,168 (13%) 60%
ANTIDEPRESSANTS 99,189 (6%) 68% $9,164,644 (7%) 67%
ANTICONVULSANTS 96,298 (5%) 73% $14,362,712 (11%) 78%
HYPNOTICS 64,116 (4%) 77% $6,315,282 (5%) 82%
ANTIANXIETYAGENTS
40.668 (2%) 79% $2,030,153 (2%) 84%
OTHER GROUPS * 343,509 (21%) 100% $20,948,958 (16%) 100%
Source: Texas Department of Insurance, Workers’ Compensation Research and Evaluation Group, 2007.Note*: Texas WC prescriptions in 2006 were for 6,001 unique Drug Names from 626 Subclasses. The Subclasses fall into 89 distinct Therapeutic Classification Groups as defined by the Medi-Span classification system

21
Most Frequently Dispensed Prescriptions by Therapeutic Classification Subclass*
Prescription Year 2006
Source: Texas Department of Insurance, Workers’ Compensation Research and Evaluation Group, 2007.Note*: These 40 subclasses represent all the subclasses found in the 7 most frequently utilized Therapeutic Classification Groups
Therapeutic Classification Subclass*
Number ofPrescriptions
Number of Drug Days
Number of Injured
Employees
Total Payments
1. Hydrocodone Combinations 309,990 4,797,088 70,786 $12,547,298
2. Central Muscle Relaxants 224,188 4,633,852 60,103 $16,920,573
3. Nonsteroidal Anti-inflammatory Agents 199,744 3,815,133 80,491 $11,407,594
4. Opioid Agonists 114,270 2,502,033 26,185 $25,394,160
5. Anticonvulsants - Misc. 82,994 2,218,229 16,750 $13,511,221
6. Non-Benzodiazepine - GABA-Receptor Modu
55,309 1,409,857 11,182 $5,974,277
7. Cyclooxygenase 2 (COX-2) Inhibitors 52,443 1,305,935 18,229 $6,652,473
8. Propoxyphene Combinations 51,626 668,065 20,939 $1,720,978
9. Benzodiazepines 37,127 876,531 7,989 $1,803,903
10. Selective Serotonin Reuptake Inhibitors
33,774 915,145 6,620 $3,439,146

22
Most Frequently Dispensed Prescriptions, Continued by Therapeutic Classification Subclass*
Prescription Year 2006
Source: Texas Department of Insurance, Workers’ Compensation Research and Evaluation Group, 2007.Note*: These 40 subclasses represent all the subclasses found in the 7 most frequently utilized Therapeutic Classification Groups
Therapeutic Classification Subclass*
Number ofPrescriptions
Number of Drug Days
Number of Injured
Employees
Total Payments
11. Tramadol Combinations 27,151 379,244 12,017 $1,872,588
12. Tricyclic Agents 25,549 688,708 5,886 $751,348
13. Serotonin-Norepinephrine Reuptake Inhib
23,240 640,601 4,646 $3,629,052
14. Anticonvulsants - Benzodiazepines
10,589 275,389 2,156 $483,467
15. Codeine Combinations 8,425 111,870 3,592 $282,020
16. Modified Cyclics 7,833 209,737 1,823 $288,114
17. Benzodiazepine Hypnotics 7,444 189,424 1,911 $236,589
18. Antidepressants - Misc 6,906 191,272 1,406 $879,031
19. Opioid Combinations 5,973 113,197 2,062 $724,693
20. Nonsteroidal Anti- inflammatory Agent Co
4,854 120,319 1,715 $550,776
23
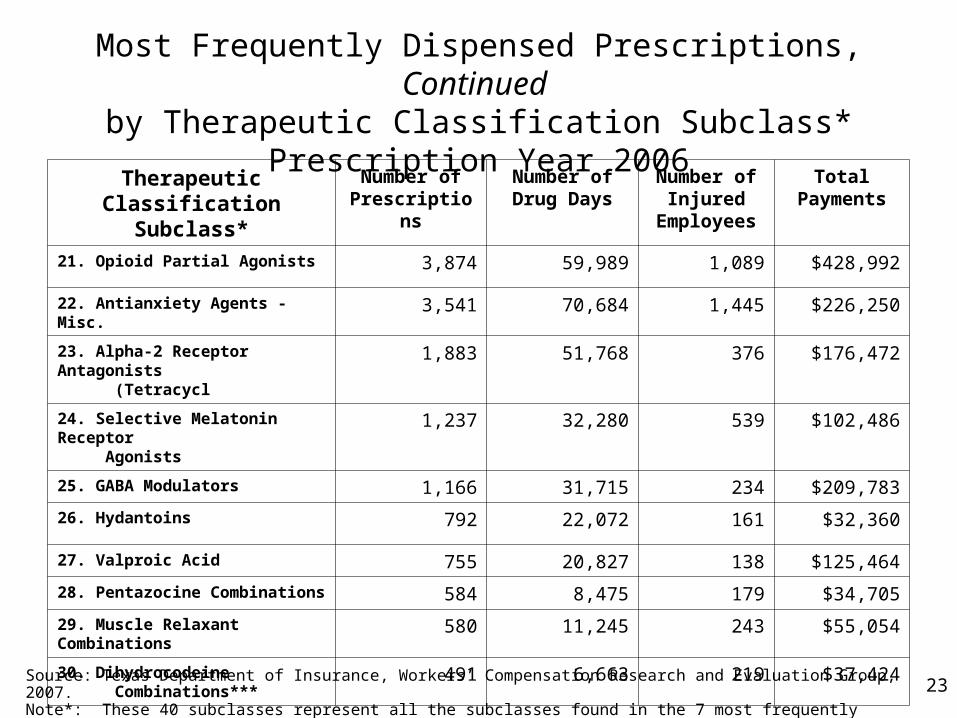
Most Frequently Dispensed Prescriptions, Continued by Therapeutic Classification Subclass*
Prescription Year 2006
Source: Texas Department of Insurance, Workers’ Compensation Research and Evaluation Group, 2007.Note*: These 40 subclasses represent all the subclasses found in the 7 most frequently utilized Therapeutic Classification Groups
Therapeutic Classification Subclass*
Number ofPrescriptions
Number of Drug Days
Number of Injured
Employees
Total Payments
21. Opioid Partial Agonists 3,874 59,989 1,089 $428,992
22. Antianxiety Agents - Misc. 3,541 70,684 1,445 $226,250
23. Alpha-2 Receptor Antagonists (Tetracycl
1,883 51,768 376 $176,472
24. Selective Melatonin Receptor Agonists
1,237 32,280 539 $102,486
25. GABA Modulators 1,166 31,715 234 $209,783
26. Hydantoins 792 22,072 161 $32,360
27. Valproic Acid 755 20,827 138 $125,464
28. Pentazocine Combinations 584 8,475 179 $34,705
29. Muscle Relaxant Combinations 580 11,245 243 $55,054
30. Dihydrocodeine Combinations***
491 6,663 219 $37,424

24
Most Frequently Dispensed Prescriptions, Continued by Therapeutic Classification Subclass*
Prescription Year 2006
Source: Texas Department of Insurance, Workers’ Compensation Research and Evaluation Group, 2007.Note*: The first 40 subclasses represent all the subclasses found in the 7 most frequently utilized Therapeutic Classification Groups
TherapeuticClassification Subclass*
Number ofPrescriptions
Number of Drug Days
Number ofInjured
Employees
TotalPayments
31. Viscosupplements 276 4,665 215 $149,879
32. Meperidine Combinations 137 1,488 49 $3,980
33. Direct Muscle Relaxants 129 3,942 23 $15,662
34. Barbiturate Hypnotics 77 2,552 15 $815
35. Non-Barbiturate Hypnotics 42 1,133 14 $1,072
36. Pyrimidine Synthesis Inhibitors
40 669 14 $12,613
37. Soluble Tumor Necrosis Factor Receptor
11 291 1 $14,248
38. Antihistamine Hypnotic Combinations
7 68 3 $43
39. Monoamine Oxidase Inhibitors (MAOIs)
4 120 3 $1,481
40. Succinimides 2 31 1 $416
Subtotal (40 Subclasses) 1,305,057 (79%) 26,392,306 (84%) 361,449 $110,698,503 (84%)
OTHER (586 Subclasses) 343,509 (21%) 5,176,805 (16%) 68,412 $20,948,959 (16%)

25
Five Most Frequently Utilized Drug Subclasses *Total Number of Prescriptions
Prescription Year 2006
Hydrocodone Combinations:
309K
Central Muscle Relaxants: 224K
Nonsteroidal Anti- Inflammatory Agents:
200K
Anticonvulsants: 83K
Opioid Agonists: 114K
0 50,000 100,000 150,000 200,000 250,000 300,000 350,000
Number of Prescriptions
Source: Texas Department of Insurance, Workers’ Compensation Research and Evaluation Group, 2007. Note*: These 5 subclasses represent 56 percent of all the drugs dispensed in the Texas workers compensation system
26
Pharmaceuticals in The Texas Workers’ Compensation System
Prescription Denials

27
Most Frequently Denied Prescriptions by Therapeutic Classification Groups
Prescription Year 2006
Source: Texas Department of Insurance, Workers’ Compensation Research and Evaluation Group, 2007. Note*: Total number of injured employees include duplicates since each employee could receive prescriptions from multiple therapeutic classification groups.
TherapeuticClassification Group
Number ofDenied
Prescriptions
Number ofInjured
EmployeesW/Denied
Prescriptions *
Total DeniedCharges
OTHER GROUPS 71,219 (42%) 13,020 $23,732,524
ANALGESICS – OPIOID 34,020 (20%) 14,062 $3,038,485
ANALGESICS - ANTI-INFLAMMATORY 22,729 (13%) 11,515 $1,988,809
MUSCULOSKELETAL THERAPY AGENTS 18,020 (11%) 8,267 $1,781,442
ANTIDEPRESSANTS 9,183 (5%) 3,506 $1,051,773
ANTICONVULSANTS 6,618 (4%) 2,889 $1,170,175
HYPNOTICS 5,123 (3%) 2,285 $602,530
ANTIANXIETY AGENTS 3,610 (2%) 1,630 $250,892
Total 170,522 57,174* $33,616,630

28
Approved and Denied Prescriptionsby Therapeutic Classification Groups
Prescription Year 2006
21%
42%
32%
20%
16%
13%14%
11%
0%
5%
10%
15%
20%
25%
30%
35%
40%
45%
OTHER GROUPS ANALGESICS – OPIOID ANALGESICS - ANTI-INFLAMMATORY
MUSCULOSKELETALTHERAPY AGENTS
% of Approved Prescriptions % of Denied Prescriptions
Source: Texas Department of Insurance, Workers’ Compensation Research and Evaluation Group, 2007.

29
Five Most Frequently Denied Drug Subclasses Prescription Year 2006
Other Subclasses *
71K
Hydrocodone Combinations: 20K
Nonsteroidal Anti- Inflammatory Agents:
18K
Opioid Agonists: 6K
Central Muscle Relaxants: 17K
0 10,000 20,000 30,000 40,000 50,000 60,000 70,000 80,000
Number of Prescriptions
Source: Texas Department of Insurance, Workers’ Compensation Research and Evaluation Group, 2007. Note*: The Other Subclasses group represents 586 subclasses system

30
Percent of Denied Prescriptionsby Denial Codes
Prescription Year 2006
40%
23%
20%
8%
5%
0%
5%
10%
15%
20%
25%
30%
35%
40%
Unnecessary Fee Not Timely Filed NegotiatedContract
Unbundling
% of Denied Prescriptions
Source: Texas Department of Insurance, Workers’ Compensation Research and Evaluation Group, 2007.

31
Percent of Denied Prescriptionsby Injury Types
Prescription Year 2006
26%24%
19%
7% 7%
0%
5%
10%
15%
20%
25%
30%
Other Unknown Low Back SoftTissue
Low BackNerve
Compression
Neck
% of Denied Prescriptions
Source: Texas Department of Insurance, Workers’ Compensation Research and Evaluation Group, 2007.

32
Pharmaceuticals in The Texas Workers’ Compensation System
Generic Substitution

33
Generic Substitution Rate Where Generics were available *
Prescription Year 2006
28%
72%
0%
10%
20%
30%
40%
50%
60%
70%
80%
Brand Name Generic
Brand Name Generic
Source: Texas Department of Insurance, Workers’ Compensation Research and Evaluation Group, 2007.Note* : Approximately 85,000 prescriptions (5 percent) did not have generics available
34
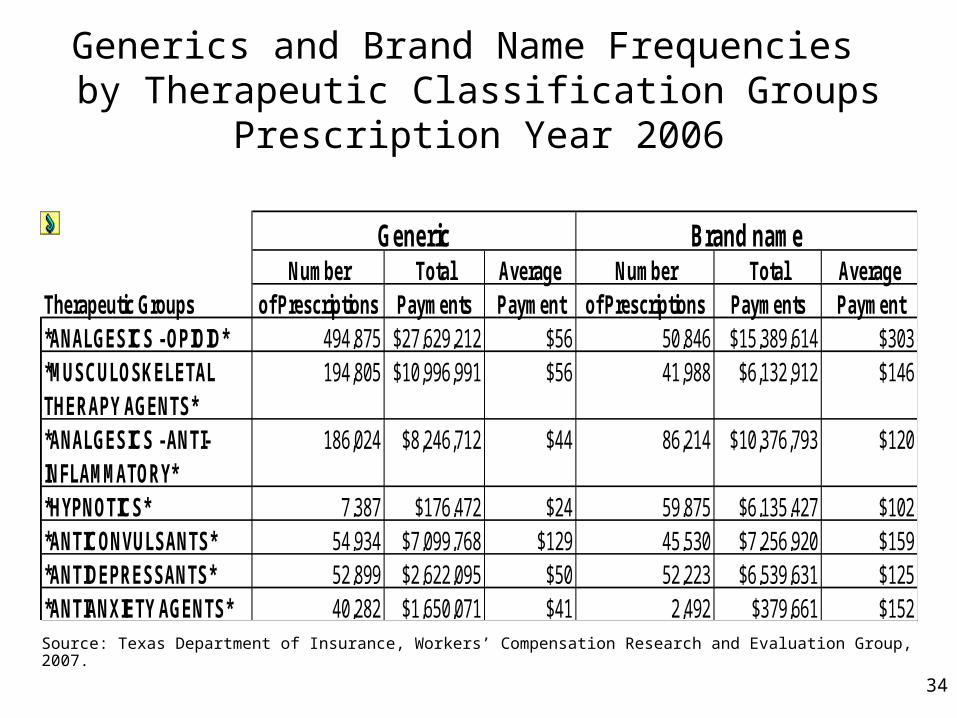
Generics and Brand Name Frequencies by Therapeutic Classification Groups
Prescription Year 2006
Source: Texas Department of Insurance, Workers’ Compensation Research and Evaluation Group, 2007.
Number Total Average Number Total AverageTherapeutic Groups of Prescriptions Payments Payment of Prescriptions Payments Payment*ANALGESICS - OPIOID* 494,875 $27,629,212 $56 50,846 $15,389,614 $303*MUSCULOSKELETAL THERAPY AGENTS*
194,805 $10,996,991 $56 41,988 $6,132,912 $146
*ANALGESICS - ANTI-INFLAMMATORY*
186,024 $8,246,712 $44 86,214 $10,376,793 $120
*HYPNOTICS* 7,387 $176,472 $24 59,875 $6,135,427 $102*ANTICONVULSANTS* 54,934 $7,099,768 $129 45,530 $7,256,920 $159*ANTIDEPRESSANTS* 52,899 $2,622,095 $50 52,223 $6,539,631 $125*ANTIANXIETY AGENTS* 40,282 $1,650,071 $41 2,492 $379,661 $152
Generic Brand name

35
Generic Substitution RatesTherapeutic Classification Groups
Prescription Year 2006
OTHER GROUPS, 55%
ANTIDEPRESSANTS, 50%
HYPNOTICS, 11%
Antianxiety Agents: 94%
Analgesics -Opioid: 91%
Muscular-Skeletal Therapeutic Agents: 82%
ANTICONVULSANTS: 55%
ANALGESICSAnti-Inflammatory 68%
0% 10% 20% 30% 40% 50% 60% 70% 80% 90% 100%
Percentage of Prescriptions
Source: Texas Department of Insurance, Workers’ Compensation Research and Evaluation Group, 2007.
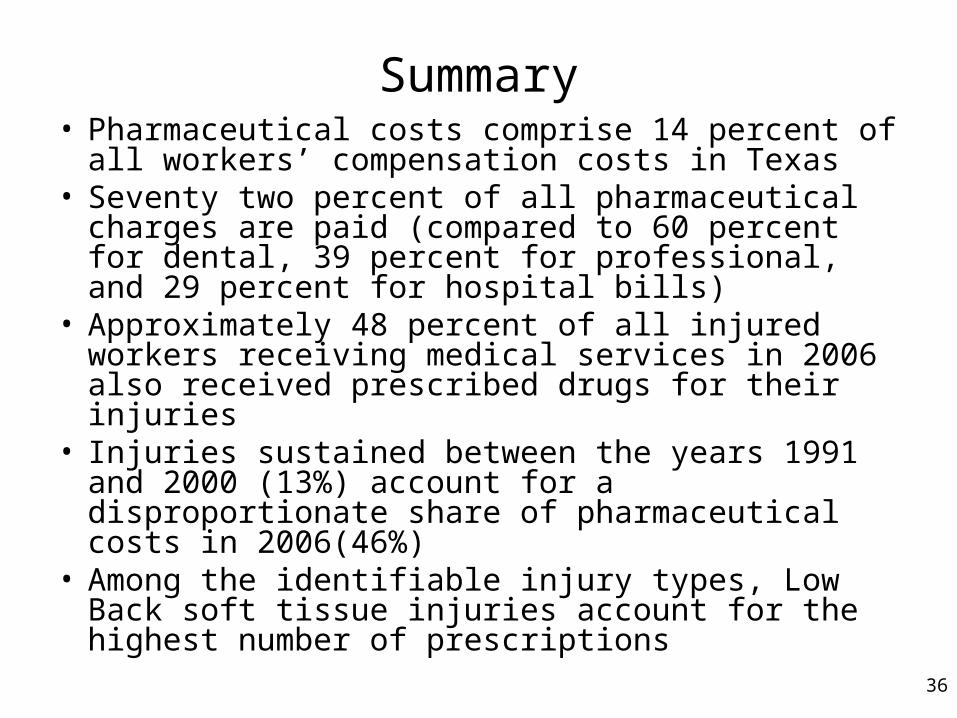
36
Summary• Pharmaceutical costs comprise 14 percent of all
workers’ compensation costs in Texas• Seventy two percent of all pharmaceutical charges are
paid (compared to 60 percent for dental, 39 percent for professional, and 29 percent for hospital bills)
• Approximately 48 percent of all injured workers receiving medical services in 2006 also received prescribed drugs for their injuries
• Injuries sustained between the years 1991 and 2000 (13%) account for a disproportionate share of pharmaceutical costs in 2006(46%)
• Among the identifiable injury types, Low Back soft tissue injuries account for the highest number of prescriptions

37
Summary, Continued• A total of 7 of the 89 Therapeutic Classification Groups
(40 of the 626 Subclasses) account for 79 percent of all the prescriptions filled in 2006
• Approximately 10% of prescriptions and 28% of charges are denied
• Approximately 11% of Hypnotics prescriptions are substituted to the generic alternative