1 © ppc renewables s.a. the promise of renewable energy sources & their impact on security of...
TRANSCRIPT

1
©PPC RENEWABLES S.A.
The Promise of Renewable Energy Sources & their Impact on Security of Supply
Manthos KalliosDirector, Corporate Strategy & Business Development
“Energy Without Frontiers” ConferenceAthens, 22 May 2008

2
©
Global Market Overview
Greek RES Market

3
©
KEY GROWTH DRIVERSKEY GROWTH DRIVERS
International organizations predict drastic growth of RES in order to combat climate change…
Global decisions to promote a cleaner environment
Environmental conscience and acknowledgment of need to tackle climate change
Oil independence policies
Reduction in initial investment cost
More productive technology
Global decisions to promote a cleaner environment
Environmental conscience and acknowledgment of need to tackle climate change
Oil independence policies
Reduction in initial investment cost
More productive technology
1 Source: WGBU2 1 EJ = 278.000 GWh
1 Source: WGBU2 1 EJ = 278.000 GWh
Global Energy Production1 [EJ2]
…however dominance by RES is still far in the future

4
©
The total costs of electricity production from RES exceed those from conventional sources…
0,0
0,5
1,0
1,5
2,0
2,5
3,0
3,5
4,0
4,5
Nuclear Natural Gas Coal Wind PV Hydro Geothermy
* Includes levelized CapEx and OpEx Sources: OECD/IEA
0
20
40
60
80
100
120
140
Nuclear NaturalGas
Coal Wind PV Hydro Geothermy
Initial Investment Cost per MW Production Cost* per MWh
€ MM €
… but the evolution of technology and economies of scale are progressively reducing the cost differences between methods
… but the evolution of technology and economies of scale are progressively reducing the cost differences between methods

5
©
Demand for solar is accelerating although forecasts differ

6
©
This has resulted in a dramatic market capitalization of the solar sector
7
©
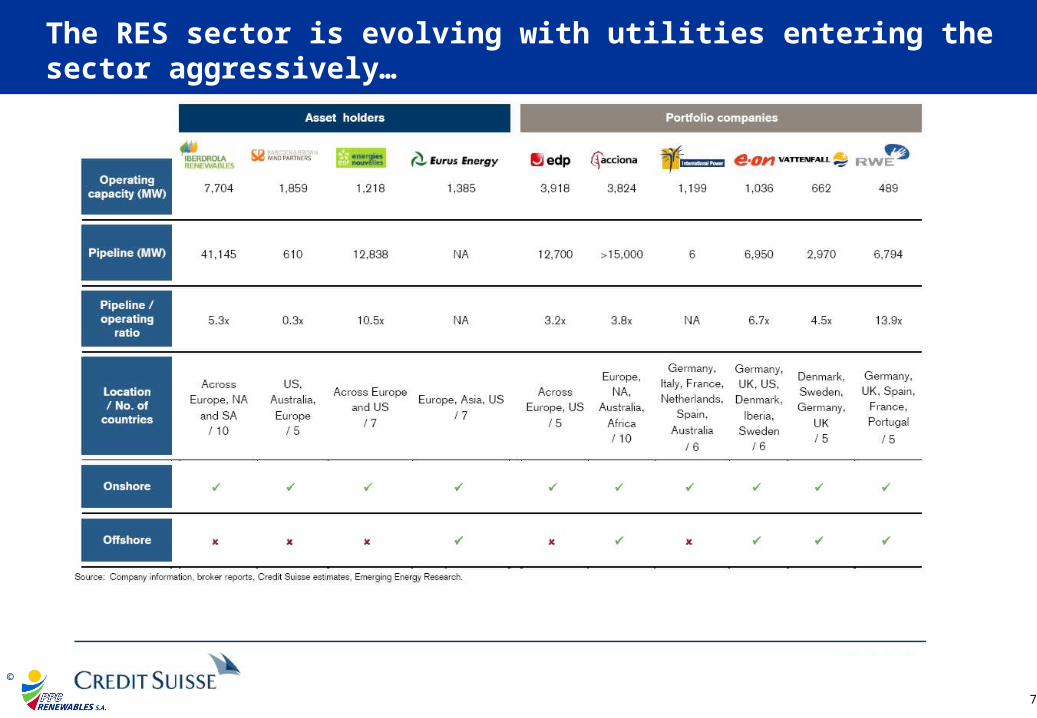
The RES sector is evolving with utilities entering the sector aggressively…

8
©
…leveraging also M&A initiatives

9
©
M&A Map for Wind

10
©
IPO Analysis – Recent Transactions

11
©
Financial performance differs across RES sectors

12
©
Solar sector stock performance is strong, despite the recent correction

13
©
Currently, offshore plays a minor role in wind energy production; however revamped interests indicates that substantial growth will take place

14
©
Key Uncertainties
Continuous growth for the solar industry or boom-bust cycles?
Tightness or abundance of supply from wind turbine manufacturers?
The government dilemma: What incentives, how much and when?
How can Network absorption impede or facilitate RES expansion?
Will RES expansion be used actively by governments as a lever to secure supply?

15
©
Global Market Overview
Greek RES Market

16
©
Greece has significant natural wealth for RES…
• Wind potential for some 14.000 MW
• Geothermal fields with production potential of ~350 MW (equivalent to 1.500 MW of wind power)
• Many springs and rivers for hydroelectric power
• Some of the highest solar irradiation rates in Europe
…but exploiting it fully will involve overcoming serious obstacles

17
©
78,1
60,0
49,3
31,529,0
33,631,0 29,4
39,0
25,021,0
12,5
20,1
13,29,0 8,0 10,0
7,0 5,7 7,53,6
6,0 5,1 5,0 6,0
21,0
0
10
20
30
40
50
60
70
80
90
Αυστρ
ία
Σουη
δία
Λάτβια
Φινλ
ανδί
α
Δανία
Σλοβ
ενία
Σλοβ
ακία
Ισπαν
ία
Πορτο
γαλία
Ιταλία
Γαλλ
ία
Γερμ
ανία
Ελλάδ
α
Ιρλα
νδία
Ολλαν
δία
Τσεχ
ία
Μ. Β
ρετα
νία
Λιθουα
νία
Λουξε
μβού
ργο
Πολω
νία
Ουγγα
ρία
Βέλγιο
Εστον
ία
Μάλ
τα
Κύπρο
ςΕ.Ε
.
The EU has set environmental improvement targets based on RES use which as a rule are not yet being met
Source: State of renewable energies in Europe, EurObserv’ER 2006
[%]
Electricity produced from RES in Europe, by country[% consumption]
Status 2005
Gap to 2010 target
EU Target
2007: EU member states decide to increase total energy produced from RES to 20% by 20202007: EU member states decide to increase total energy produced from RES to 20% by 2020
2001: All EU member states adopt national targets for the proportion of electricity consumption that should come from RES (Directive 2001/77/ΕU)
2001: All EU member states adopt national targets for the proportion of electricity consumption that should come from RES (Directive 2001/77/ΕU)
For 2020, the European Commission proposed the binding targets known as «20-20-20»— 20% of the European energy
production portfolio to be RES — 20% reduction in Greenhouse
Gas emissions, compared to 1990
— 20% energy savings— 10% of fuel used in transport to
be biofuel
Greece’s target for total energy consumed to come from RES has been set at 18%; hence RES have to account for 30-35% of electricity generation (this means some 10,000 MW of RES production by 2020)

18
©
Implementation of RES projects must be accelerated in order to achieve the 20,1 % target following the 77/2001/EC directive
Sources: DOE/EIA, ΥΠ.ΑΝ.
Amount & Proportion of RES Electricity Production in Greece
0
2
4
6
8
10
12
14
16
1999 2001 2003 2005 2007 2010
Pro
du
cti
on
[Τ
Wh
]
0%
5%
10%
15%
20%
25%
% R
ES
RES
% RES
Target(20,1%)
Wind will be the main driver for Greece to meet her RES targetsWind will be the main driver for Greece to meet her RES targets

19
©
GREEK RES MARKET [MW]
963
4.350
4.700
3.970
2.140
1.522
2.686
3.340
0
500
1.000
1.500
2.000
2.500
3.000
3.500
4.000
4.500
5.000
2007 2008 2009 2010 2011 2012 2013 2014
Ins
talle
d C
ap
ac
ity
[M
W]
OTHER RESGEOTHERMYPHOTOVOLTAICSMALL HYDROWIND
We hope that the 20,1% target will be achieved by 2012
The 20,1% target will
not be achieved by 2010
* Includes 4,5 TWh from large HPP* Includes 4,5 TWh from large HPP
Sources: Dept. of Energy/EIA, MinDev, RΑΕ, PPCR estimates
Drivers
Financially attractive environment for investments
Annulment of production permits that show no progress after 2 years
Passage of a Land Use Plan for RES
2007 2008 2009 2010 2011 2012 2013 2014TOTAL DEMAND [TWh] 60,8 62,8 64,8 67,0 68,7 70,5 72,3 74,2RES PRODUCTION* [TWh] 7,2 8,6 10,2 11,6 13,1 14,5 15,7 16,6% RES PRODUCTION 12% 14% 16% 17% 19% 21% 22% 22%

20
©
The interest for RES projects in Greece is significant…
TechnologyWith Operation
Licenses (1) [MW]
With Installation Permits
[MW]
With Production Permits (2)
[MW]
Applications for Production Permits (3)
[MW]
Wind 773,8 916,4 6.492,4 35.495,5
Biomass 32,1 23,5 94,8 451,6
Geothermic 0,0 0,0 8,0 335,5
Small Hydroelectric 101,9 103,9 514,3 1.864,5
Solar P/V 0,8 2,2 80,4 3.061,9
Total Capacity [MW] 908,6 1.046,0 7.189,9 41.209,0
1) The above mentioned Operation Licenses include RES projects from the Combined Production Permits of PPC2) These include the projects with Operation Licenses, Installation Permits and do not include Revoked Licenses3) These include the projects with Production Permits as well as Revoked Licenses
Source: RAE

21
©
…driven, in part, by attractive Feed-in Tariffs
Renewable Energy SourceFeed-in Tariff* (€/MWh)
Mainland Grid & Connected Islands
Non-Connected Islands
Onshore Wind 75,82 87,42
Offshore Wind 92,82
Small Hydro <15 MWe 75,82 87,42
Photovoltaic <100 kWp 452,82 502,82
Photovoltaic >100 kWp 402,82 452,82
Other Solar Technologies <5MW 252,82 272,42
Other Solar Technologies >5MW 232,82 252,42
Geothermy 75,82 87,42
Other RES 75,82 87,42
* According to RES Law 3468/06, increased by €2,82 in July 2007
These prices may be altered by the Ministry of Development following a proposal from RAE
These prices may be altered by the Ministry of Development following a proposal from RAE

22
©
Some key steps to accelerate RES expansion in Greece
Review of Installation and Production Permits (and Grid connection terms) for wind parks that haven’t yet begun construction
Different regulatory regime for PV installations <150 kWp
Broader scope for subsidizing RES projects, without allowing excess profits
Further improvement of the Permit Issuance process and the Land Use Plan

23
©
In Conclusion
There is already potential for RES to play a role in electricity supply both globally and in Greece in the short term
However, dominance of RES to the extent that we can talk about a real contribution to security of energy supply is still a distant prospect and should only be viewed in the medium to long term— In the short term, RES can only have limited role in security of supply
— In the medium term RES should be able to play a more significant role in the security of supply of the electricity supply market if national targets are met (e.g. 29% by 2020 for Greece)
— In the long term and as RES’ share in the electricity supply market increases with the development of new RES technologies and the efficient operation of a fast growing RES market, RES can play an even greater role in the security of supply of the electricity supply market;
In the even longer term, with the greater development of new RES technologies and the efficient operation of the RES market, RES could play the role of the catalyst that will drive the development of new consumer and industrial products that until today traditionally are “fueled” on petroleum or natural gas. This effective transition from petroleum “fueled” products would also have to be supported by the necessary State incentives both for industry and consumers in order to drive for this new technology and thus decrease even further countries’ dependence on these two fuels.

24
©
Manthos KalliosManthos Kallios+30-211-211 8000+30-211-211 [email protected]@ppcr.gr
Thank you for your attention!