1. principles of data management 2020
TRANSCRIPT

BIOSTATS 690C – Fall 2020 1. Principles of Data Management Page 1 of 28
Design Data
Collection Data
Management Data
Summarization Statistical
Analysis
Reporting
Unit 1
Principles of Data Management
“Always do right. This will gratify some people and astonish the rest”
-Mark Twain (1835-1910)
This unit is an overview of the themes underlying data management and best practices for the conduct of scientific research, especially that involving human subjects. It emphasizes the following: (1) Plan ahead! Oh, and really spend some time on this. You’ll be glad; (2) As a matter of best practice, write a data management plan (DMP). Increasingly, these are becoming mandatory by funding agencies. (3) If your study is large, develop a manual of operating procedures (MOOP). This is a road map of the “day to day” activities of research; (4) If your study involves developing questionnaires: plan ahead, take care that your survey items measure what they are supposed to measure, and be sure to do a pilot test; (5) Spend some time developing your data analysis plan, and; (6) Develop procedures for archiving your research including, in particular, saving your data in formats that can be read by future software programs.

BIOSTATS 690C – Fall 2020 1. Principles of Data Management Page 2 of 28
Design Data
Collection Data
Management Data
Summarization Statistical
Analysis
Reporting
Table of Contents Topic Page
Learning Objectives …………………………………………………………….
3
1. Key Terminology: Data Management, DMP, and MOOP ………….……. 4
2. Plan Ahead: General Guidelines …………………..…………………..…..
2.1 Write a Data Management Plan (DMP) ……………………..…….. 2.2 The Manual of Operation Procedures (MOOP)……………………. 2.3 Some Software Options for Entering/Managing/Analyzing Data ….
6
6 7 8
3. Questionnaire/Survey Development Basics ……………………..………..
3.1 Types of Survey Methods ……………………………………….….. 3.2 Categories of Survey Items .………… ..…..……………………..… 3.3 Question Structure ………………………………………………… 3.4 Constructing and Pre-testing a Data Collection Instrument ………….
12
12 14 15 20
4. Plan Ahead: Data, Coding and Data Entry …………………………..……
4.1 The Data Dictionary (also called a coding manual) …………….…... 4.2 Suggestions for Assessing Data Entry ……………..…………….....
21
21 23
5. Plan Ahead: Data Analysis ………………………………………………… 24
6. Plan Ahead: Databases for Data Storage ………………………………....
6.1 Components of a Database …………………………………..……. 6.2 Relational Databases versus Flat Files …………………………….. 6.3 Database Management Tips and Traps ………………………..……. 6.4 Document, document, document …………………………………….
26
26 27 27 28

BIOSTATS 690C – Fall 2020 1. Principles of Data Management Page 3 of 28
Design Data
Collection Data
Management Data
Summarization Statistical
Analysis
Reporting
Learning Objectives
When you have finished this unit, you should be able to:
• define data management, and the various roles of a “data manager”;
• explain the importance of developing a data management plan (DMP) and a manual of operating procedures (MOOP) that details all of the project activities together with methods for ensuring their quality;
• appreciate that there are many ways to collect data, ranging from self-administered paper survey to interviewer administered questionnaire to record abstraction to web-based data collection;
• explain the importance of word choice in the specification of survey items;
• explain the importance and nature of advanced planning for data collection including the specification of the following: procedures for coding, entering and analyzing data;
• explain how to choose appropriate appreciate hardware and software for a given data management project;
• explain the distinction between “relational” and “flat” data files and the advantages of a “relational” data file database design; and
• explain the importance of pre-testing and periodic quality control assessment of all aspects of data management.

BIOSTATS 690C – Fall 2020 1. Principles of Data Management Page 4 of 28
Design Data
Collection Data
Management Data
Summarization Statistical
Analysis
Reporting
1. Key Terminology: Data Management, DMP, and MOOP
A variety of definitions give a feel for their scope. “Data Management is the process of providing the appropriate labeling, storage, and access for data at all stages of a research project. Here you can find best practices, resources, and support services for biomedical research data”. (Source: datamanagement.hms.harvard.edu) “Data management is the practice of collecting, keeping, and using data securely, efficiently, and cost-effectively. The goal of data management is to help people, organizations, and connected things optimize the use of data within the bounds of policy and regulation so that they can make decisions and take actions that maximize the benefit to the organization. A robust data management strategy is becoming more important than ever as organizations increasingly rely on intangible assets to create value. Managing digital data in an organization involves a broad range of tasks, policies, procedures, and practices. The work of data management has a wide scope, covering factors such as how to
• Create, access, and update data across a diverse data tier
• Store data across multiple clouds and on premises
• Provide high availability and disaster recovery
• Use data in a growing variety of apps, analytics, and algorithms
• Ensure data privacy and security
• Archive and destroy data in accordance with retention schedules and compliance requirements”
(source: oracle.com.database.what-is-data-management)
“Data management is the practice of managing data as a valuable resource to unlock its potential for an organization. Managing data effectively requires having a data strategy and reliable methods to access, integrate, cleanse, govern, store and prepare data for analytics” (source: https://www.sas.com/en_us/insights/data-management/data-management.html)

BIOSTATS 690C – Fall 2020 1. Principles of Data Management Page 5 of 28
Design Data
Collection Data
Management Data
Summarization Statistical
Analysis
Reporting
“A data management plan is a living, written document explaining what you intend to do with your data during and following the conclusion of your research project. A data management plan is required by many funders. Even if it is not required, a data management plan can save you time and effort during your research as it forces you to organize your data, prepare it for the next step in its lifecycle, and clarify who will have access to it, how, and when.
If you plan on sharing your data, a data management plan can help you troubleshoot the issues you should address to make sharing simple. Finally, a data management plan helps ensure that your data remains usable to both you, your collaborators, and other researchers beyond the end of your project.”
(source: https://help.osf.io/hc/en-us/articles/360019931133-Creating-a-data-management-plan-DMP-document)
“A data management plan (DMP) describes data that will be acquired or produced during research; how the data will be managed, described, and stored, what standards you will use, and how data will be handled and protected during and after the completion of the project.” (source: https://www.usgs.gov/products/data-and-tools/data-management/data-management-plans) “A data management plan (DMP) …outlines how you will collect, organize, manage, store, secure, backup, preserve, and share your data …The particular requirements of a DMP will vary among funding agencies, so it is best to always consult the agency's resources for their specific needs. However, there are a few common attributes to all data management plans, including:
• An overview of the formats and types of data to be produced.
• Research methodology (data collection, processing, and analyzing).
• Roles & responsibilities in regards to data collection, description, processing, analyzing, and disseminating.
• Standards you will use to describe your data (metadata).
• Storage and backup procedures.
• Long-term archiving and preservation plan.
• Access policies and provisions for secondary uses.
• Security measures taken to protect data and/or participant confidentiality.”
(source: https://guides.nyu.edu/data_management/dmp)

BIOSTATS 690C – Fall 2020 1. Principles of Data Management Page 6 of 28
Design Data
Collection Data
Management Data
Summarization Statistical
Analysis
Reporting
2. Plan Ahead: General Guidelines
2.1 Write a Data Management Plan (DMP) Many funding agencies are now requiring the development of data management plans (DMP). This is a good thing as it forces our attention on many of the details required for excellence in research. As of this writing (Fall 2020), here are two very good sites for training in developing your DMP:
§ Harvard Catalyst – An Investigator’s Guide to Research Data Management Practices: https://catalyst.harvard.edu/pdf/regulatory/Investigators%20Guide%20to%20RDM%20practice.pdf
§ DMP Tool – Data Management General Guidance: https://dmptool.org/general_guidance#organizing-files
The data management plan (DMP) contains, but is not limited to, sections that address the following:
§ Data Types: Specify the types of data being collected (e.g. – survey, instrument measurement, image, etc) and who is collecting the data (e.g. – self report, interviewer administered, instrument).
§ Data and Metadata Structures: Data structures reflect the chronology of processing (raw à clean à new variable creation) and storage (as single files or as merged files known as metadata)
§ File Naming Conventions and Project Folder Organization: Ideally, develop and specify conventions for naming files (e.g. – visit 1 files might have names that begin with “v1” and so on) and organizing project folders (e.g. administrative, recruitment, measurement, follow-up, data management, data analysis, reporting, etc)
§ Policies for Access, Sharing and Re-Use of Project Data Develop explicit policies for who will be allowed access to which data and for what purposes. If the project is large enough, a subcommittee might be tasked with this responsibility
§ Plans for Archiving Specify how you will create a structured archive of project data for future use, taking care that human subjects confidentiality is protected and that the archived data is stored in a format that will be readable by future data management and statistical analysis software applications (e.g. – archived data might be include, minimally, data in “.csv” format)

BIOSTATS 690C – Fall 2020 1. Principles of Data Management Page 7 of 28
Design Data
Collection Data
Management Data
Summarization Statistical
Analysis
Reporting
2.2 The Operations Manual/Manual of Operating Procedures (MOOP) Your data management plan (DMP) is an overview document (“the 30,000 foot view”). A manual of operating procedures (MOOP) is a much more detailed “roadmap” of the day-to-day conduct of research. If the project is small enough, it may not need an operations manual to guide study conduct. Most will, however. An operations manual is a document that details study protocol (screening, informed consent, enrollment, intervention, measurement, follow-up, adverse events monitoring, interim analysis, reporting, publications). Here is a good site to visit for training in the development of a MOOP:
§ National Institutes of Health – Templates for Developing a Manual of Operating Procedures https://www.niams.nih.gov/grants-funding/conducting-clinical-research/trial-policies-guidelines-templates/data-safety-monitoring-guidelines-policies/clinical-study-templates-forms
In brief, a typical MOOP will have sections that address the following, and possibly more:
- Background and Introduction - Study Design and Specific Aims - Time Line and Study Flow - Inclusion and Exclusion Criteria - Subject Recruitment (screening, informed consent, enrollment) - Subject Retention - Data Definitions (exposure variables, outcome variables, covariates) - Study Forms - Data management - Quality Control Procedures - Human Subjects Protection - Confidentiality and HIPAA - Institutional Review Board (IRB) Approval Procedures - Statistical Data Analysis Plan - Data Safety Monitoring Board (DSMB) Approval Procedures - Reporting - Appendices (Study Organization, Investigators, Policies, etc)
Within the data management section, the manual of operating procedures will have sub-sections that address:
- Data collection - Data entry - Human subjects protection - Editing, storage, and back-up of data

BIOSTATS 690C – Fall 2020 1. Principles of Data Management Page 8 of 28
Design Data
Collection Data
Management Data
Summarization Statistical
Analysis
Reporting
2.3 Prepare for Data Collection
Plan ahead– prepare as much as possible before beginning data collection. Whenever possible, pilot the use of all data collection forms, and all data entry and other data processing steps.
Collect only needed data, and collect all the data you really need. This is easier said than done. It is easy to get caught in the trap of “while we’re at it, why not also measure…” and end up with too many variables, wasting time and effort collecting and editing irrelevant data that will never be used.
On the other hand, make sure that you do not omit any important variables. Review related papers, study protocols, and data collection forms to make sure that you are gathering information on important confounding and descriptive factors for your study population. Before final printing, have data collection forms reviewed by all key members of the research team and other colleagues to make sure there are no missing factors. (It’s easy to inadvertently “edit out” a line in a cut-and-paste operation.)
Select appropriate hardware and software for data entry and analysis and anticipate that this is a major budget item. Computer equipment and software programs are often major budget items for a research study. Knowledge of the scope of the project is informative in this regard. For example,
§ Are you collecting 20 items on each of 50 subjects, or hundreds of items on many thousands of subjects?
§ Is one person collecting and entering the data, or do you have teams of interviewers and a large data entry staff?
§ Are you collecting and entering data at a single site, or at multiple sites?
These and other factors (budget, experience) dictate the choice of equipment and software needed for the project.

BIOSTATS 690C – Fall 2020 1. Principles of Data Management Page 9 of 28
Design Data
Collection Data
Management Data
Summarization Statistical
Analysis
Reporting
Design forms for recording measurements that are:
§ Pre-coded – This means that codes are included on the form. § Self-explanatory – Avoid abbreviations. Avoid choices that are unclear. § Coherent – Check that questions proceed in a reasonable manner. § Clearly formatted, Form should be aesthetic, easy to read and should flow simply. § Pre-tested and validated – Make sure you are getting the information that you intend to get.
Format data forms to minimize collection and entry errors.
§ Use boxes or lines and other clues for data entry so as to clearly indicate the format and location for writing in responses. For example,
Date of Birth: __ __ / __ __ / __ __ __ __
(mon / day / year) Weight: __ __ __ . __ kg
§ Use arrows and indentation as well as text clues if you must have skip patterns. Where large sections of a questionnaire apply to only some subgroup of the sample, use different colored paper for different sections.
§ Use bolding, underlining, CAPITALIZATION, italics, and other changes in font style and size to make the data form simpler to use. Tip- BE CONSISTENT … It is good habit to choose a particular formatting style and stick with it. For example, instructions are written in one style/size font, questions in another, codes and choices in yet a third consistent style.
§ Tip- LABEL DATA COLLECTION FORMS …. Generously label pages (use headers, footers) with dates and ID numbers, form names and/or numbers. Pages can get separated accidentally. Well-labeled forms can be easily re-assembled, or appropriately disassembled (removal of confidential information pages) for data entry and storage.
§ Tip – ACTUAL DATA ENTRY SHOULD BE JUST THAT: DATA ENTRY ONLY. Never require either the participant or the data entry person to do any calculations or decision making.
• Example of bad practice “How many months has it been since your last menstrual period?”
• A better approach – Ask two items (and let the computer do the calculation!) “What is today’s date?”; and “What was the date of your last menstrual period?”
BIOSTATS 690C – Fall 2020 1. Principles of Data Management Page 10 of 28
Design Data
Collection Data
Management Data
Summarization Statistical
Analysis
Reporting
2.3 Write a Data Management Plan (DMP) The data management plan (DMP) contains, but is not limited to, sections that address the following:
§ Data Types: Specify the types of data being collected (e.g. – survey, instrument measurement, image, etc) and who is collecting the data (e.g. – self report, interviewer administered, instrument).
§ Data and Metadata Structures: Data structures reflect the chronology of processing (raw à clean à new variable creation) and storage (as single files or as merged files known as metadata)
§ File Naming Conventions and Project Folder Organization: Ideally, develop and specify conventions for naming files (e.g. – visit 1 files might have names that begin with “v1” and so on) and organizing project folders (e.g. administrative, recruitment, measurement, follow-up, data management, data analysis, reporting, etc)
§ Policies for Access, Sharing and Re-Use of Project Data Develop explicit policies for who will be allowed access to which data and for what purposes. If the project is large enough, a subcommittee might be tasked with this responsibility
§ Plans for Archiving Specify how you will create a structured archive of project data for future use, taking care that human subjects confidentiality is protected and that the archived data is stored in a format that will be readable by future data management and statistical analysis software applications (e.g. – archived data might be include, minimally, data in “.csv” format)

BIOSTATS 690C – Fall 2020 1. Principles of Data Management Page 11 of 28
Design Data
Collection Data
Management Data
Summarization Statistical
Analysis
Reporting
2.4 Some Software Options for Entering/Managing/Analyzing Data
There are a variety of available software that are data management and analysis related. SOFTWARE Type FEATURES EXAMPLES
Spreadsheet Data entered into a matrix of columns and rows; Simple transformations, descriptions, sorting, reporting, graphics
MS Excel Lotus 1-2-3 Gnumeric
Database Data entered with interactive editing; greater ability to control, manipulate, access and report data; design of screens for data entry
REDCap MS Access dBase ParAccel Epi Info Open Clinica SQL, MySQL
Statistical Emphasis is on statistical analyses and graphics; database features are usually also present
R SAS Stata
Word Processing Used for editing reports, papers, design of forms; Complex formatting
MS Word
Text Editing Editing of ASCII files, where formatting codes, characters are not allowed
Notepad Wordpad TextWrangler

BIOSTATS 690C – Fall 2020 1. Principles of Data Management Page 12 of 28
Design Data
Collection Data
Management Data
Summarization Statistical
Analysis
Reporting
3. Questionnaire/Survey Development Basics
Measurement can happen in a variety of ways:
- Instrument measurement (eg – blood pressure assessment using a sphygmomanometer)
- Self report (eg – subject completes a paper survey instrument)
- Chart abstraction (eg – project staff abstracts information from a medical record)
- Interview - A clinician who records of information during an examination
- Records abstraction (eg – project staff queries a public registry database)
- Web-based (eg – REDCap, Survey Monkey)
When measurement occurs by querying a human subject, survey methodology is required.
3.1 Types of Survey Methods
Similarly, a survey of a human subject can happen in a variety of ways (with some overlap of the above):
• Self-administered paper instrument • Interviewer administered telephone survey
• Observation
• Face-to-Face Interview, using paper or laptop entry • Touch screen survey, interviewer or self-administered

BIOSTATS 690C – Fall 2020 1. Principles of Data Management Page 13 of 28
Design Data
Collection Data
Management Data
Summarization Statistical
Analysis
Reporting
A self-administered survey might be by mail or at a research site or, more recently, via the computer and the internet.
An interviewer-administered survey is typically by telephone or face-to-face. The rules governing the inclusion of a respondent should be clear, such as
o Can a proxy (e.g., a family member) respond for someone unavailable or unable (e.g., dementia) o Can a family member or other proxy translate for a non-English speaker, or are official translators
or translated forms required?
Take care in the choice of your survey method. There are trade-offs.
• Cost effectiveness (time, money, personnel) – self administered is cheaper. • Privacy – self administration affords more privacy.
• Standardization (completeness and precision) – interviewer- administered survey questions are more standardized.
• Accuracy - interviewer administered is likely to yield more accurate data. • Validity - same comment; interviewer administered is likely to be better in this regard. • Bias - Consider this. Persons who complete online surveys self select!! Who self selects? And who does not self select?
BIOSTATS 690C – Fall 2020 1. Principles of Data Management Page 14 of 28
Design Data
Collection Data
Management Data
Summarization Statistical
Analysis
Reporting
Some things to think about:
• How much instruction is needed with the instrument? A complex questionnaire, with many skip patterns may be more accurately completed if the instrument is interviewer administered. Control over the questionnaire (e.g., order of questions, ability to clarify or probe, control over who fills out the form, desire for spontaneity) are factors in the choice of form administration, interviewer versus self.
• Response rates are also affected by concerns of the interviewee and the method of administration. Question sensitivity, concerns about privacy, and the interest level of the interviewee will all influence response rates. Response rates are also influenced by the level of formality of the interview and the ability to probe for clarification or re-word questions.
• Often, a study will utilize multiple survey types. For example, subjects might be asked attitudinal questions in an interview. This might be followed with a review of their medical record and/or insurance records to obtain additional clinical/utilization data. Thus a researcher typically has to develop more than one data collection instrument.
3.2. Categories of Survey Items
There are at least four (4) categories, and their distinction matters
• Behavioral (e.g., utilization data)
§ Attitudes, knowledge (e.g., opinions, scale scores)
§ Personal (e.g., demographic data, medical records, physical exam)
§ Environmental (e.g., office practice, seasonal or geographic data)
Whether a question is closed-ended or open-ended is a matter of question structure (next section).

BIOSTATS 690C – Fall 2020 1. Principles of Data Management Page 15 of 28
Design Data
Collection Data
Management Data
Summarization Statistical
Analysis
Reporting
3.3. Question Structure
There are trade-offs in the choice of open-ended versus pre-coded closed ended questions.
- If the range of answers is limited and well established, pre-coding of questions is preferred.
- If investigators cannot determine in advance what the responses or main categories of responses will be, it may be best to start with open-ended questions in a pilot study, and progress to pre-coded responses for the full study.
- It is also possible to combine the methods, listing and pre-coding common or expected responses, and adding an “Other” category, with a place for respondents to write-in.
Open-ended Questions
For example - "What kinds of activities would you like to spend more time on in your leisure hours?"
Open-ended questions are employed when the researcher cannot anticipate the various ways in which people are likely to respond to a question. Respondents are given freedom to decide the aspect, form, detail and length of responses.
There may be difficulties with recording and subsequent coding of open-ended questions for data entry and summarization: How many responses per subject are allowed? How should the responses be grouped into activity types? It is better to settle this as much as possible before data is collected. If you can make these decisions, you can often avoid an open-ended question.
Tip - Sometimes, in the preliminary phases of instrument development, it is VERY HANDY conduct an informal focus group with knowledgeable persons for the purpose of identifying closed-ended responses. The end result might be a data collection instrument that is sparing in its inclusion of open ended questions. This being said, in such instances an item might include a set of the most likely closed ended responses plus an opportunity for a write-in response.

BIOSTATS 690C – Fall 2020 1. Principles of Data Management Page 16 of 28
Design Data
Collection Data
Management Data
Summarization Statistical
Analysis
Reporting
Pre-coded (or close-ended) Questions
For example - "When did you last go to the movies?" (Circle ONE response).
1. Within the last 7 days 2. 8 - 14 days ago 3. 15 - 30 days ago 4. More than 30 days ago 5. I never go 6. Don't know / can't remember.
Close-ended questions are characterized by a limited number of response categories available. With pre-coded, close-ended questions, responses may be ordered (e.g., Likert scale responses) or unordered (e.g., race, gender, marital status).
Responses should be mutually exclusive and exhaustive, whenever possible – no overlap, ambiguity of categories, and no missing category.
Caution should be taken to avoid having too few choices and forcing a category of response that the subject doesn't fit into vs. having too many choices resulting in the subject having difficulty making a choice.
The choice “OTHER ____________________” is often added for the rare or un-thought of answer.
Consistent coding should be employed throughout a form when reasonable (e.g., 0 = No, 1 = Yes, and 9 = unknown are commonly used). Once you choose a scheme, stick with it.
§ It is advisable to have more rather than less detail -- subsequent recoding (i.e., collapsing groups) to fewer categories is always possible. Tip – Collect data on age using today’s date and date of birth which is then followed by a computer calculation of age.
• Example of bad practice “How old are you? CHECK ONE: __ Less than 20 __ 20-29 __ 30-49 __ 50-64 __ 65 or older
• A better approach – (Following assumes that today’s date has been entered) “What is your date of birth?
BIOSTATS 690C – Fall 2020 1. Principles of Data Management Page 17 of 28
Design Data
Collection Data
Management Data
Summarization Statistical
Analysis
Reporting
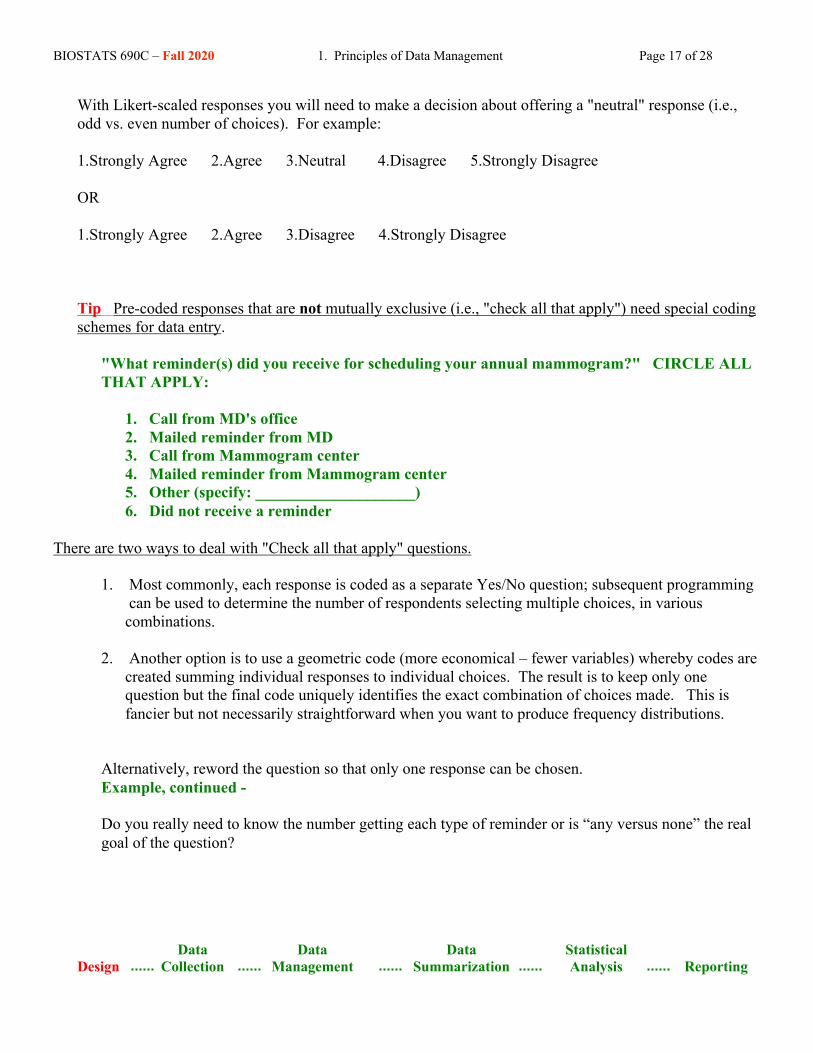
With Likert-scaled responses you will need to make a decision about offering a "neutral" response (i.e., odd vs. even number of choices). For example:
1.Strongly Agree 2.Agree 3.Neutral 4.Disagree 5.Strongly Disagree
OR
1.Strongly Agree 2.Agree 3.Disagree 4.Strongly Disagree
Tip Pre-coded responses that are not mutually exclusive (i.e., "check all that apply") need special coding schemes for data entry.
"What reminder(s) did you receive for scheduling your annual mammogram?" CIRCLE ALL THAT APPLY:
1. Call from MD's office 2. Mailed reminder from MD 3. Call from Mammogram center 4. Mailed reminder from Mammogram center 5. Other (specify: ____________________) 6. Did not receive a reminder
There are two ways to deal with "Check all that apply" questions.
1. Most commonly, each response is coded as a separate Yes/No question; subsequent programming can be used to determine the number of respondents selecting multiple choices, in various combinations.
2. Another option is to use a geometric code (more economical – fewer variables) whereby codes are created summing individual responses to individual choices. The result is to keep only one question but the final code uniquely identifies the exact combination of choices made. This is fancier but not necessarily straightforward when you want to produce frequency distributions.
Alternatively, reword the question so that only one response can be chosen. Example, continued -
Do you really need to know the number getting each type of reminder or is “any versus none” the real goal of the question?

BIOSTATS 690C – Fall 2020 1. Principles of Data Management Page 18 of 28
Design Data
Collection Data
Management Data
Summarization Statistical
Analysis
Reporting
Skip Patterns
Remember: Skip patterns in questionnaires generate legitimate blanks; this type of missing data is actually anticipated. Consider giving a special code to legitimate blanks so that these can be distinguished from data that are missing for other reasons (eg – refusal, omitted by mistake, etc).
Skip patterns must be clearly marked on the instrument to avoid errors where responses to questions are given, though not expected or appropriate.
BEWARE!! When designing a study, it is important to estimate to what extent sample sizes for analysis of specific questions may be altered by skip patterns.

BIOSTATS 690C – Fall 2020 1. Principles of Data Management Page 19 of 28
Design Data
Collection Data
Management Data
Summarization Statistical
Analysis
Reporting

BIOSTATS 690C – Fall 2020 1. Principles of Data Management Page 20 of 28
Design Data
Collection Data
Management Data
Summarization Statistical
Analysis
Reporting
3.4. Constructing and Pre-testing the Questionnaire
Until you try it out, you don’t really know if it works. We sure hope that the instrument, together with the protocol for its administration, produces data that are accurate, consistent and complete.
A variety of glitches can arise. Ambiguous questions lead to non-analyzable responses. Poorly worded questions can produce biased answers. Vague questions can produce vague responses.
Thus, the survey instrument development activities should be accompanied by plans for coding, entering and analyzing the data. Consider, too, such issues as the physical placement of questions on the paper, and whether or not the responses to the questions will lead to data that can actually be analyzed to address the research hypothesis.
The amount of instruction needed directly on a form to complete an interview/survey depends greatly on the method chosen for data collection (mail vs. telephone vs. personal interview).
Avoid questions that are:
• Ambiguous • Inappropriate/unnecessary • Too precise • Too complex/cryptic • Non-specific/vague • Double questions • Double negatives • Objectionable • Too personal/intrusive • Embarrassing • Demanding • Require significant recall • Presuming
etc. (the list may be endless –okay, that might be an exaggeration!)

BIOSTATS 690C – Fall 2020 1. Principles of Data Management Page 21 of 28
Design Data
Collection Data
Management Data
Summarization Statistical
Analysis
Reporting
4. Plan Ahead: Data, Coding and Data Entry
4.1 The Data Dictionary (also called a coding manual) Statistical analysis is actually an analysis of codes! Often, “code” is the same as the data (eg – 34 years). But, sometimes, the “code” is just a place holder. Recall from your introductory biostatistics class that data are of various types. One type is nominal. Nominal data are names, not numbers. In fact, the names may be replaced by numerical codes that are only codes and should not be mis-interpreted as numbers. Gender is an example of a nominal variable for which data are just codes. Eg; we might use the code “1” to record that individual is female; “2” might be used for males. Codes transform the vast amounts of information collected into a representation that permits comparison, measurement, and analysis. A dictionary that links information to code is called a data dictionary; this is also called a “coding manual” A data dictionary serves other purposes, too. It is a useful reference in designing data entry programs, entering, and editing data. Tip: All coding decisions should be made before data collection begins (excluding certain open-ended questions). Coding manuals have some defining features: • Every variable (field) has an identifying name (“label”, “variable name”). • Every possible value of each field has an associated "code"; typically, this is either a number or
one or more letters. • The coding scheme for each variable (field) is spelled out explicitly; this includes special
instructions (except for some open-ended questions where not all responses are known and coding occurs on an on-going basis)
• Thus, codes are needed for all options, including missing values, "don't know" responses, and
not applicable responses. Note that these have implications for editing and analysis instructions.

BIOSTATS 690C – Fall 2020 1. Principles of Data Management Page 22 of 28
Design Data
Collection Data
Management Data
Summarization Statistical
Analysis
Reporting
Example of a Data Dictionary/Coding Manual
Position Variable Variable Label Units Codes 1 ahrq_ccs United States Agency for Healthcare
Research and Quality’s Clinical Classifications Software (AHRQ-CCS) Procedure Category
2 age Age years 3 gender Gender 1 = male; 2 = female 4 race Race 1 = Caucasian
2 = African American 3 = Other
5 asa_status American Society of Anesthesiologist Physical Status
1 = I – II 2 = III 3 = IV - VI
6 bmi baseline
Body Mass Index kg/m2 7 baseline_cancer
ba Cancer 0 = No; 1 = Yes
8 baseline_cvd Cardiovascular/Cerebrovascular Disease
0 = No; 1 = Yes
9 baseline_dementia Dementia 0 = No; 1 = Yes 10 baseline_diabetes Diabetes 0 = No; 1 = Yes 11 baseline_digestive Digestive Disease 0 = No; 1 = Yes 12 baseline_osteoart Osteoarthritis 0 = No; 1 = Yes 13 baseline_psych Psychiatric Disorder 0 = No; 1 = Yes 14 baseline_pulmonary Pulmonary Disease 0 = No; 1 = Yes 15 baseline_charlson Charlson Comorbidity Index 16 mortality_rsi Risk Stratification Index (30-Day
Mortality)
17 complication_rsi Risk Stratification Index (In-Hospital Complications)
18 ccsMort30Rate Overall Incidence of 30-day Mortality for Each AHRQ-CCS Procedure Category
19 ccsComplicationRate Overall incidence of In-Hospital Complications for Each AHRQ-CCS Procedure Category
20 mort30 30-Day Mortality 0 = No; 1 = Yes 21 complication In-Hospital Complication 0 = No; 1 = Yes
Tips!!!! (1) Variable names must NOT have spaces; (2) Avoid using upper case when naming variables.

BIOSTATS 690C – Fall 2020 1. Principles of Data Management Page 23 of 28
Design Data
Collection Data
Management Data
Summarization Statistical
Analysis
Reporting
4.2 Suggestions for Assessing Data Entry Quality Control Assessment of Single Variables • Review frequency distributions of each variable
• Complete editing process
• Check for outliers (e.g. print out data for subject ID’s whose values exceed 3 standard
deviation units distance from the mean)
• Check for internal consistency (e.g. male who menstruates is not logical)
• Check for missing values (those due to problems in data collection vs. "expected" missing values)
• Re-review basic descriptive findings and the distribution of the data once "cleaned" Quality Control Assessment of Variables Two at a Time • Review patterns of associations within study sample
• Review magnitude of associations within study population
• Check likelihood that associations in the sample reflect population from which sample was
drawn
• Analyze statistical significance of associations

BIOSTATS 690C – Fall 2020 1. Principles of Data Management Page 24 of 28
Design Data
Collection Data
Management Data
Summarization Statistical
Analysis
Reporting
5. Plan Ahead: Data Analysis Begin drafting your analysis plan early!
• It will force you to identify in advance most of the measurements you will require
• You will discover that it requires multiple iterations and, for this reason, you will be glad that you started this thinking early
• When the time for data analysis finally arrives, you will be grateful for this “roadmap”! Some Guidelines and Suggestions
• Be as explicit and as detailed as possible
• Restate your specific aims and accompanying hypotheses
• Organize your proposed analyses by specific aim
Example Statistical Analysis Summary statistics will be computed to describe the analysis cohort. Descriptive statistics will be calculated for participants’ demographics, physical characteristics, behavioral characteristics, medication use, and other relevant variables. The distributions of these variables will be compared between disease groups using either paired t-tests or chi square tests as appropriate for the variable scale. We also will provide summary statistics for breast cancer characteristics such as disease stage, grade, and ER/PR status. Upon completion of the descriptive analysis, we will move to analyses addressing each specified aim. All analyses will be performed using Stata version 16 (StataCorp, College Station, TX). Specific Aim #1: To evaluate if VEGF and YKL-40 levels 1-3 years prior to diagnosis are predictive of breast cancer risk. We hypothesize that plasma VEGF and YKL-40 levels will be higher among breast cancer cases than among individually matched controls.
We will assess the normality of the distributions of VEGF and YKL-40 graphically using quantile-quantile plots and formally using the Shapiro-Wilk test. If the distribution of either VEGF or YKL-40 is determined to be non-normal, then an appropriate transformation will be applied or non-parametric methods will be used. Descriptive statistics for VEGF and YKL-40 will be calculated for cases and controls. The distributions of VEGF and YKL-40 will be compared between cases and controls using paired t-tests or Wilcoxon signed rank tests as appropriate.
Conditional logistic regression will be used to determine if the odds of breast cancer are increased among individuals with higher plasma VEGF or YKL-40 levels. VEGF and YKL-40 each will be considered as the primary exposure variable in separate regressions, and a third regression model will assess the influence of each factor while adjusting for the other (i.e., the model will include both VEGF and YKL-40). VEGF and YKL-40 will be kept as continuous variables or re-parameterized as ordinal with four levels according to quartile value among the controls. Variables found to be associated with breast cancer in previous studies will be evaluated for inclusion as potential confounders. Categorizations of the confounders will be based on common cut-points or from the original response categories with collapsing of categories to prevent small cell counts. Design variables will be created for categorical variables as appropriate. The regression models will be built by first fitting univariable conditional logistic regression models for each variable with the outcome of breast cancer; all variables with p<0.25 in the univariable model then will be included in a preliminary multivariable model along with VEGF and/or YKL-40. Next we will test the significance of each covariate using likelihood ratio tests. All covariates with a p value less than 0.10 from the likelihood ratio test will be retained in the model. Fractional polynomials will be used to assess the assumption that continuous variables are linear in the logit. The Hosmer-Lemeshow test will be used to assess model goodness of fit, and delta deviance will be used to assess the stability of the model.

BIOSTATS 690C – Fall 2020 1. Principles of Data Management Page 25 of 28
Design Data
Collection Data
Management Data
Summarization Statistical
Analysis
Reporting
Specific Aim #2: To evaluate if the associations between VEGF and YKL-40 levels and breast cancer vary by a) race/ethnicity, b) disease characteristics such as estrogen receptor (ER) status, progesterone receptor (PR) status, stage, and grade, or c) hormonal factors including exogenous hormone use and endogenous hormone levels. We hypothesize that selected demographic characteristics modify the associations of VEGF and YKL-40 and breast cancer risk and that, among cases, disease status varies with demographic characteristics.
Aim #2a: Descriptive statistics for participant characteristics will be repeated with stratification by race/ethnicity. Analysis of variance or chi square tests will be used to assess differences in participant characteristics across race/ethnicity. Summary statistics for VEGF and YKL-40 also will be calculated within the racial/ethnic subgroups and compared across these groups using analysis of variance or Kruskal-Wallis tests depending on the normality of VEGF and YKL-40. We will fit the parsimonious conditional logistic regression models developed for Specific Aim #1 within racial/ethnic groups. We also will formally test for interaction between race/ethnicity and VEGF and YKL-40 by including appropriate interaction terms in conditional logistic regression models. The significance of these interaction terms will be assessed using likelihood ratio tests.
Aim #2b: Among cases only, we will compare VEGF and YKL-40 levels across categories of ER, PR, stage, and grade using t-tests or analysis of variance as appropriate. We will fit multinomial logistic regression models including the covariates from Specific Aim #1 for each disease characteristic. For example, the regression for ER status will have a dependent variable with three levels: no disease, ER positive disease, and ER negative disease. Such analyses will provide odds ratios for each level of the disease characteristic, allowing us to examine if VEGF and YKL-40 have different associations with breast cancer depending on disease characteristics.
Aim #2c: We will fit the parsimonious conditional logistic regression models developed for Specific Aim #1 within strata defined by hormonal factors. We will examine hormone therapy use as a three level categorical variable (never, past, current) for both unopposed estrogen and estrogen and progesterone combination formulations. For these analyses, endogenous hormone levels, if available, will be stratified into quartiles based on the distribution among controls. We also will formally test for interaction between VEGF and YKL-40 and these factors by including appropriate interaction terms in conditional logistic regression models. The significance of these interaction terms will be assessed using likelihood ratio tests. Specific Aim #3: To determine if VEGF and YKL-40 levels can be used to improve the discrimination of the Gail model. We hypothesize that plasma VEGF and YKL-40 levels will improve discrimination beyond that observed in a model with only Gail risk factors. We will follow an analytic plan similar to that previously employed in an application of the Gail model to the WHI cohort. We will use the area under the ROC curve to assess model discrimination. The ROC curve will be generated and the area under the curve calculated after each of the following conditional logistic regression models: 1) Gail model risk factors only, 2) Gail model risk factors and VEGF level, 3) Gail model risk factors and YKL-40 level, and 4) Gail model risk factors, VEGF, and YKL-40 levels. Confidence intervals will be constructed for the area under the curve and used to assess whether the addition of VEGF and/or YKL-40 significantly improved model discrimination.

BIOSTATS 690C – Fall 2020 1. Principles of Data Management Page 26 of 28
Design Data
Collection Data
Management Data
Summarization Statistical
Analysis
Reporting
6. Plan Ahead: Databases for Data Storage
6.1 Components of a Database A workable database is designed as a WHOLE and is the integration of many components • A database is an organized collection of related information/data • Data are stored in a database file (eg – “spreadsheet”. In R, it might be a “dataframe”) • All data for a particular entry is known as a record (eg – “row” in spreadsheet) • Each item of information within a record is known as a field (eg – “cell entry” in row of spreadsheet) • Before entering data into a database file, the file's field structures (“columns” in spreadsheet, object in R) must be specified. Translation: How are you defining your variables and their measurement? Think data dictionary!
- field name - number of characters
- allowed entries (numbers with decimals, integers, characters, etc) • Certain types of fields(variables) may require special consideration: • Numeric – contains only numbers
• Text or Character – may contain letters, numbers or other keyboard characters • Logical – Y/N (“yes/no”) or T/F (“true/false”)
• Special Field Types: e.g., SSN, phone #, etc.
• Dates – contain dates in specified formats (some applications treat these as character fields, some as numeric – which may affect how this information is transferred between programs) – special attention is needed.

BIOSTATS 690C – Fall 2020 1. Principles of Data Management Page 27 of 28
Design Data
Collection Data
Management Data
Summarization Statistical
Analysis
Reporting
6.2 Relational Databases versus Flat Files In a flat file, ALL of the data for one individual is included in the one file. Many data files (especially those that are actually analyzed) are created as flat files. In such files, all of the data for one individual is included in the same file. Flat files waste space when different individuals contribute different amounts of data. Flat files are cumbersome to work with, unless the study is very small. A relational database is comprised of multiple, smaller files that are “interconnected” through the use of link fields. In a relational database, a link field "relates" files. The linking field is usually the study id, so that study id appears as a field in every file. In this way, it is possible to interconnect files having varying numbers of fields and records. Only the disk space needed is used; thus, more efficiency is obtained. Database software applications are available to relate databases through menu options or via programming - depending on what relationships need to be established. 6.3 Database Management Tips and Traps
Tips • Place each type of category of information (e.g. demographics) in its own database file. For
example, demographics might be stored in one database file, HIV risk behaviors in another. Retain in each file one or more common linking fields (e.g. study ID)
• Choose file names and field names which are as descriptive as possible (an important tip in any
software application) • Always back-up database files before making any changes to them

BIOSTATS 690C – Fall 2020 1. Principles of Data Management Page 28 of 28
Design Data
Collection Data
Management Data
Summarization Statistical
Analysis
Reporting
Traps • "The Bigger, The Better" theory creates databases which can be very difficult to work with • Problems include entering, updating/editing and retrieving data.
6.4 Document, Document, Document
Document all corrections, changes, and updates made to data files.. You may have to explain them later. Define a system for naming computer files that enables you to keep track of the multiple versions of the study data. When you make any important changes to a data file, you may need to keep an early version (e.g. because it is specific to a journal article submission) along with the updated or corrected version. Keep up-to-date lists of all data and program files, detailing the date started, most recent date saved, along with the purpose. Developing a table to list information required is one simple way to do this. For example, a table such as the one below can be created, filed in a notebook and updated on a regular basis. It is easy to let the documentation process lapse. Take time, on a regular basis to update your documentation. It might be reasonable to plan an hour every Friday afternoon to bring study documentation up-to-date. Example Database Documentation Table: Stroke and Anti-Hypertensive Agent Use Filename
Description
Date Created
Last Update
Location/backup
Strokeaha1.mdb Access database – for Teleform fax entry of data – 2 data tables: lab1 and bp1
06/28/2018 01/24/2019 Teleform computer in Porter 5A ZIP: BMC Proj/Stroke ZIP: BMC-BU1/Stroke
Lab1.xls Lab data exported from strokeaha1.mdb
02/07/2019 ZIP: BMC Proj/Stroke ZIP: BMC-BU1/Stroke
Bp1.xls Blood pressure data exported from strokeaha1.mdb
02/07/2019 ZIP: BMC Proj/Stroke ZIP: BMC-BU1/Stroke
Lab1.sas7bdat SAS data version of lab1.xls from DBMS copy lab1.prg
02/07/2019 ZIP: BMC Proj/Stroke ZIP: BMC-BU1/Stroke
Bp1.sas7bdat SAS data version of bp1.xls from DBMS copy bp1.prg
02/07/2019 ZIP: BMC Proj/Stroke ZIP: BMC-BU1/Stroke