1 private health insurance in the oecd the oecd health project francesca colombo, oecd gastain, 7...
TRANSCRIPT

1
Private Health Insurance in the OECD
The OECD Health Project
Francesca Colombo, OECDGastain, 7 October 2004
http://www.oecd.org/health
2
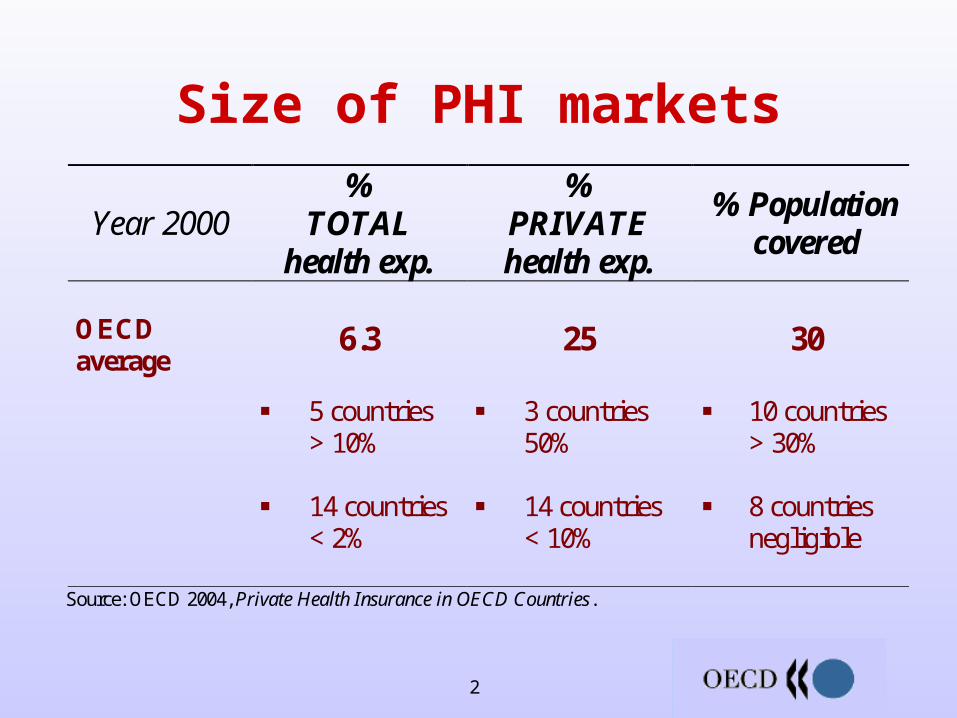
Year 2000 %
TOTAL health exp.
% PRIVATE health exp.
% Population covered
OECD average
6.3
5 countries > 10% 14 countries < 2%
25
3 countries 50% 14 countries < 10%
30
10 countries > 30% 8 countries negligible
Source: OECD 2004, Private Health Insurance in OECD Countries.
Size of PHI markets
3
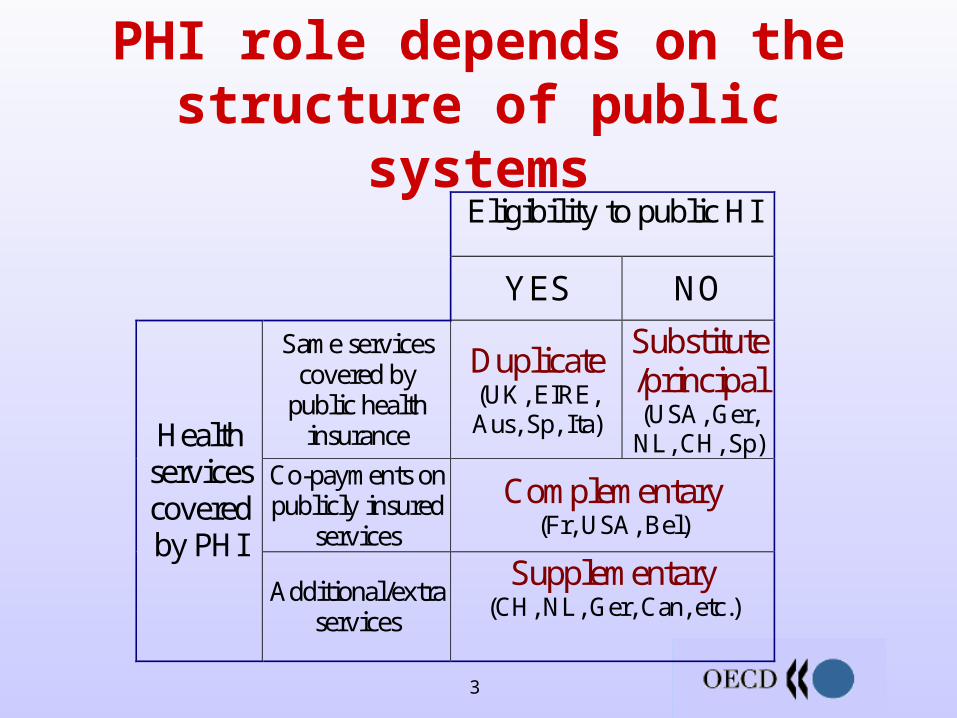
PHI role depends on the structure of public systems Eligibility to public HI
YES NO
Same services covered by
public health insurance
Duplicate (UK, EIRE, Aus, Sp, Ita)
Substitute/principal (USA, Ger,
NL, CH, Sp) Co-payments on publicly insured
services
Complementary (Fr, USA, Bel)
Health services covered by PHI
Additional/extra services
Supplementary (CH, NL, Ger, Can, etc.)
4
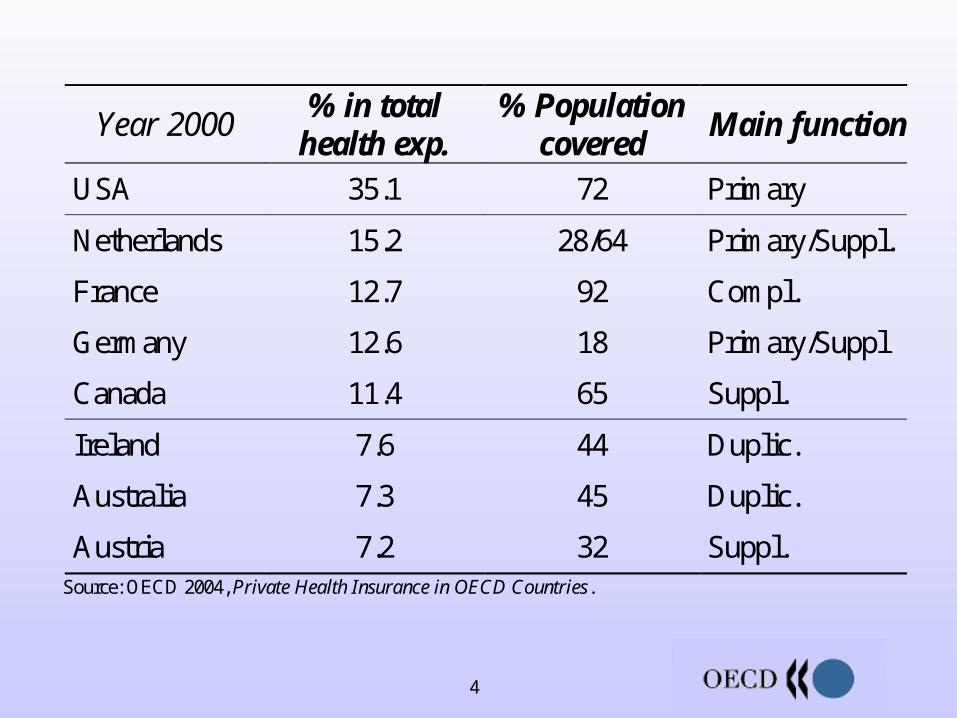
Year 2000 % in total
health exp. % Population
covered Main function
USA 35.1 72 Primary
Netherlands 15.2 28/64 Primary/Suppl.
France 12.7 92 Compl.
Germany 12.6 18 Primary/Suppl
Canada 11.4 65 Suppl.
Ireland 7.6 44 Duplic.
Australia 7.3 45 Duplic.
Austria 7.2 32 Suppl.
Source: OECD 2004, Private Health Insurance in OECD Countries.
5
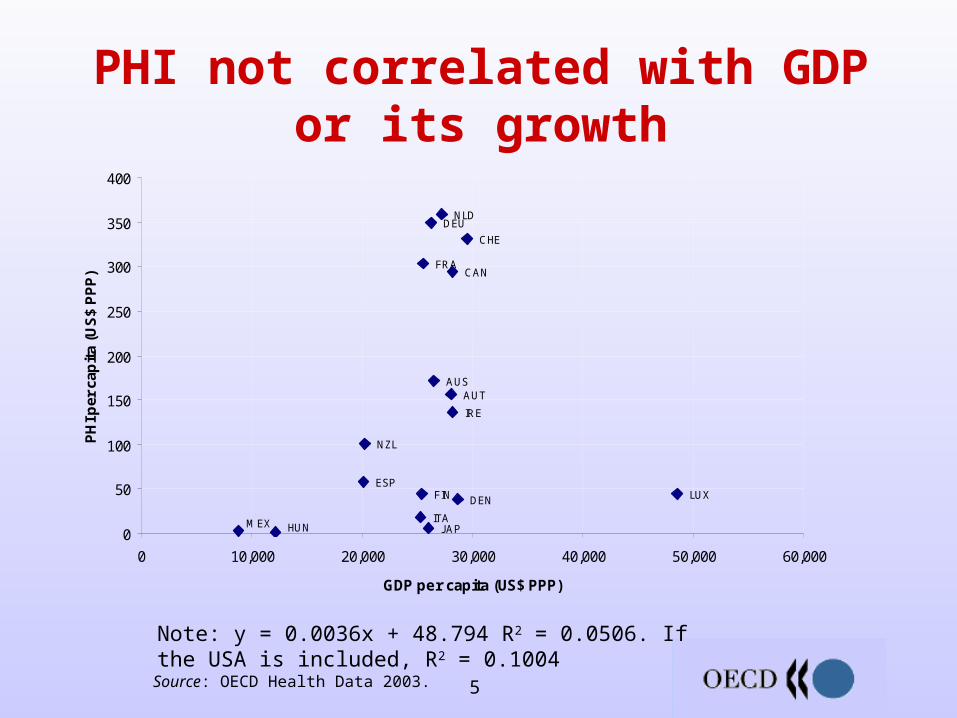
PHI not correlated with GDP or its growth
Note: y = 0.0036x + 48.794 R2 = 0.0506. If the USA is included, R2 = 0.1004 Source: OECD Health Data 2003.
CHE
ESP
NZL
NLD
MEX
LUX
J APITA
IRE
HUN
DEU
FRA
FIN DEN
CAN
AUTAUS
0
50
100
150
200
250
300
350
400
0 10,000 20,000 30,000 40,000 50,000 60,000
GDP per capita (US$ PPP)
PH
I per
cap
ita
(US
$ P
PP
)

6
Access to care and coverage PHI creates inequities in utilisation, can give
providers incentives to favour private insurees Without intervention, access to PHI can be
difficult for low-income/high-risk individuals
Useful practices Specify rules of access to care and providers’ duties
towards public patients; regulate private sector prices. Regulate issuance, premium rating, high-risk coverage.

7
Responsiveness PHI generally enhances choice (providers,
timing of care, benefits, insurer) but choice not always clear
Insurers face more incentives to innovate, adopt new technologies
Useful practices Disseminate clear comparative information on plans and
benefits. Regulate benefits to facilitate consumer choice.

8
Economy PHI added to total health expenditure
regardless of its role Little shifting of cost from the public sector
(public sector often bears cost of high risks)
Useful practices Encourage insurees to use privately financed services. Apply same cost controls to public and private system. Weigh opportunity cost of any subsidies. Avoid full PHI coverage of cost-sharing in
statutory/public systems.

9
Efficiency Little management of care by insurers High administrative costs Competition yet to deliver efficiency gains
Useful practices Encourage insurers’ involvement in preventative care
or care management. Remove disincentives to selective contracting. Design risk equalisation to strike a balance between
fair competition and insurers’ efficiency incentives

10
To conclude
PHI has enhanced responsiveness Less positive impact on equity and
efficiency Performance varies (PHI role; government
interventions) Policy makers face trade-offs Useful practices can help

11
More information Working Papers:
– Benefits and costs for individuals and health systems
– Case studies
PHI in OECD Countries (Nov. 2004)
http://www.oecd.org/[email protected]

12
Additional graphs if questions

13
Why differences in market size?
Historical factors Public policy interventions Role of employers (growing in many
countries)
14
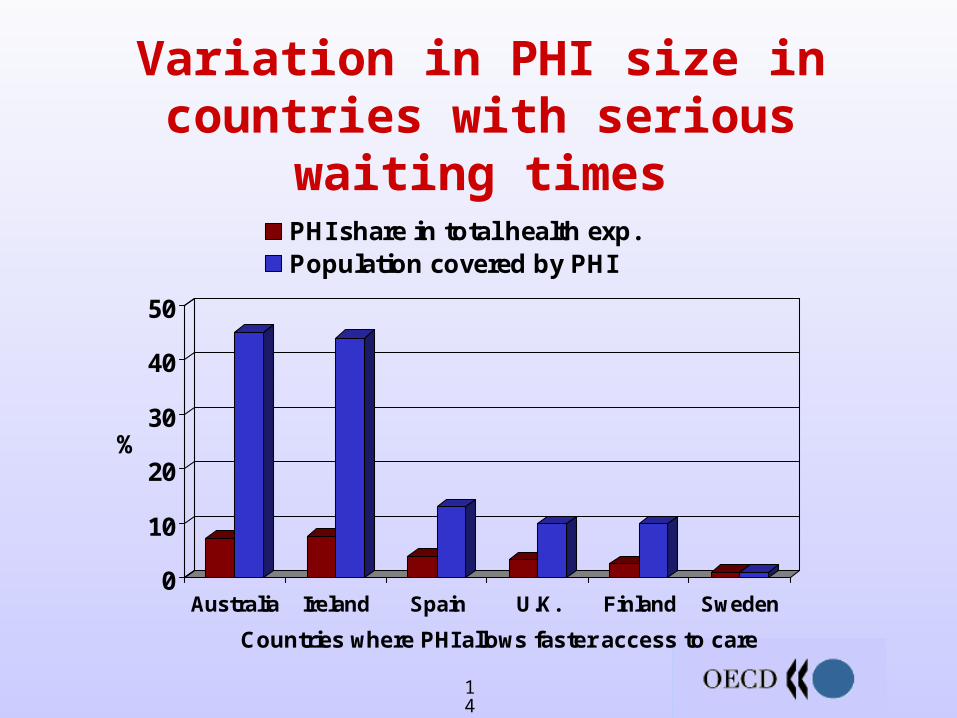
Variation in PHI size in countries with serious waiting times
0
10
20
30
40
50
%
Australia Ireland Spain U.K. Finland Sweden
Countries where PHI allows faster access to care
PHI share in total health exp.Population covered by PHI

15
Financial protection against out-of-pocket payments varies
Breakdown of private spending (%)
63
53 51
42 39
29 28 24 24 23 19 15 14 11 9 5
27 43 42
25
54 70
51 62
74
60 64 73
83
82
91 95
85
75
87
100
100
100
100
10 7
34
7
21
15 16 16 12
8
12
24
12
3
4
0
10
20
30
40
50
60
70
80
90
100
Uni
ted
Sta
tes
Fra
nce
Ger
man
y
Net
herla
nds
Can
ada
New
Zea
land
Irel
and
Aus
tria
Sw
itzer
land
Aus
tral
ia
Uni
ted
Kin
gdom
Luxe
mbo
urg
Spa
in
Fin
land
Den
mar
k
Mex
ico
Italy
Japa
n
Hun
gary
Cze
ch R
epub
lic
Icel
and
Slo
vak
Rep
ublic
Tur
key
PHI Out-of-pocket expenditure All other private funds
Source: OECD Health Data 2003. Data from 2000

16
Health systems mainly publicly financed
858991
84
7678
48
738
388
75
727
8
69
6973
56
717576
63
44
6
77
8
11
111
313
15
35
14119
16
2117
52
231
68
20
241
5
19
1914
33
1611
109
15
0%
10%
20%
30%
40%
50%
60%
70%
80%
90%
100%
Norw
ay
Slo
vak R
epublic
Czech R
epublic
Icela
nd
Hungary
Japan
Mexic
o
Italy
Denm
ark
Luxem
bourg
Fin
land
Spain
New
Zeala
nd
Austr
ia
Austr
alia
Irela
nd
Sw
itzerland
Canada
Germ
any
Fra
nce
Neth
erlands
Unite
d S
tate
s
Public expenditure on health Private insurance All other private funds Out-of-pocket payments
Source: OECD Health Data 2003. Data from 2000

17
Little variation in public health spending as share of GDP
Source: OECD Health Data 2003.
7.9
7.8
7.1
6.9
6.5
6.5
6.5
6.1 6 6 5.9
5.8
5.5
5.3
5.1
5.1 5 4.9
4.7
6.2
5.4
5.9
2.7
0
5
10
15
20
25
30
35
40
%
Public expenditure on health (% GDP) Private expenditure on health (% GDP)
PHI (% of total expenditure on health)

18
PHI and total health expenditure
R2= 0.43 if U.S. excluded
HUN
JAP
MEX
ITA
DEN
LUX
FIN
ESPNZL
AUT
AUS
IRE
CHE
CAN DEU
FRA NLD
y = 3.3656x + 1571.7
R2 = 0.4303
0
500
1,000
1,500
2,000
2,500
3,000
3,500
0 50 100 150 200 250 300 350 400
Per capita PHI (US$ PPP)
Per c
apita
TH
E (U
S$ P
PP)
Source: OECD Health Data 2003.
But countries with either:– High PHI share in THE – High PHI pop. coverage
tend to have high per capita health spending (U.S., CH, Germany, France)