1 public hearing fiscal year 2016 budget, taxes, user charges and capital improvement &...
TRANSCRIPT

1
Public Hearing
Fiscal Year 2016 Budget, Taxes, User Charges and Capital
Improvement & Replacement Program
May 14, 2015

2
The Charter of the Metropolitan St. Louis Sewer District requires the development and maintenance of a
continuing five-year Strategic and Operating Plan.
SECTION 5.110. Strategic plan. -- A continuing five-year strategic and operating plan for the District shall be adopted on an annual basis by the Board. The strategic and operating plan shall state the District’s objectives for the succeeding five years and include objective targets by which to measure the District’s performance in meeting these objectives.
Strategic Business and Operating Plan
2

3
VISION STATEMENT
Quality Service Always
Strategic Business and Operating Plan
3
4
MISSION STATEMENT
To protect the public’s health, safety, and water environment by responsibly providing
wastewater and stormwater management.
Strategic Business and Operating Plan
4

5
VALUES
Integrity – Acting ethically at all times, treating everyone with honesty, fairness, and respect.
Teamwork – Working together to accomplish our mission with open communication, trust, respect, and diversity
Innovation – Embracing continuous improvement and new solutions to achieve excellence.
Strategic Business and Operating Plan
5

6
VALUES(Continued)
Employees – Developing successful, responsible, and safety conscious employees and acknowledging their contributions.
Customers – Building strong relationships by keeping our commitments, providing excellent service and being transparent in everything we do.
Strategic Business and Operating Plan
6

7
A. Deliver consistent, high quality customer service;
B. Comply with all legal and regulatory requirements and schedules;
C. Minimize customer rate increases; and
D. Be accountable to the St. Louis community.
GOALS
7

8
STRATEGIES
1. Educate and partner with stakeholders to build support;
2. Manage the District’s costs and revenues to optimize financial impacts;
3. Integrate and improve the District’s business processes;
8
9
STRATEGIES(Continued)
4. Promote appropriate standards through proactive regulatory and legislative involvement;
5. Address customer and regulatory needs through a comprehensive infrastructure management program;
6. Create a learning and business oriented culture based on competency and accountability.
9

10
FY15 Highlights
• MSD Celebrated 60-years of Service to the St. Louis Region
• MSD Received Multiple Awards from NACWA and the GFOA
• MSD Named 2014 Institution of the Year by the St. Louis Minority Business Council
• MSD Continued Implementation of Project Clear
10
11
Key Initiatives for FY16• Continue Project Clear Related Activities
• Complete the Rate Commission process
• Continued Focus on Diversity
• Complete Upgrades to the Billing and Permitting Software Systems
11

FY16 District Funded Positions
12
969
878
981 981
936956 963
976
FY12 FY13 FY14 FY15 FY16 500
600
700
800
900
1,000
1,100
956 963 976 992 1,000
13
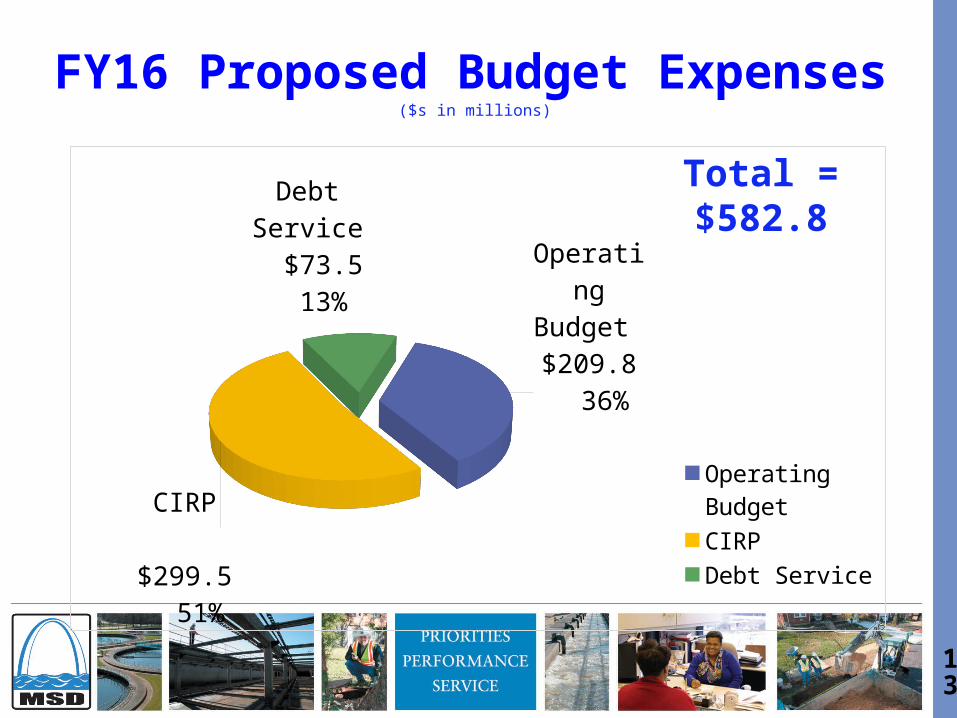
FY16 Proposed Budget Expenses
Operat-ing
Budget $209.8 36%
CIRP
$299.5 51%
Debt Service $73.5 13%
Operating Budget
CIRP
Debt Service
($s in millions)
Total = $582.8
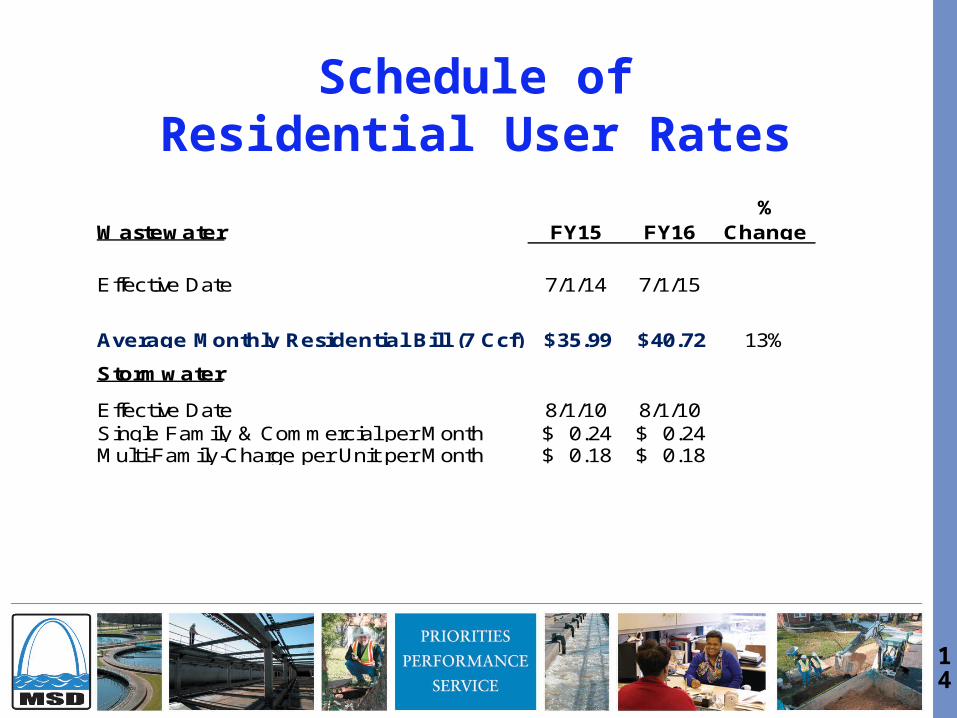
Schedule ofResidential User Rates
14
Wastewater FY15 FY16%
Change
Effective Date 7/1/14 7/1/15
35.99$ 40.72$ 13%
Stormwater
Effective Date 8/1/10 8/1/10Single Family & Commercial per Month 0.24$ 0.24$ Multi-Family-Charge per Unit per Month 0.18$ 0.18$
Average Monthly Residential Bill (7 Ccf)

15
Fiscal Year 2016 General Fund Expenditures
15

FY16 General Fund BudgetBy Department
16
FY15 FY16 $ %
Civil Service Commission 10,000$ 10,000$ -$ 0.0%Rate Commission 512,200 75,000 (437,200) -85.4%Secretary-Treasurer (includes Board of Trustees) 1,656,522 3,384,171 1,727,649 104.3%Executive Director 1,285,215 1,360,646 75,431 5.9%General Counsel 2,558,204 2,419,474 (138,730) -5.4%Human Resources 12,850,462 10,067,675 (2,782,787) -21.7%Finance 22,537,450 20,619,396 (1,918,054) -8.5%Information Systems 13,248,538 12,924,533 (324,005) -2.4%Engineering 24,119,366 25,011,220 891,854 3.7%Operations 104,001,707 106,673,452 2,671,745 2.6%
Total Departments 182,779,663$ 182,545,566$ (234,097)$ -0.1%- 952,728 952,728
Total General Fund Operating Budget 182,779,663$ 183,498,294$ 718,631$ 0.4%
Energy Loan Debt Service 35,922 35,931 9
182,815,585$ 183,534,225$ 718,640$ 0.4%
Non-operating Other (1) 560,000 1,500,000 940,000
Total 183,375,585$ 185,034,225$ 1,658,640$ 0.9%
(1) FY15 - Hyperion Budget System Upgrade; FY16 - Data Center Colocation
CHANGE
Incrementals
Total General Fund Operating Budget with Energy Loan
17
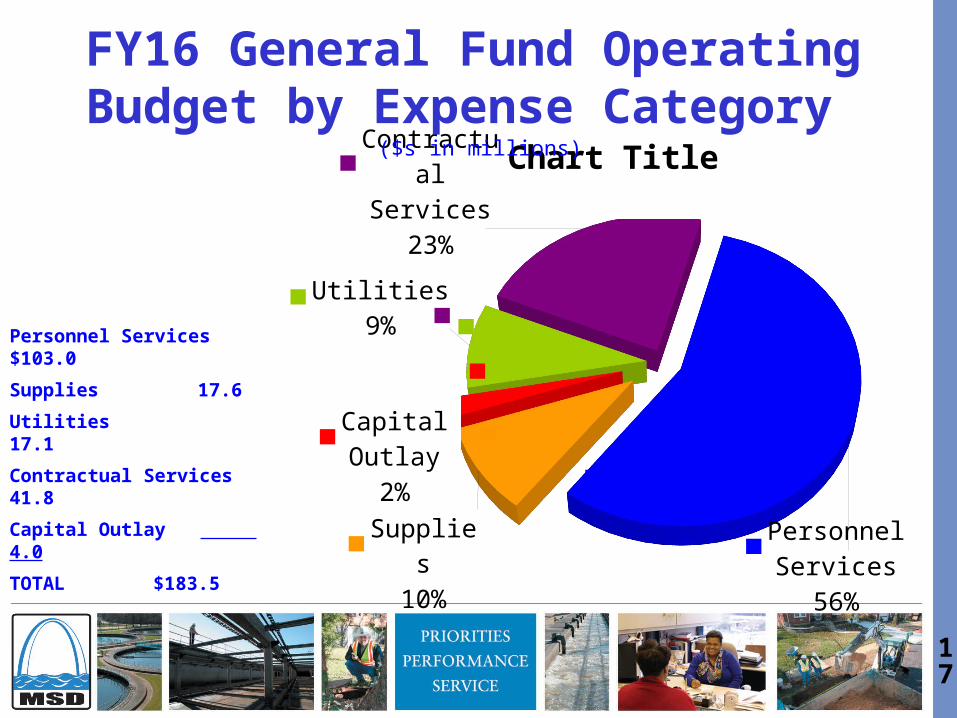
Personnel Services
56%
Supplies10%
Capital Outlay
2%
Utilities9%
Contractual Services
23%
Chart Title
FY16 General Fund Operating Budget by Expense Category
Personnel Services $103.0
Supplies 17.6
Utilities 17.1
Contractual Services 41.8
Capital Outlay 4.0
TOTAL $183.5
17
($s in millions)

18
Comparison:
FY16 Budget to 2011 Rate Report
18
O&M Expense
Fiscal Year RC Budget Projections Change%
Change
2013 $ 166,212,200 $ 156,798,447 $ (9,413,753) -5.7%
2014 174,817,600 169,505,152 (5,312,448) -3.0%
2015 184,977,900 184,960,817 (17,083) 0.0%
2016 190,120,000 192,697,291 2,577,291 1.4%
4 Year Total $ 716,127,700 $ 703,961,707 $ (12,165,993) -1.7%

19
Fiscal Year 2016
Debt Service
19
20
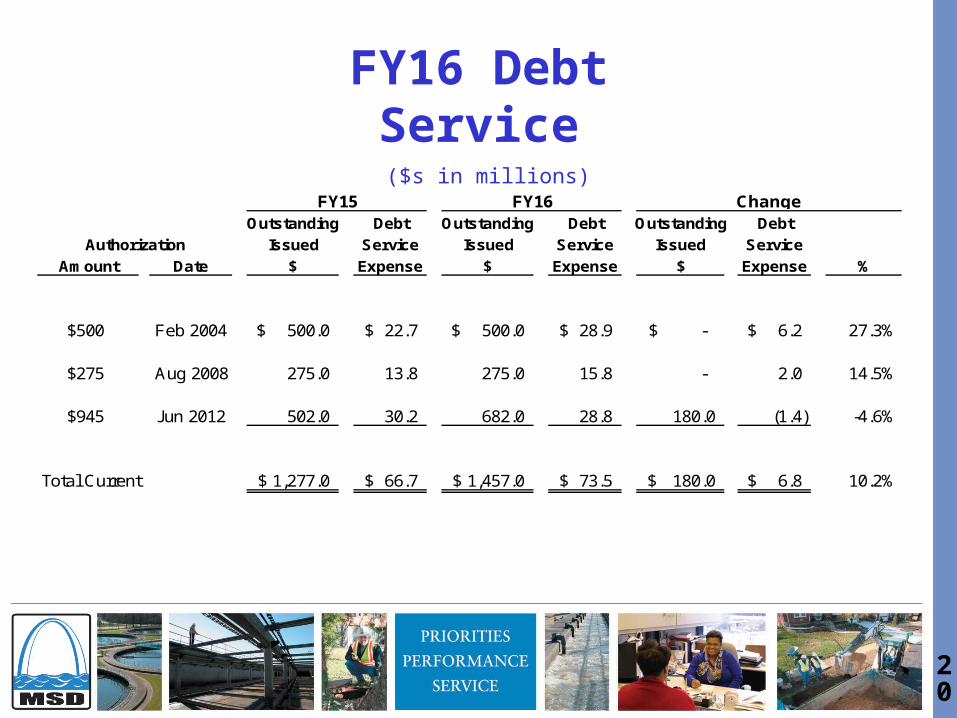
FY16 Debt Service ($s in millions)
Outstanding Debt Outstanding Debt Outstanding Debt
Issued Service Issued Service Issued Service
Amount Date $ Expense $ Expense $ Expense %
$500 Feb 2004 500.0$ 22.7$ 500.0$ 28.9$ -$ 6.2$ 27.3%
$275 Aug 2008 275.0 13.8 275.0 15.8 - 2.0 14.5%
$945 Jun 2012 502.0 30.2 682.0 28.8 180.0 (1.4) -4.6%
Total Current 1,277.0$ 66.7$ 1,457.0$ 73.5$ 180.0$ 6.8$ 10.2%
FY15 FY16 Change
Authorization
20
21
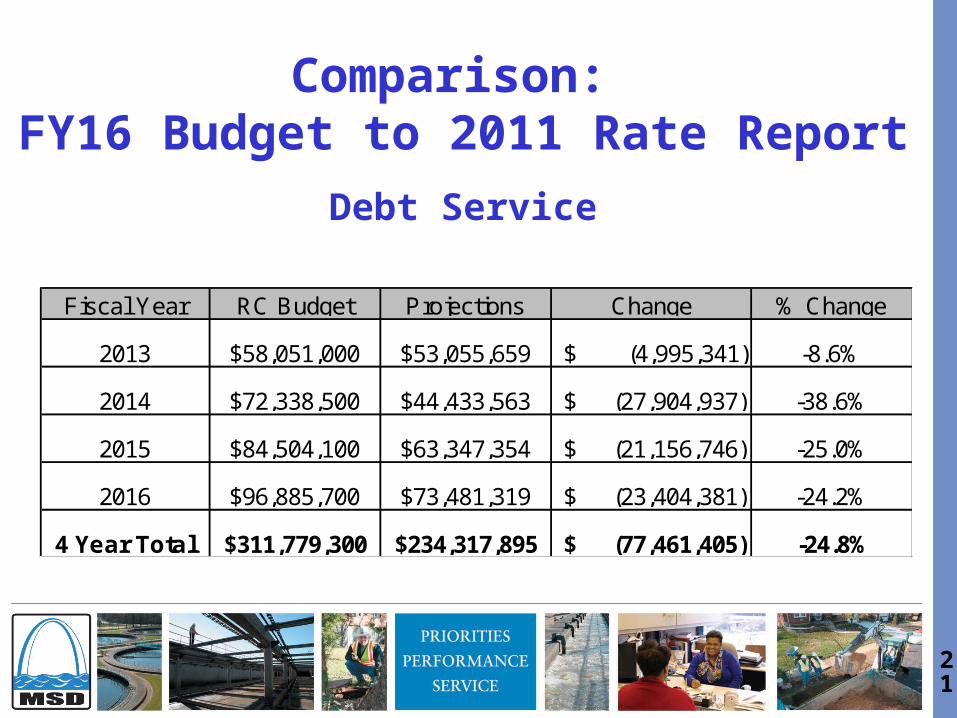
Comparison: FY16 Budget to 2011 Rate Report
21
Debt Service
Fiscal Year RC Budget Projections Change % Change
2013 $58,051,000 $53,055,659 $ (4,995,341) -8.6%
2014 $72,338,500 $44,433,563 $ (27,904,937) -38.6%
2015 $84,504,100 $63,347,354 $ (21,156,746) -25.0%
2016 $96,885,700 $73,481,319 $ (23,404,381) -24.2%
4 Year Total $311,779,300 $234,317,895 $ (77,461,405) -24.8%

22
Fiscal Year 2016
Capital Improvement & Replacement Program
22

23
23

24
FY 2016 Final CIRP Program Summary
24
Type of Project Number Budget
Wastewater Construction 99 195,334,000
Wastewater Engineering 82 69,341,000
Stormwater Construction 26 5,580,500
Stormwater Engineering 6 1,450,000
New Project Appropriations Subtotal: 213 271,705,500
Continued Wastewater 10 24,650,000
Continued Stormwater 5 1,668,000
Continued Project Appropriations Subtotal: 15 26,338,000
PROJECT APPROPRIATION TOTALS: 228 298,043,500

25
FY 2016 CIRPFinal vs. Draft Summary
• 213 New vs. 217 New in draft
• $271,705,500 vs. $270,738,000 in draft
New Projects
Continued Projects
• 15 Continued vs. 16 Continued in draft
• $26,338,000 vs. $28,150,000 in draft
25

26
51%9%
FY 2016 CIRPNew Wastewater Projects
15%
• DC-02 & DC-03 Sanitary Relief (Brentwood Blvd to Conway Rd)
Phase I. Consultant construction phase services for Phase I of this
project, construction of 4,200 feet of sewer.
• DC-02 & DC-03 Sanitary Relief (Brentwood Blvd to Conway Rd)
Phase III. Design services for Phase III of the sanitary relief project,
construction of 12,700 feet of sewer.
• Deer Creek Sanitary Tunnel (Clayton Rd to RDP). Additional design
for the Linden sewer connection to the tunnel, including sewer
extension, diversion structure, and drop structure.
26
27
51%9%
FY 2016 CIRPNew Wastewater Projects (cont.)
15%
• Missouri River WWTF Secondary Treatment Expansion (Mitigation
Credit). Mitigation required by Maryland Heights to compensate for
plant expansion into floodplain, to be accomplished via cooperative
agreement with the Howard Bend Levee District
• Missouri River WWTF Secondary Treatment Electrical / Mechanical
Modifications. Construction of various electrical and mechanical
modifications for code compliance, safety, and operational
efficiency.
27
28
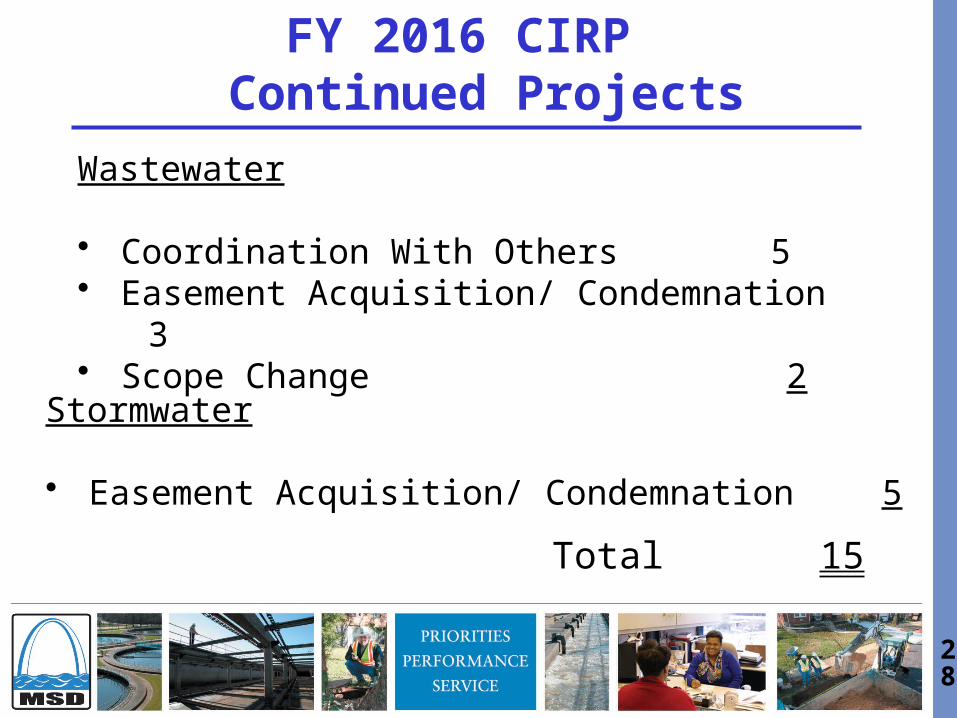
FY 2016 CIRP Continued Projects
Wastewater
• Coordination With Others 5• Easement Acquisition/ Condemnation 3• Scope Change 2
Stormwater
• Easement Acquisition/ Condemnation 5
Total 15
28

29
Type of Project Number Budget
Wastewater 25 $111,145,000
Stormwater 17 2,816,000
Total: 42 $113,961,000
FY 2016 CIRP Contingency Projects
29

30
51%9%
FY 2016 CIRP New Wastewater Contingency Projects
15%
• Bridgevale I/I Reduction (Bridgevale Ave and Lakeview Ave).
Removal of private I/I sources from the sanitary sewer.
• Chapel Hill I/I Reduction (Mattis Rd and Venarde Dr).
Removal of private I/I sources from the sanitary sewer.
• FF-16 Schuetz – Meadowside to Page Sanitary Relief.
Construct 9,900 feet of 27-inch to 36-inch sanitary relief
sewers.
• Private Inflow and Infiltration Reduction Program. Continue
program to remove private I/I sources from the sanitary sewer.
This is a supplemental appropriation.
30

31
51%9%
FY 2016 CIRP New Wastewater Contingency Projects (continued)
15%
• Sappington Creek I/I Reduction (Gravois Rd and Sappington
Rd). Removal of private I/I sources from the sanitary sewer.
• Sterling Place Separate Sewer I/I Removal. Removal of private
I/I sources from the sanitary sewer.
• Trampe (Partial) I/I Reduction (Castilon Ave and Trampe Ave).
Removal of private I/I sources from the sanitary sewer.
31

32
32
33
STORM MAP
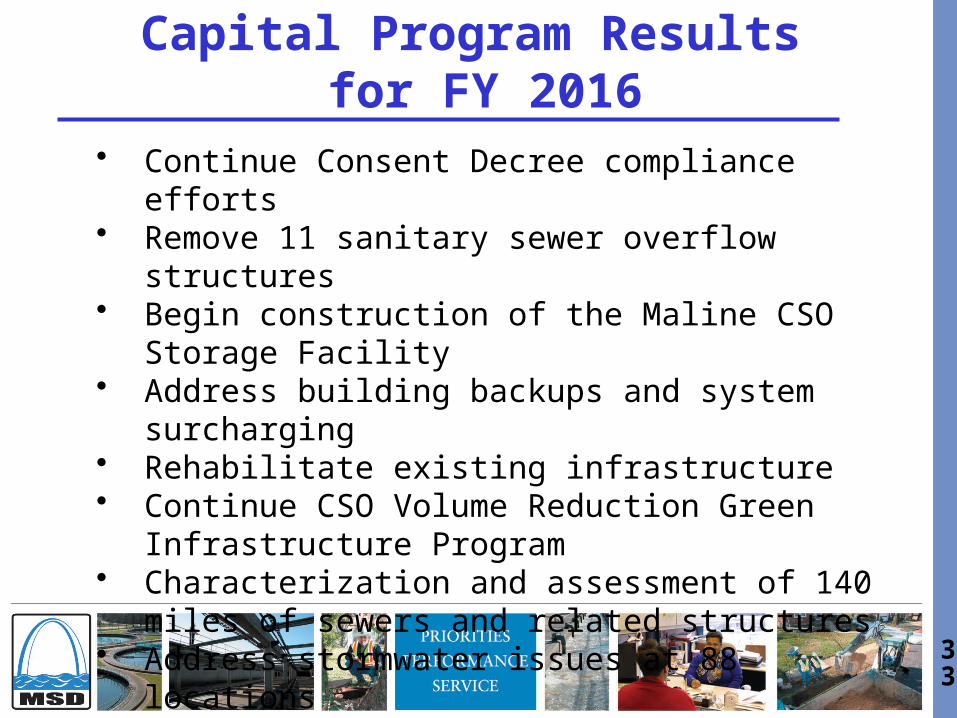
• Continue Consent Decree compliance efforts• Remove 11 sanitary sewer overflow structures• Begin construction of the Maline CSO Storage Facility• Address building backups and system surcharging• Rehabilitate existing infrastructure• Continue CSO Volume Reduction Green Infrastructure
Program• Characterization and assessment of 140 miles of
sewers and related structures• Address stormwater issues at 88 locations
Capital Program Results for FY 2016
33
34
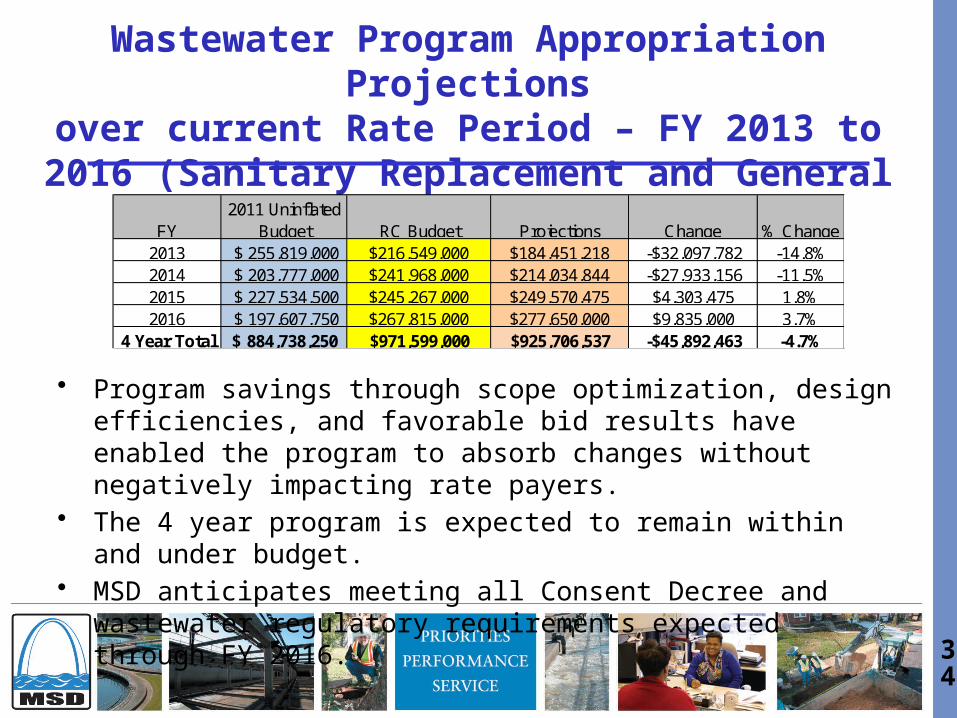
Wastewater Program Appropriation Projectionsover current Rate Period – FY 2013 to 2016 (Sanitary Replacement and General Funds)
• Program savings through scope optimization, design efficiencies, and favorable bid results have enabled the program to absorb changes without negatively impacting rate payers.
• The 4 year program is expected to remain within and under budget.• MSD anticipates meeting all Consent Decree and wastewater
regulatory requirements expected through FY 2016.
34
FY2011 Uninflated
Budget RC Budget Projections Change % Change2013 $ 255,819,000 $216,549,000 $184,451,218 -$32,097,782 -14.8%2014 $ 203,777,000 $241,968,000 $214,034,844 -$27,933,156 -11.5%2015 $ 227,534,500 $245,267,000 $249,570,475 $4,303,475 1.8%2016 $ 197,607,750 $267,815,000 $277,650,000 $9,835,000 3.7%
4 Year Total 884,738,250$ $971,599,000 $925,706,537 -$45,892,463 -4.7%

35
Fiscal Year 2016 Sources and Uses of Funding
35

36
FY16 Sources and Uses of Funding($s in millions)
Sources of Funding Uses of Funding
OPER DEBT CIRP TOTAL
Wastewater User Charges $216.4 $73.5 $21.3 $311.1
36
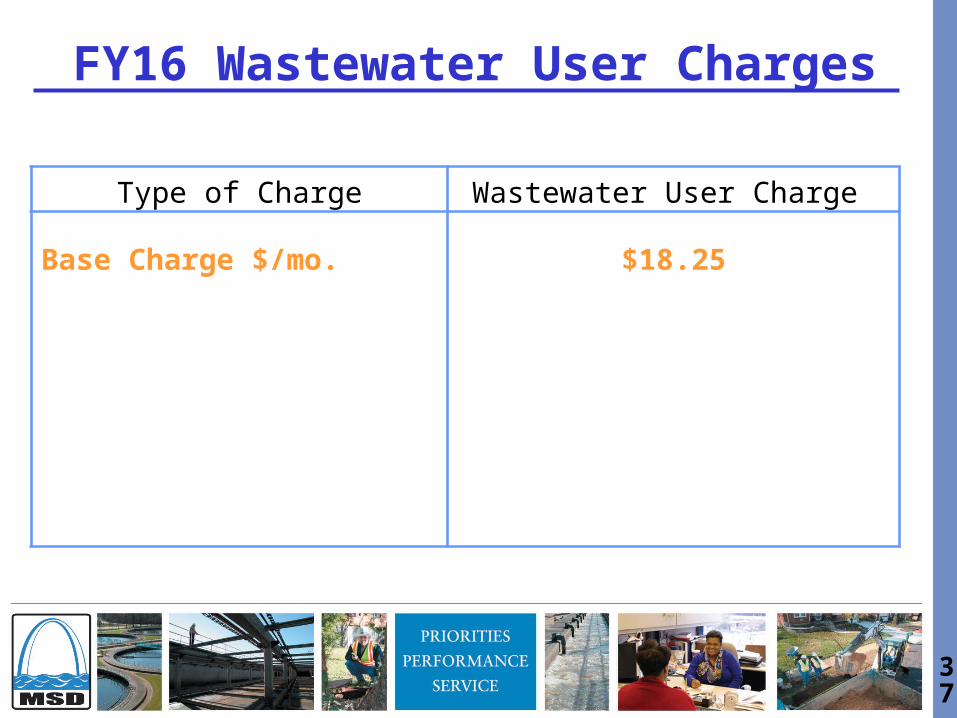
37
FY16 Wastewater User Charges
Type of Charge Wastewater User Charge
Base Charge $/mo. $18.25
37

38
FY16 Wastewater User Charges
Type of Charge Wastewater User Charge
Base Charge $/mo. $18.25
Unmetered (volume)
Per Room $/mo. 2.09
Per Water Closet $/mo. 7.83
Per Bath/Shower $/mo. 6.53
38

39
FY16 Wastewater User Charges
Type of Charge Wastewater User Charge
Base Charge $/mo. $18.25
Unmetered (volume)
Per Room $/mo. 2.09
Per Water Closet $/mo. 7.83
Per Bath/Shower $/mo. 6.53
Metered Volume $/ccf 3.21
39
40
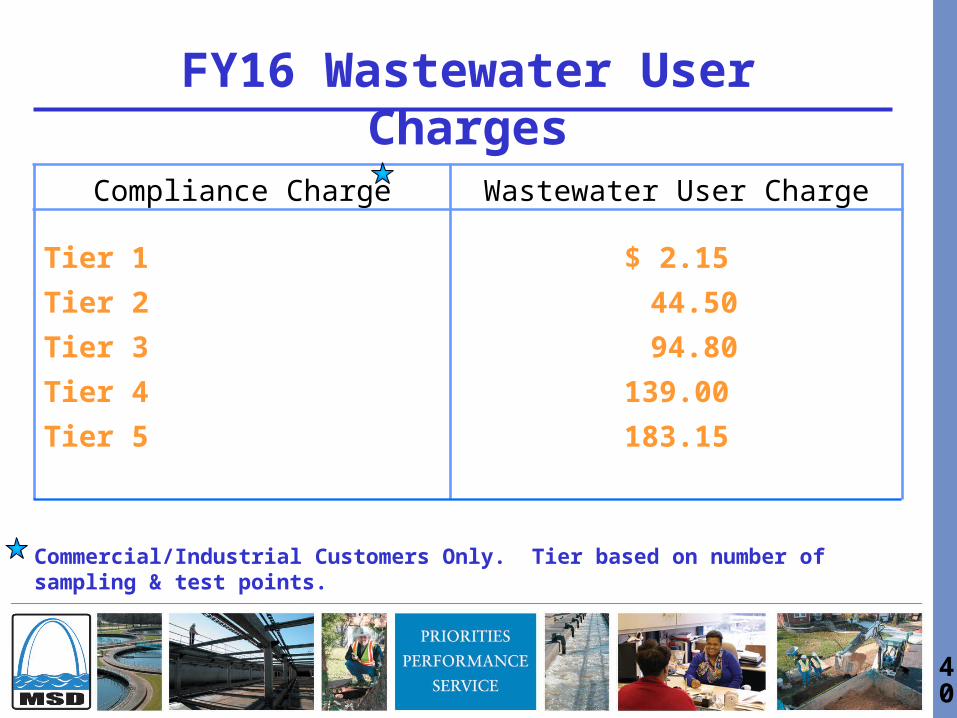
FY16 Wastewater User Charges
Commercial/Industrial Customers Only. Tier based on number of sampling & test points.
40
Compliance Charge Wastewater User Charge
Tier 1 $ 2.15
Tier 2 44.50
Tier 3 94.80
Tier 4 139.00
Tier 5 183.15

41
FY16 Wastewater User Charges
Extra Strength Surcharge Wastewater User Charge
Suspended Solids $/ton $251.88
greater than 300 mg/l
Commercial/Industrial Customers Only.
41

42
FY16 Wastewater User Charges
Extra Strength Surcharge Wastewater User Charge
Suspended Solids $/ton $251.88 greater than 300 mg/l
BOD’s $/ton $632.38 greater than 300 mg/l
Commercial/Industrial Customers Only.
42

43
FY16 Wastewater User Charges
Extra Strength Surcharge Wastewater User Charge
Suspended Solids $/ton $251.88 greater than 300 mg/l
BOD’s $/ton $632.38
greater than 300 mg/l
COD’s $/ton $316.19 greater than 600 mg/l
Commercial/Industrial Customers Only.
43

44
FY16 Sources and Uses of Funding($s in millions)
Sources of Funding Uses of Funding
OPER DEBT CIRP TOTAL
Wastewater User Charges $216.4 $73.5 $21.3 $311.1
Stormwater User Charges 0.0 0.0 1.4 1.4
44

45
FY16 Stormwater User Charges
Type of Charge Stormwater User Charge
Single Family & Commercial
24 ¢ per account
Multi-unit Residential 18 ¢ per unit per account
45
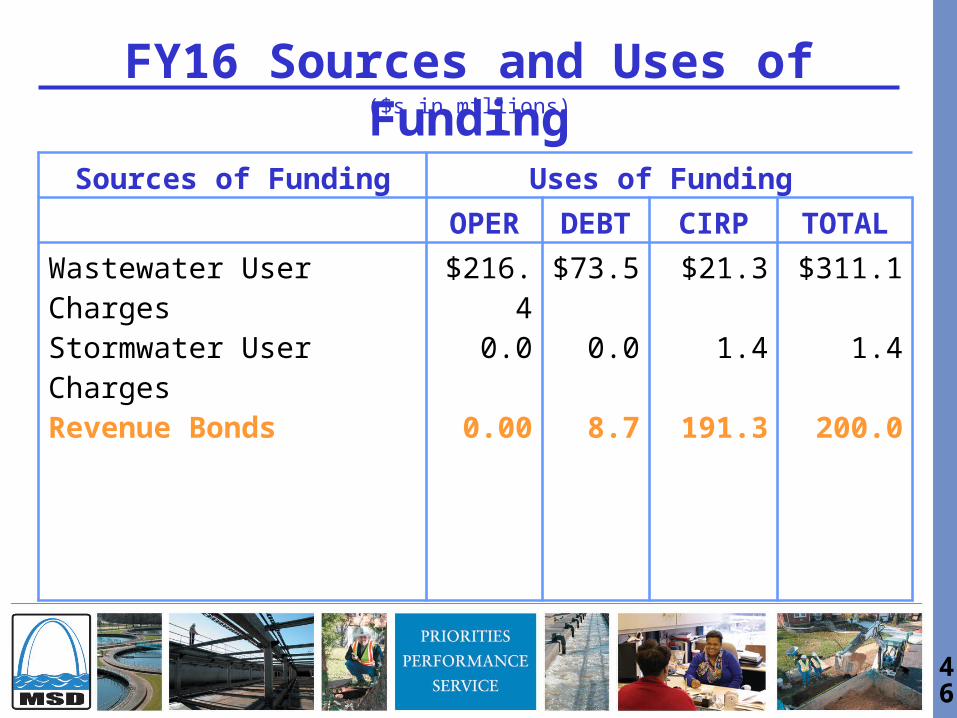
46
FY16 Sources and Uses of Funding($s in millions)
Sources of Funding Uses of Funding
OPER DEBT CIRP TOTAL
Wastewater User Charges $216.4 $73.5 $21.3 $311.1
Stormwater User Charges 0.0 0.0 1.4 1.4
Revenue Bonds 0.00 8.7 191.3 200.0
46
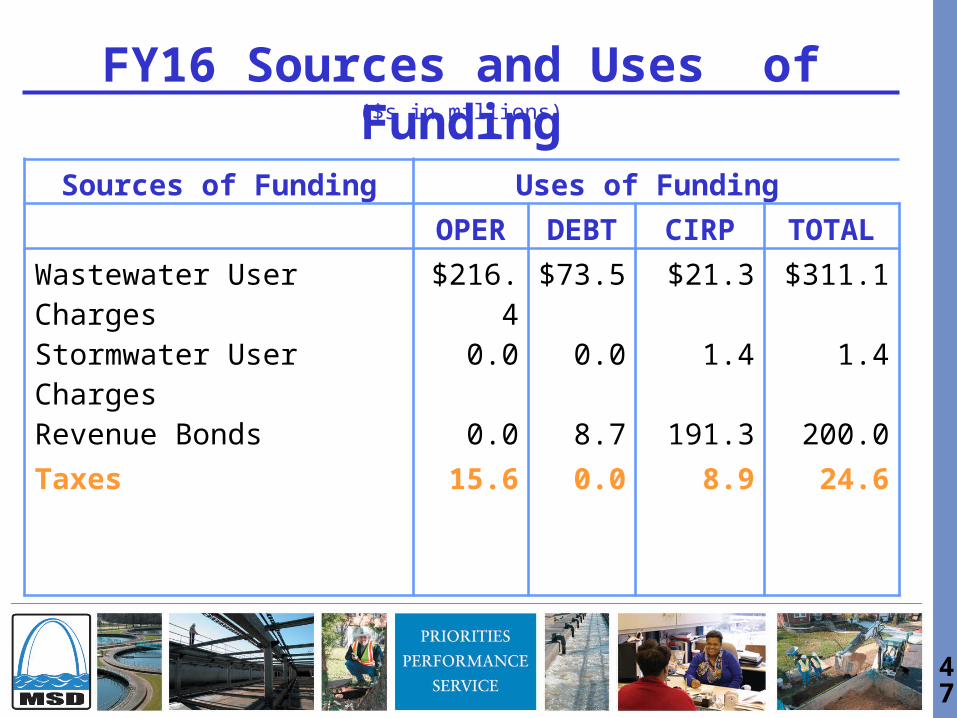
47
FY16 Sources and Uses of Funding
Sources of Funding Uses of Funding
OPER DEBT CIRP TOTAL
Wastewater User Charges $216.4 $73.5 $21.3 $311.1
Stormwater User Charges 0.0 0.0 1.4 1.4
Revenue Bonds 0.0 8.7 191.3 200.0
Taxes 15.6 0.0 8.9 24.6
47
($s in millions)

48
FY16 Sources and Uses of Funding($s in millions)
Sources of Funding Uses of Funding
OPER DEBT CIRP TOTAL
Wastewater User Charges $216.4 $73.5 $21.3 $311.1
Stormwater User Charges 0.0 0.0 1.4 1.4
Revenue Bonds 0.0 8.7 191.3 200.0
Taxes 15.6 0.0 8.9 24.6
Investment Income & Other 3.2 0.3 18.8 22.3*
48
* Includes $17.1 million interfund revenue for Stormwater services.
49
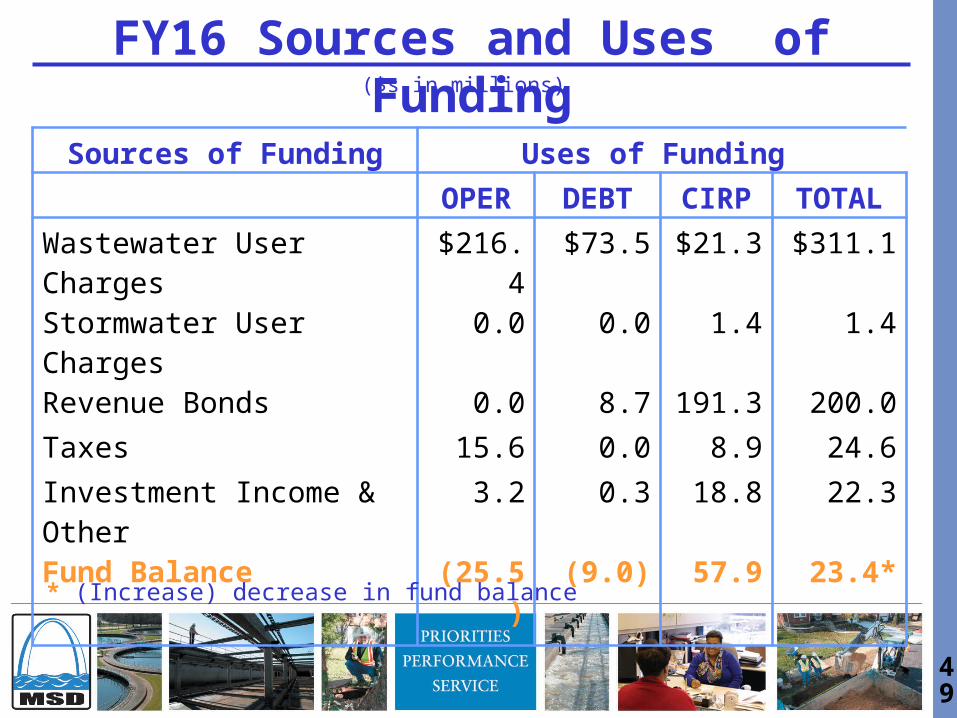
FY16 Sources and Uses of Funding($s in millions)
Sources of Funding Uses of Funding
OPER DEBT CIRP TOTAL
Wastewater User Charges $216.4 $73.5 $21.3 $311.1
Stormwater User Charges 0.0 0.0 1.4 1.4
Revenue Bonds 0.0 8.7 191.3 200.0
Taxes 15.6 0.0 8.9 24.6
Investment Income & Other 3.2 0.3 18.8 22.3
Fund Balance (25.5) (9.0) 57.9 23.4*
49
* (Increase) decrease in fund balance
50
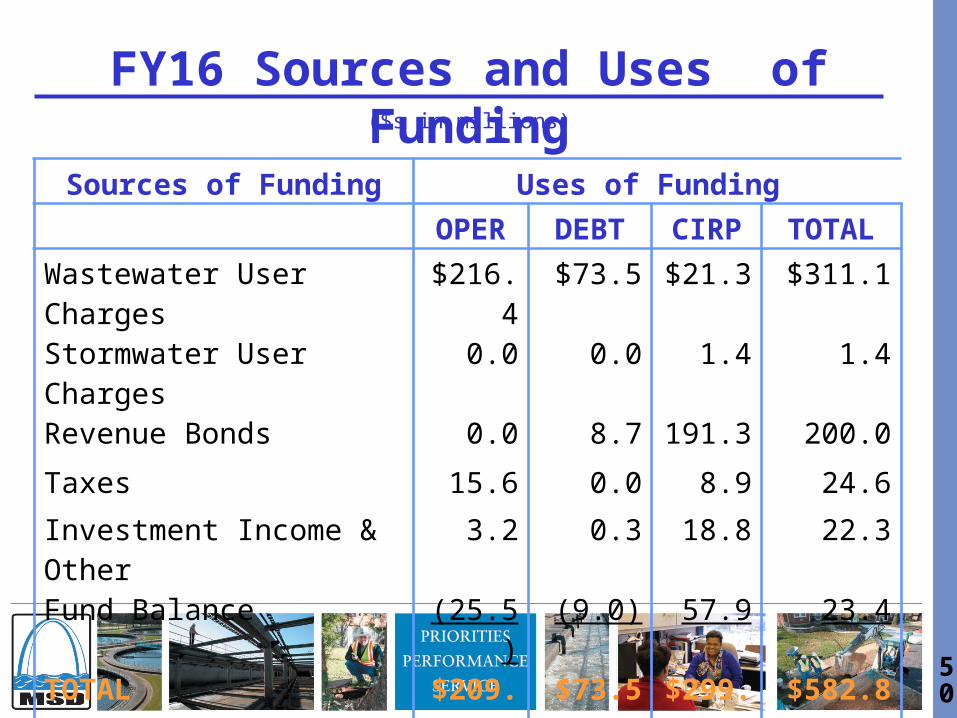
FY16 Sources and Uses of Funding($s in millions)
Sources of Funding Uses of Funding
OPER DEBT CIRP TOTAL
Wastewater User Charges $216.4 $73.5 $21.3 $311.1
Stormwater User Charges 0.0 0.0 1.4 1.4
Revenue Bonds 0.0 8.7 191.3 200.0
Taxes 15.6 0.0 8.9 24.6
Investment Income & Other 3.2 0.3 18.8 22.3
Fund Balance (25.5) (9.0) 57.9 23.4
TOTAL $209.8 $73.5 $299.5 $582.8
50

51
Fiscal Year 2016 Tax Levies
51

52
District-Wide Tax Levies
2015TAX RATE
ADMINISTRATIVE TAX:CityCounty
Total Administrative Tax
STORMWATER TAX: City County (Original MSD Boundaries)
Total Stormwater Tax
TOTAL DISTRICT-WIDE TAX
6.7¢ per $1006.7¢ per $100
$ 2,813,307 7,666,902$ 10,480,208
$ 15,633,406
1.9¢ per $1001.9¢ per $100
52
2015TAX LEVY
$ 808,615 4,344,583$ 5,153,198
53
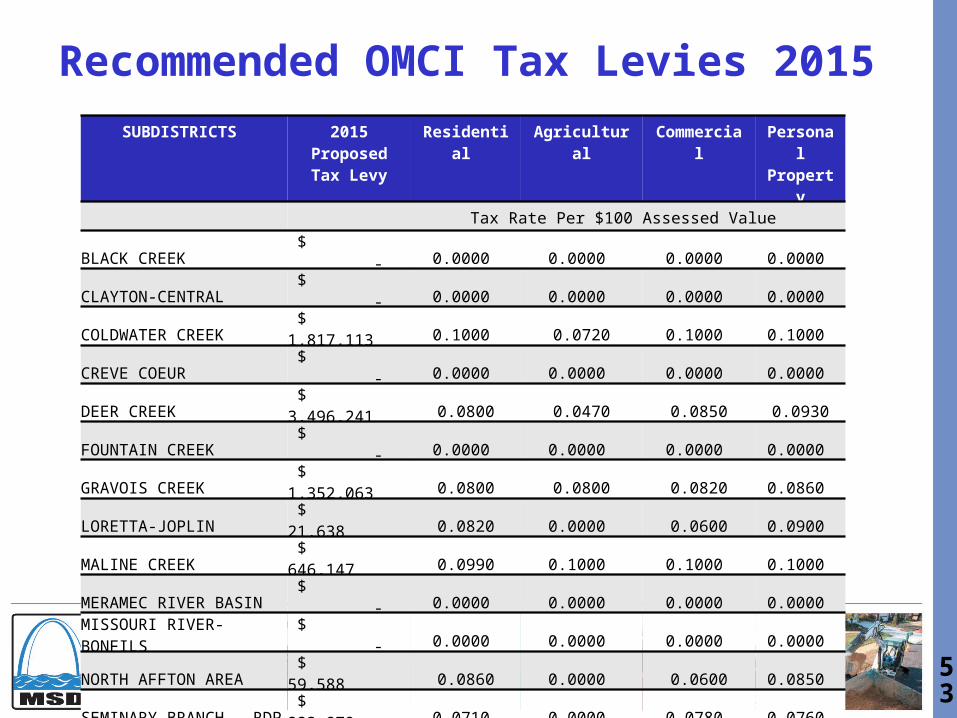
Recommended OMCI Tax Levies 2015
53
SUBDISTRICTS 2015 Proposed Tax Levy
Residential Agricultural Commercial Personal Property
Tax Rate Per $100 Assessed Value
BLACK CREEK $ - 0.0000 0.0000 0.0000 0.0000 CLAYTON-CENTRAL $ - 0.0000 0.0000 0.0000 0.0000 COLDWATER CREEK $ 1,817,113 0.1000 0.0720 0.1000 0.1000 CREVE COEUR $ - 0.0000 0.0000 0.0000 0.0000 DEER CREEK $ 3,496,241 0.0800 0.0470 0.0850 0.0930FOUNTAIN CREEK $ - 0.0000 0.0000 0.0000 0.0000 GRAVOIS CREEK $ 1,352,063 0.0800 0.0800 0.0820 0.0860 LORETTA-JOPLIN $ 21,638 0.0820 0.0000 0.0600 0.0900 MALINE CREEK $ 646,147 0.0990 0.1000 0.1000 0.1000 MERAMEC RIVER BASIN $ - 0.0000 0.0000 0.0000 0.0000 MISSOURI RIVER-BONFILS $ - 0.0000 0.0000 0.0000 0.0000 NORTH AFFTON AREA $ 59,588 0.0860 0.0000 0.0600 0.0850 SEMINARY BRANCH - RDP $ 223,879 0.0710 0.0000 0.0780 0.0760 SHREWSBURY - RDP $ 19,929 0.0660 0.0000 0.0660 0.0820 SUGAR CREEK $ 265,597 0.0530 0.0000 0.1000 0.0690 UNIV. CITY BRANCH - RDP $ 846,737 0.0900 0.0000 0.0990 0.0940 WATKINS CREEK $ 149,541 0.1000 0.0930 0.1000 0.0990 WELLSTON $ 31,171 0.0950 0.0000 0.1000 0.1000
TOTAL $ 8,929,644

5454