1 public input: 9/23/04nebraska consolidated plan support nebraska this research is in support of...
TRANSCRIPT

Public Input: 9/23/04Nebraska Consolidated Plan Support 1
NebraskaThis Research is in Support of
Nebraska Consolidated Plan For Housing and Community
Development: Five-Year Strategy
Nebraska Consolidated Plan Support Public Input: 9/23/042
Nebraska Consolidated Plan
Background: In 1994 HUD merged the application processes of:
HOME Program (w/ ADDI)CDBG ProgramESG ProgramHOPWA

Nebraska Consolidated Plan Support Public Input: 9/23/043
Nebraska Consolidated Plan
DED is the lead agency responsible for the Cons Plan
Consolidated Plan is not really statewide, it excludes Cities of Lincoln and Omaha

Nebraska Consolidated Plan Support Public Input: 9/23/044
Nebraska DEDOur support process involved:
Research and analysis Review Dev. District reports Explore needs issues Recommend objectives &
strategies addressing needs

Nebraska Consolidated Plan Support Public Input: 9/23/045
Nebraska Consolidated Plan
Data statewide or by region
Housing Trust Fund Regions

Nebraska Consolidated Plan Support Public Input: 9/23/046
Nebraska Demographics
Population growth modestPOPULATION IN NEBRASKA
1890 THROUGH 2000
0
200,000
400,000
600,000
800,000
1,000,000
1,200,000
1,400,000
1,600,000
1,800,000
1890 1900 1910 1920 1930 1940 1950 1960 1970 1980 1990 2000Census Year
De
cen
nia
l Po
pu
lati
on
Nebraska Consolidated Plan Support Public Input: 9/23/047
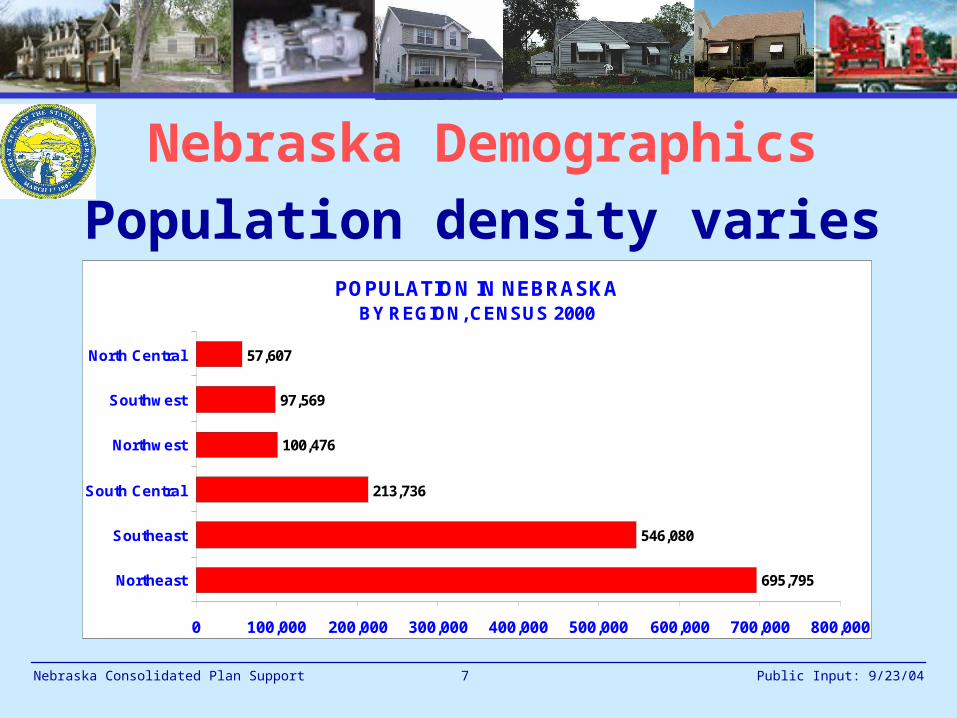
Nebraska Demographics
Population density variesPOPULATION IN NEBRASKA
BY REGION, CENSUS 2000
695,795
546,080
213,736
100,476
97,569
57,607
0 100,000 200,000 300,000 400,000 500,000 600,000 700,000 800,000
Northeast
Southeast
South Central
Northwest
Southwest
North Central
Nebraska Consolidated Plan Support Public Input: 9/23/048
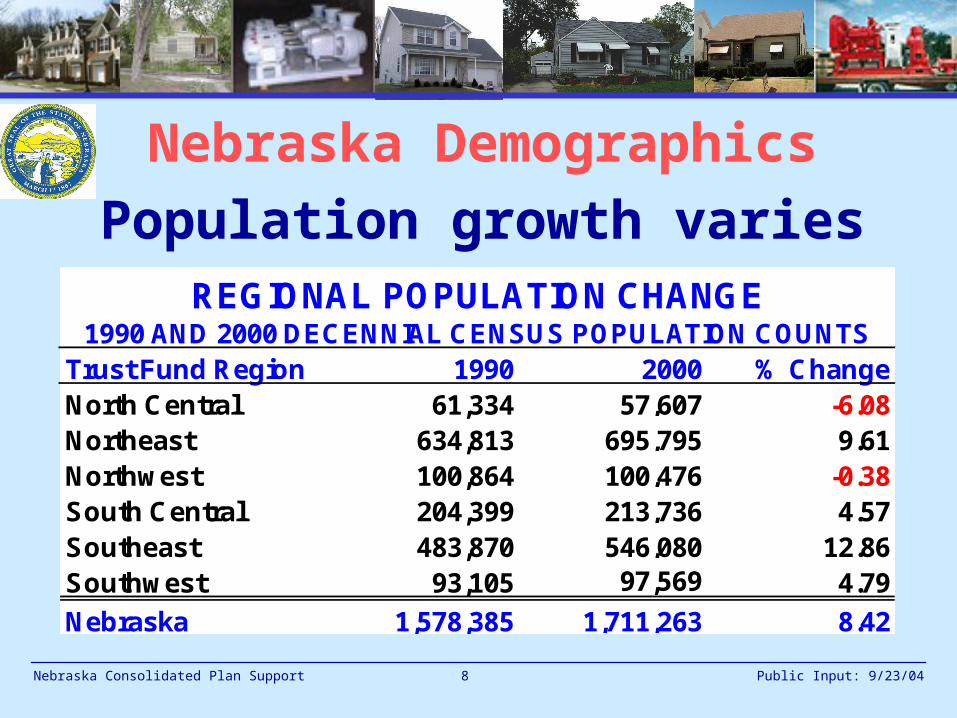
Nebraska Demographics
Population growth varies
Trust Fund Region 1990 2000 % ChangeNorth Central 61,334 57,607 -6.08Northeast 634,813 695,795 9.61Northwest 100,864 100,476 -0.38South Central 204,399 213,736 4.57Southeast 483,870 546,080 12.86Southwest 93,105 97,569 4.79
Nebraska 1,578,385 1,711,263 8.42
1990 AND 2000 DECENNIAL CENSUS POPULATION COUNTSREGIONAL POPULATION CHANGE

Nebraska Consolidated Plan Support Public Input: 9/23/049
Nebraska Demographics
Age Cohorts: 50.7% FemaleNEBRASKA POPULATIONBY AGE GROUP: CENSUS 2000
504,336
120,331
223,273
489,588
141,540
232,195
0
100,000
200,000
300,000
400,000
500,000
600,000
Under 20 20-24 25-34 35-54 55-64 65+Age Group
Nu
mb
er
of
Pe
rso
ns

Nebraska Consolidated Plan Support Public Input: 9/23/0410
Nebraska Demographics
A Large Elderly PopulationPERCENT ELDERLY HOUSEHOLDS IN NEBRASKA
BY TRUST FUND REGION, CENSUS 2000
NE = 13.6%U.S. = 12.4%
10.0% 12.0% 14.0% 16.0% 18.0% 20.0% 22.0%
North Central
Northwest
Southwest
South Central
Northeast
Southeast

Nebraska Consolidated Plan Support Public Input: 9/23/0411
Nebraska Demographics
Minorities growing quickly
1990 2000 % Change
White 1,480,558 1,533,261 3.6%Black 57,404 68,541 19.4%All Other 1 race 40,423 85,508 111.5%2 or more 23,953 .T otal 1,578,385 1,711,263 8.4%
Hispanic 36,969 94,425 155.4%
Race
Ethnicity
NEBRASKA POPULATION BY RACE
Nebraska Consolidated Plan Support Public Input: 9/23/0412
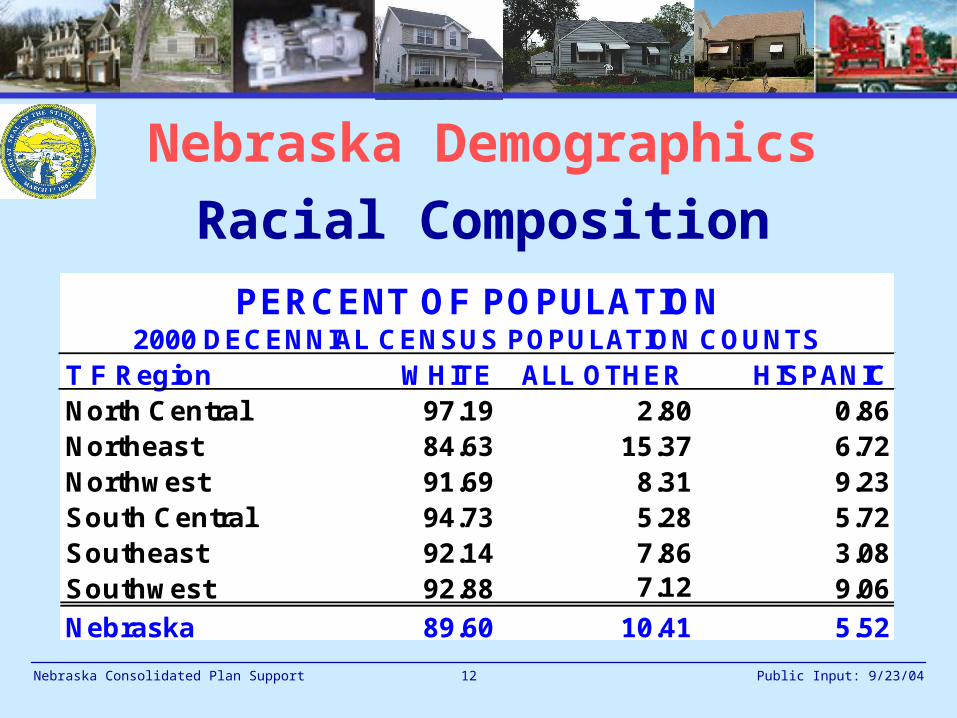
Nebraska Demographics
Racial Composition
T F Region WHITE ALL OTHER HISPANICNorth Central 97.19 2.80 0.86Northeast 84.63 15.37 6.72Northwest 91.69 8.31 9.23South Central 94.73 5.28 5.72Southeast 92.14 7.86 3.08Southwest 92.88 7.12 9.06
Nebraska 89.60 10.41 5.52
2000 DECENNIAL CENSUS POPULATION COUNTSPERCENT OF POPULATION

Nebraska Consolidated Plan Support Public Input: 9/23/0413
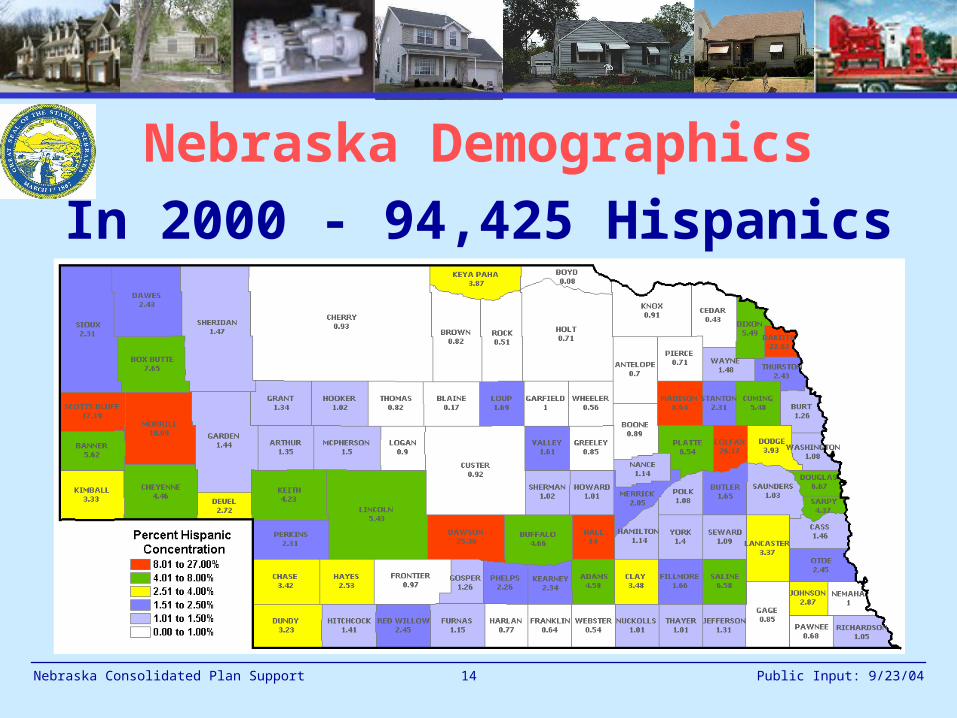
Nebraska Demographics
Up to 55% Minority Population
2000 Census
Nebraska Consolidated Plan Support Public Input: 9/23/0414
Nebraska Demographics
In 2000 - 94,425 Hispanics
Nebraska Consolidated Plan Support Public Input: 9/23/0415
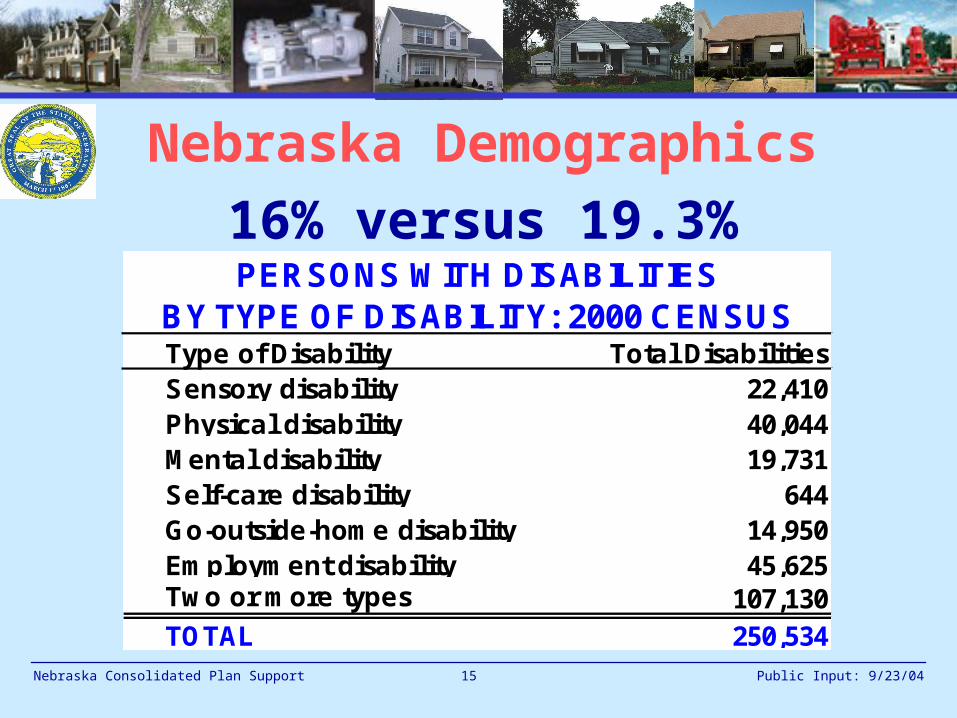
Nebraska Demographics
16% versus 19.3% Nationally
Type of Disability Total DisabilitiesSensory disability 22,410Physical disability 40,044Mental disability 19,731Self-care disability 644Go-outside-home disability 14,950Employment disability 45,625Two or more types 107,130TOTAL 250,534
BY TYPE OF DISABILITY: 2000 CENSUSPERSONS WITH DISABILITIES
Nebraska Consolidated Plan Support Public Input: 9/23/0416
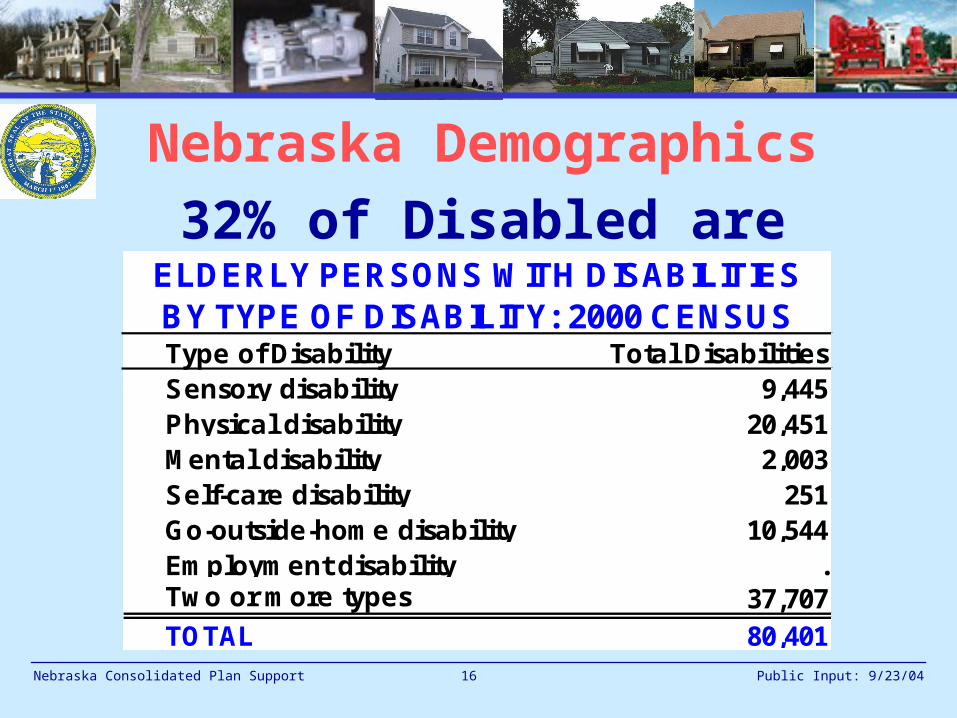
Nebraska Demographics
32% of Disabled are Elderly
Type of Disability Total DisabilitiesSensory disability 9,445Physical disability 20,451Mental disability 2,003Self-care disability 251Go-outside-home disability 10,544Employment disability .Two or more types 37,707TOTAL 80,401
BY TYPE OF DISABILITY: 2000 CENSUSELDERLY PERSONS WITH DISABILITIES

Nebraska Consolidated Plan Support Public Input: 9/23/0417
Nebraska Demographics
Household Formation
T F Region 1990 2000 % ChangeNorth Central 23,811 23,319 -2.07Northeast 242,481 269,645 11.20Northwest 39,275 40,692 3.61South Central 78,657 83,198 5.77Southeast 181,408 210,594 16.09Southwest 36,731 38,736 5.46
Nebraska 602,363 666,184 10.60
1990 AND 2000 DECENNIAL CENSUS HOUSEHOLD COUNTSREGIONAL HOUSEHOLD CHANGE

Nebraska Consolidated Plan Support Public Input: 9/23/0418
Nebraska Demographics
Persons Per Household
by Trust Fund Region 1990-2000
Trust Fund Region 1990 2000North Central 2.53 2.42Northeast 2.55 2.51Northwest 2.51 2.41South Central 2.50 2.48Southeast 2.56 2.50Southwest 2.49 2.47Nebraska 2.54 2.49
PERSONS PER HOUSEHOLD

Nebraska Consolidated Plan Support Public Input: 9/23/0419
Nebraska Demographics
Household FormationPERSONS PER HOUSEHOLD BY TENURE
BY REGION, CENSUS 2000
2.0
2.1
2.2
2.3
2.4
2.5
2.6
2.7
2.8
North Central Northeast Northwest South Central Southeast Southwest
Pe
rso
ns
Pe
r H
ou
seh
old
Renter Owner
Nebraska Consolidated Plan Support Public Input: 9/23/0420
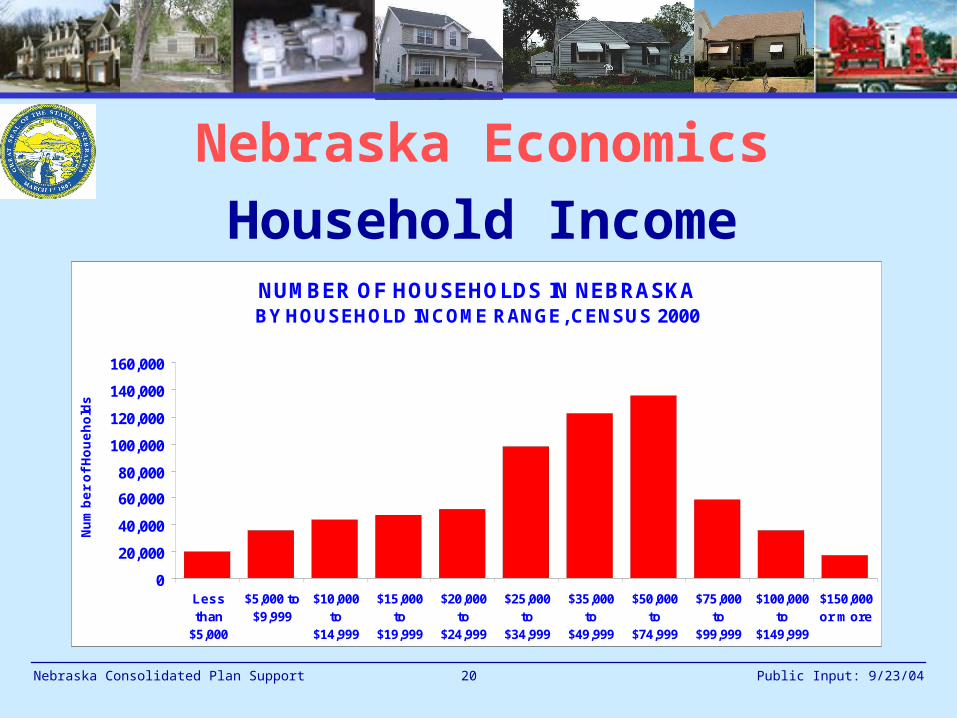
Nebraska Economics
Household IncomeNUMBER OF HOUSEHOLDS IN NEBRASKABY HOUSEHOLD INCOME RANGE, CENSUS 2000
0
20,000
40,000
60,000
80,000
100,000
120,000
140,000
160,000
Lessthan
$5,000
$5,000 to$9,999
$10,000to
$14,999
$15,000to
$19,999
$20,000to
$24,999
$25,000to
$34,999
$35,000to
$49,999
$50,000to
$74,999
$75,000to
$99,999
$100,000to
$149,999
$150,000or more
Nu
mb
er
of
Ho
ue
ho
lds
Nebraska Consolidated Plan Support Public Input: 9/23/0421
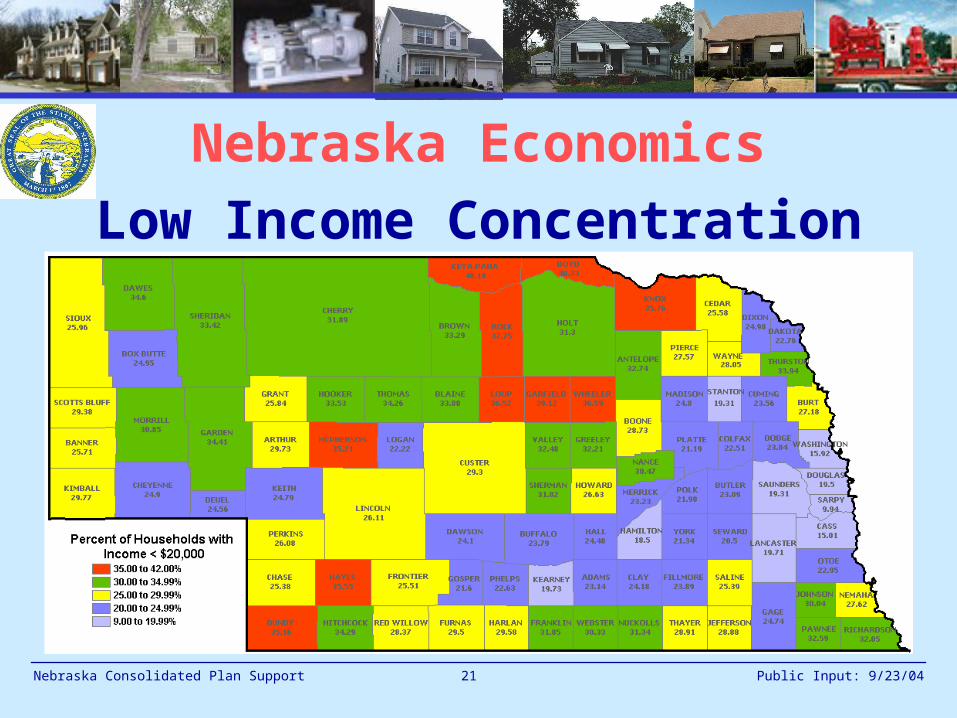
Nebraska Economics
Low Income Concentration

Nebraska Consolidated Plan Support Public Input: 9/23/0422
Nebraska Economics
Renter Household IncomeNUMBER OF LMI RENTER HOUSEHOLDS IN NEBRASKA
1990 AND 2000 CENSUS
15,000
25,000
35,000
45,000
55,000
65,000
75,000
0-30% MFI 30-50% MFI 50-80% MFI 80-95% MFI >95% MFI
Nu
mb
er o
f H
ou
eho
lds
1990 Renters 2000 Renters
Nebraska Consolidated Plan Support Public Input: 9/23/0423
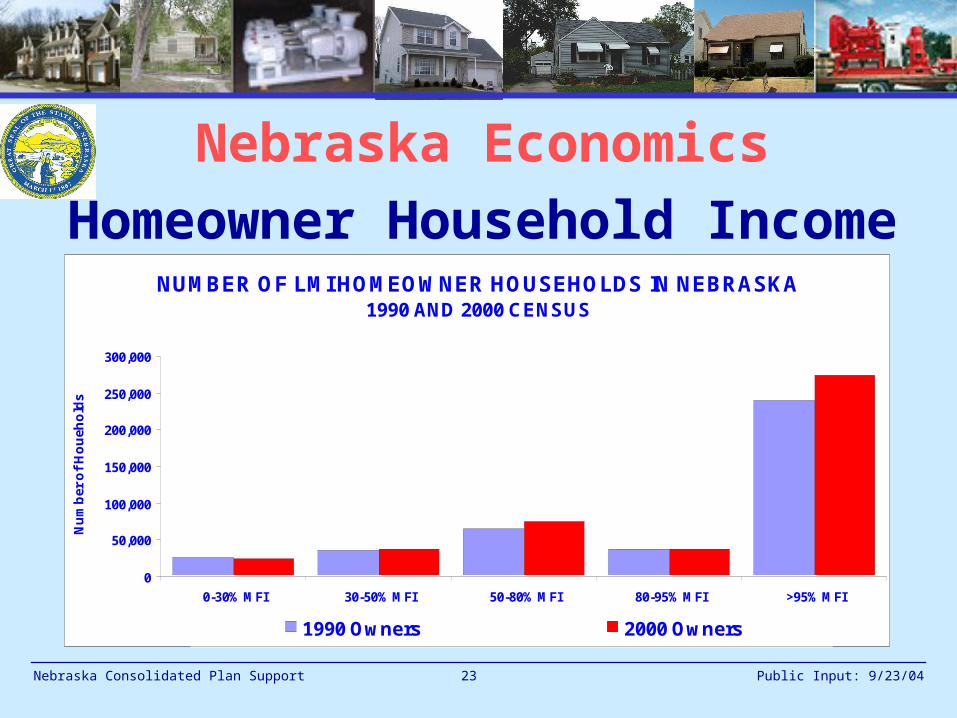
Nebraska Economics
Homeowner Household IncomeNUMBER OF LMI HOMEOWNER HOUSEHOLDS IN NEBRASKA
1990 AND 2000 CENSUS
0
50,000
100,000
150,000
200,000
250,000
300,000
0-30% MFI 30-50% MFI 50-80% MFI 80-95% MFI >95% MFI
Nu
mb
er o
f H
ou
eho
lds
1990 Owners 2000 Owners
Nebraska Consolidated Plan Support Public Input: 9/23/0424
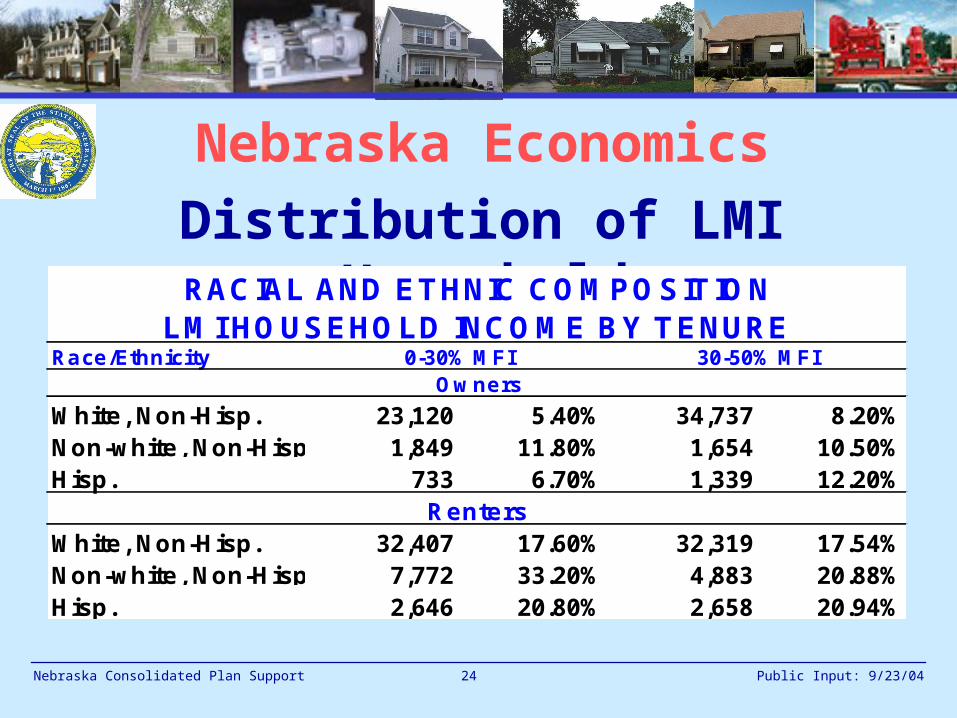
Nebraska Economics
Distribution of LMI Households
Race/Ethnicity
White, Non-Hisp. 23,120 5.40% 34,737 8.20%Non-white, Non-Hisp. 1,849 11.80% 1,654 10.50%Hisp. 733 6.70% 1,339 12.20%
White, Non-Hisp. 32,407 17.60% 32,319 17.54%Non-white, Non-Hisp. 7,772 33.20% 4,883 20.88%Hisp. 2,646 20.80% 2,658 20.94%
LM I HOUSEHOLD INCOM E BY T ENURERACIAL AND ET HNIC COM POSIT ION
Ow ners
Renters
0-30% MFI 30-50% MFI
Nebraska Consolidated Plan Support Public Input: 9/23/0425
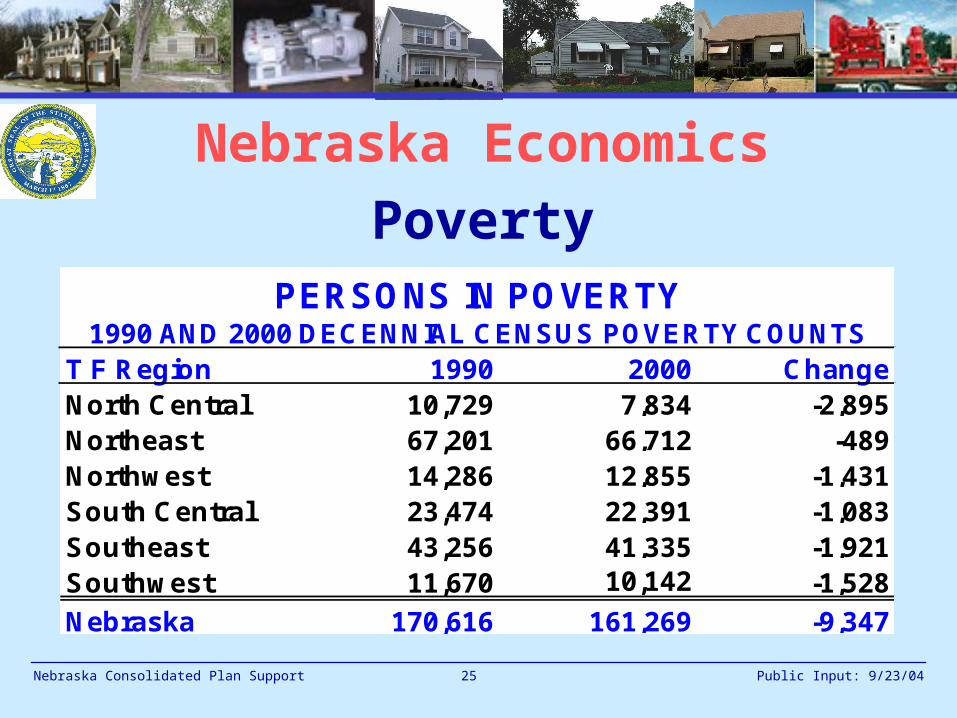
Nebraska Economics
Poverty
T F Region 1990 2000 ChangeNorth Central 10,729 7,834 -2,895Northeast 67,201 66,712 -489Northwest 14,286 12,855 -1,431South Central 23,474 22,391 -1,083Southeast 43,256 41,335 -1,921Southwest 11,670 10,142 -1,528
Nebraska 170,616 161,269 -9,347
1990 AND 2000 DECENNIAL CENSUS POVERTY COUNTSPERSONS IN POVERTY
Nebraska Consolidated Plan Support Public Input: 9/23/0426
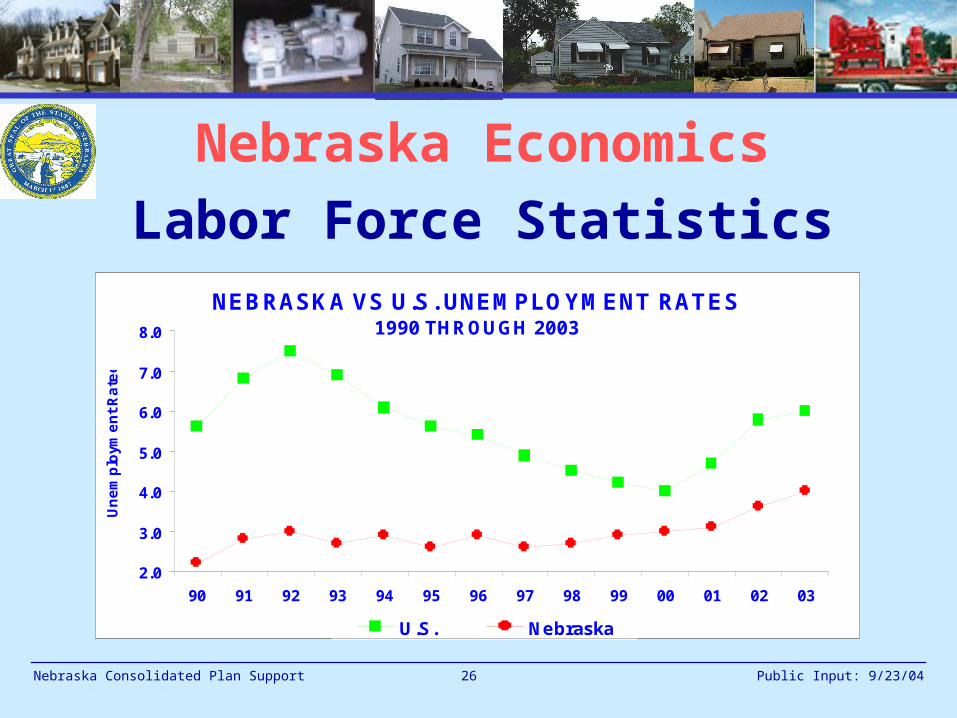
Nebraska Economics
Labor Force StatisticsNEBRASKA VS U.S. UNEMPLOYMENT RATES
1990 THROUGH 2003
2.0
3.0
4.0
5.0
6.0
7.0
8.0
90 91 92 93 94 95 96 97 98 99 00 01 02 03
Un
em
plo
yme
nt
Ra
tee
U.S. Nebraska
Nebraska Consolidated Plan Support Public Input: 9/23/0427
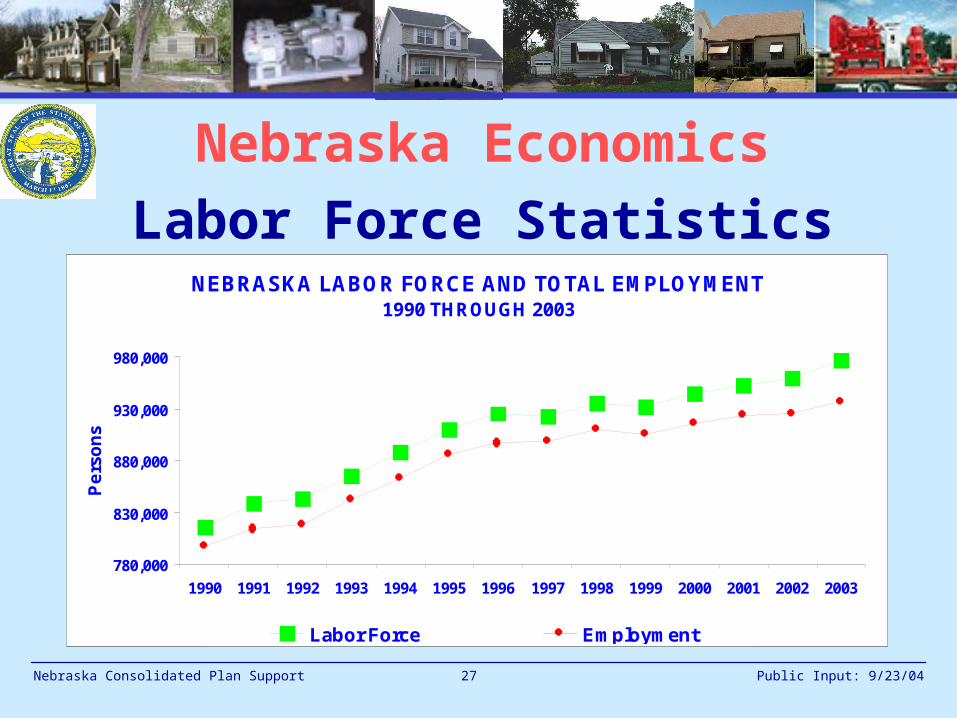
Nebraska Economics
Labor Force StatisticsNEBRASKA LABOR FORCE AND TOTAL EMPLOYMENT
1990 THROUGH 2003
780,000
830,000
880,000
930,000
980,000
1990 1991 1992 1993 1994 1995 1996 1997 1998 1999 2000 2001 2002 2003
Pe
rso
ns
Labor Force Employment

Nebraska Consolidated Plan Support Public Input: 9/23/0428
Nebraska Economics
Full and Part-time EmploymentNEBRASKA FULL AND PART-TIME EMPLOYMENT
1969 - 2002
1,181,011
1,183,320
600,000
700,000
800,000
900,000
1,000,000
1,100,000
1,200,000
1,300,000
69 71 73 75 77 79 81 83 85 87 89 91 93 95 97 99 01
Full
and
Par
t-ti
me
Em
plo
yme
nt

Nebraska Consolidated Plan Support Public Input: 9/23/0429
Nebraska Economics
Average Real Earnings Per JobNEBRASKA VS U.S. REAL EARNINGS PER JOB
2003 DOLLARS
33,372
41,436
$22,000
$25,000
$28,000
$31,000
$34,000
$37,000
$40,000
69 71 73 75 77 79 81 83 85 87 89 91 93 95 97 99 01
Re
al A
vera
ge
$ P
er
Job
Nebraska U.S.

Nebraska Consolidated Plan Support Public Input: 9/23/0430
Nebraska Economics
Per Capita IncomeNEBRASKA VS U.S.
REAL PER CAPITA INCOME, 2003 DOLLARS
$12,000
$15,000
$18,000
$21,000
$24,000
$27,000
$30,000
69 71 73 75 77 79 81 83 85 87 89 91 93 95 97 99 01 03
Re
al P
er
Cap
ita
Inco
me
Nebraska U.S. Per Capita Income

Nebraska Consolidated Plan Support Public Input: 9/23/0431
Nebraska Housing
Housing Stock 1990-2000
T F Region 1990 2000 % ChangeNorth Central 28,892 28,237 -2.30%Northeast 261,330 287,837 10.10%Northwest 46,268 47,010 1.60%South Central 86,751 91,273 5.20%Southeast 194,377 223,913 15.20%Southwest 43,003 44,398 3.20%
Nebraska 660,621 722,668 9.40%
1990 AND 2000 DECENNIAL CENSUSTOTAL HOUSING UNITS IN NEBRASKA

Nebraska Consolidated Plan Support Public Input: 9/23/0432
Nebraska Housing
Housing Stock 1990-2000
T F Region 1990 2000 % ChangeNorth Central 23,811 23,319 -2.1%Northeast 242,481 269,645 11.2%Northwest 39,275 40,692 3.6%South Central 78,657 83,198 5.8%Southeast 181,408 210,594 16.1%Southwest 36,731 38,736 5.5%
Nebraska 602,363 666,184 10.6%
OCCUPIED HOUSING UNITS IN NEBRASKA
Nebraska Consolidated Plan Support Public Input: 9/23/0433
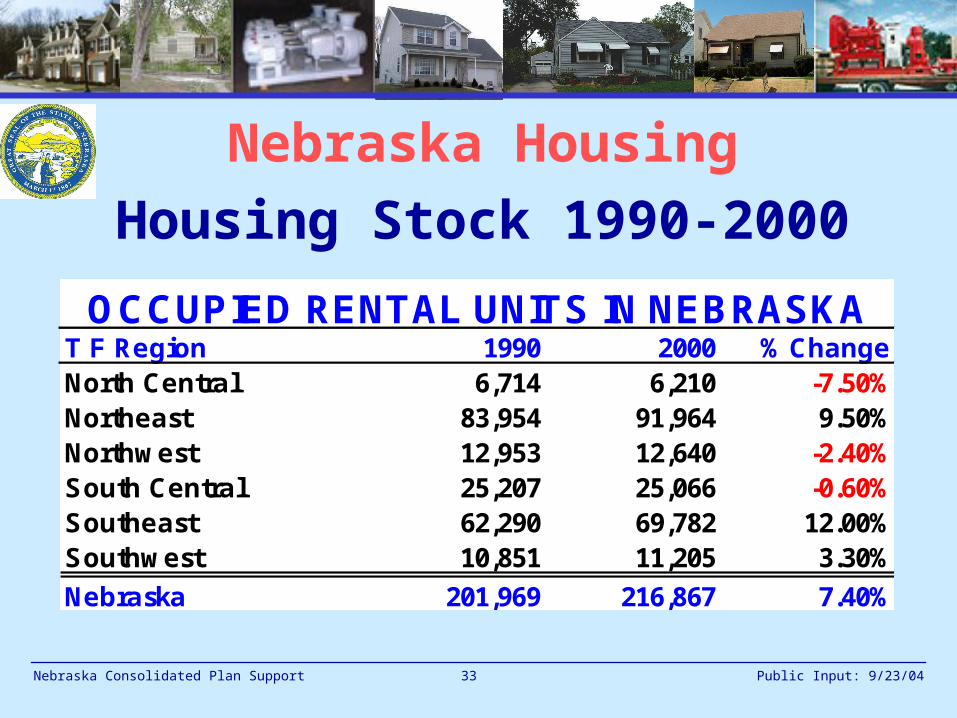
Nebraska Housing
Housing Stock 1990-2000
T F Region 1990 2000 % ChangeNorth Central 6,714 6,210 -7.50%Northeast 83,954 91,964 9.50%Northwest 12,953 12,640 -2.40%South Central 25,207 25,066 -0.60%Southeast 62,290 69,782 12.00%Southwest 10,851 11,205 3.30%
Nebraska 201,969 216,867 7.40%
OCCUPIED RENTAL UNITS IN NEBRASKA

Nebraska Consolidated Plan Support Public Input: 9/23/0434
Nebraska Housing
Housing Stock 1990-2000
T F Region 1990 2000 % ChangeNorth Central 2.25 3.57 1.32Northeast 1.50 1.30 -0.18Northwest 2.55 2.81 0.26South Central 1.74 2.44 0.70Southeast 1.50 1.57 0.07Southwest 2.16 2.86 0.70
Nebraska 1.68 1.81 0.13
HOMEOWNER VACANCY RATES IN NEBRASKA

Nebraska Consolidated Plan Support Public Input: 9/23/0435
Nebraska Housing
Housing Stock 1990-2000
T F Region 1990 2000 % ChangeNorth Central 2,166 1,644 -24.1%Northeast 5,312 4,009 -24.5%Northwest 2,293 1,650 -28.0%South Central 2,733 2,035 -25.5%Southeast 3,508 2,965 -15.5%Southwest 2,414 1,340 -44.5%
Nebraska 18,426 13,643 -26.0%
"OTHER VACANT" HOUSING IN NEBRASKA
Nebraska Consolidated Plan Support Public Input: 9/23/0436
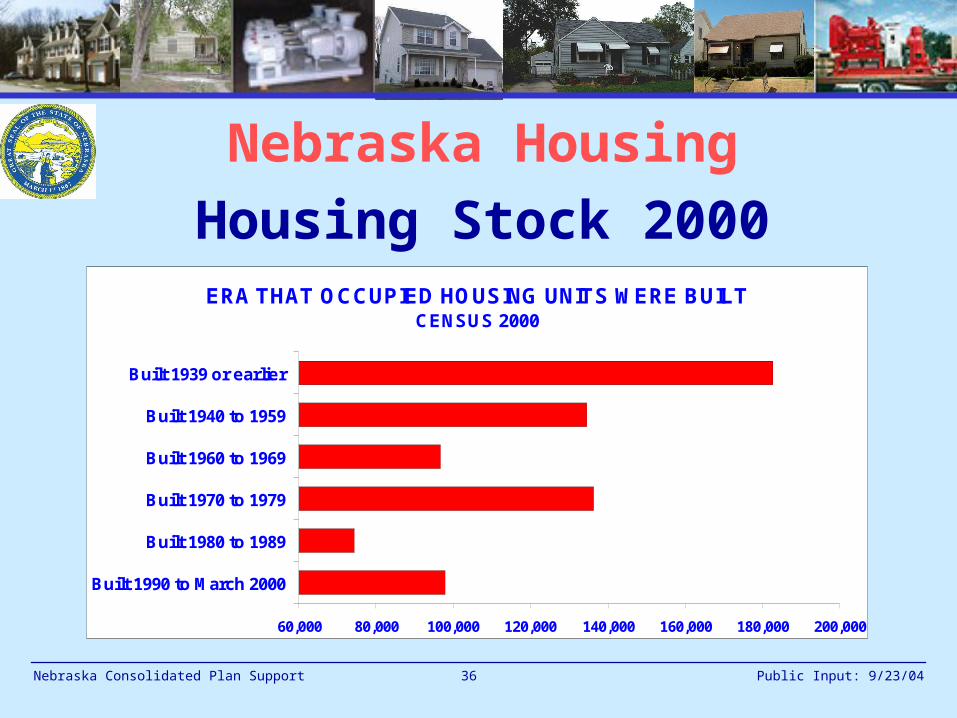
Nebraska Housing
Housing Stock 2000ERA THAT OCCUPIED HOUSING UNITS WERE BUILT
CENSUS 2000
60,000 80,000 100,000 120,000 140,000 160,000 180,000 200,000
Built 1990 to March 2000
Built 1980 to 1989
Built 1970 to 1979
Built 1960 to 1969
Built 1940 to 1959
Built 1939 or earlier

Nebraska Consolidated Plan Support Public Input: 9/23/0437
Nebraska Housing
Housing Conditions
Year Structure Built Owner Renter Total Percent1939 or earlier 106,640 40,998 147,638 22.161940 to 1949 22,939 13,996 36,935 5.541950 to 1959 42,362 20,175 62,537 9.391960 to 1979 88,196 46,490 134,686 20.22
Total 260,137 121,659 381,796 57.31
UNITS AT RISK OF LEAD-BASED PAINTNEBRASKA: 2000 CENSUS

Nebraska Consolidated Plan Support Public Input: 9/23/0438
Nebraska Housing
Housing Conditions
Renters HomeownersOvercrowded 6,033 4,432Severely overcrowded 5,279 2,219Total 11,312 6,651
% of Households 5.2% 1.5%
OVERCROWDED HOUSEHOLDS IN 2000

Nebraska Consolidated Plan Support Public Input: 9/23/0439
Nebraska Housing
Housing Conditions
Overcrowding Severe O.C.Trust Fund Region % Change % ChangeNorth Central -23.0 50.0Northeast 45.9 288.8Northwest 9.0 71.7South Central 42.3 308.4Southeast 52.6 212.6Southwest 117.7 722.2
Nebraska 44.5 250.5
PERCENT CHANGE IN OVERCROWDING1990 - 2000
Nebraska Consolidated Plan Support Public Input: 9/23/0440
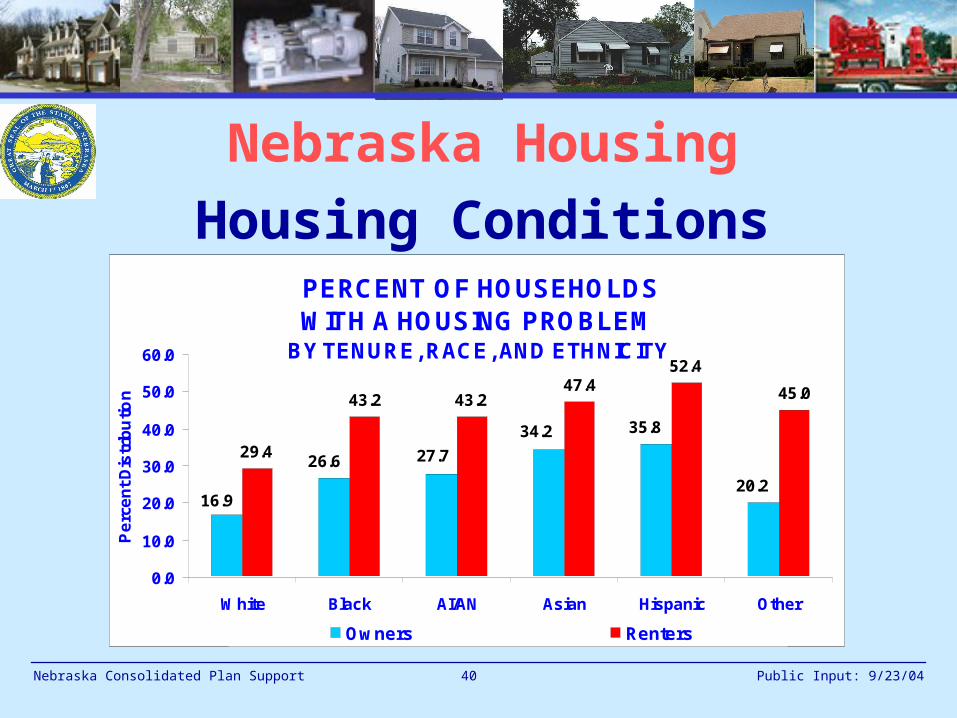
Nebraska Housing
Housing Conditions PERCENT OF HOUSEHOLDS WITH A HOUSING PROBLEM
BY TENURE, RACE, AND ETHNICITY
29.4
43.2 43.247.4
52.4
45.0
16.9
26.6 27.7
34.2 35.8
20.2
0.0
10.0
20.0
30.0
40.0
50.0
60.0
White Black AI/AN Asian Hispanic Other
Pe
rce
nt
Dis
trib
utio
n
Owners Renters

Nebraska Consolidated Plan Support Public Input: 9/23/0441
Nebraska Housing
Housing ProductionDWELLING PERMITS ISSUED IN
NEBRASKA1980-2003
2,000
3,000
4,000
5,000
6,000
7,000
8,000
9,000
10,000
11,000
80 82 84 86 88 90 92 94 96 98 00 02
Pe
rmit
s Is
su
ed
Single-family units Total Units
Nebraska Consolidated Plan Support Public Input: 9/23/0442
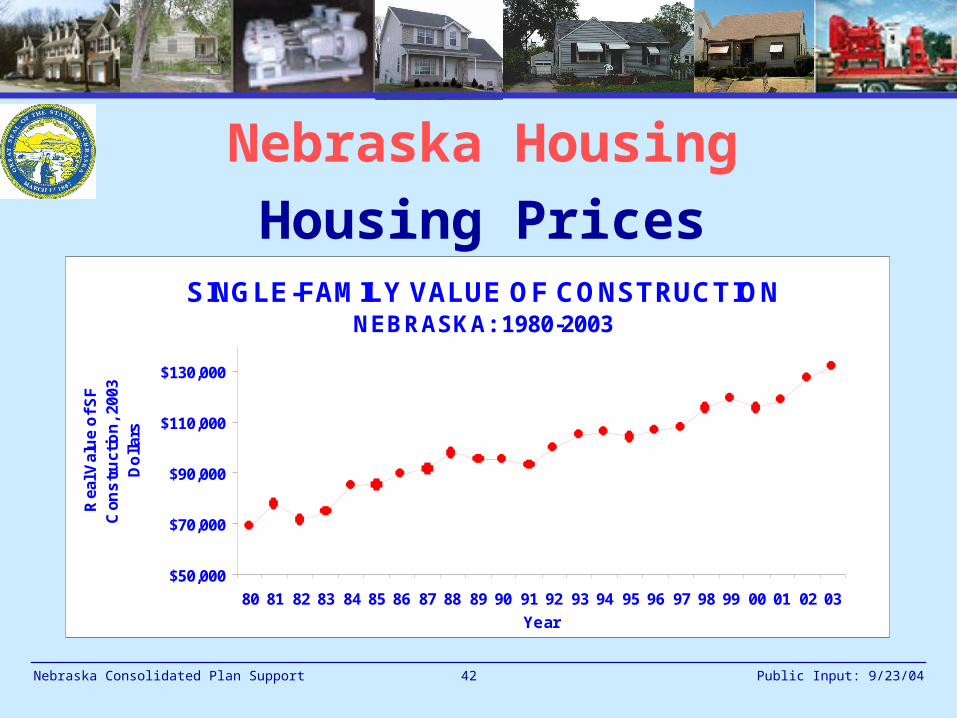
Nebraska Housing
Housing PricesSINGLE-FAMILY VALUE OF CONSTRUCTION
NEBRASKA: 1980-2003
$50,000
$70,000
$90,000
$110,000
$130,000
80 81 82 83 84 85 86 87 88 89 90 91 92 93 94 95 96 97 98 99 00 01 02 03
Year
Rea
l Val
ue
of S
F
Con
str
uct
ion
, 200
3 D
olla
rs

Nebraska Consolidated Plan Support Public Input: 9/23/0443
Nebraska Housing
Housing PricesNEBRASKA HOUSING PRICE INDEXOFHEO: 1975 THROUGH 2004, 1980 = 100
50
100
150
200
250
300
350
75 77 79 81 83 85 87 89 91 93 95 97 99 01 03
Year
Pri
ce In
de
x
US Nebraska
Nebraska Consolidated Plan Support Public Input: 9/23/0444
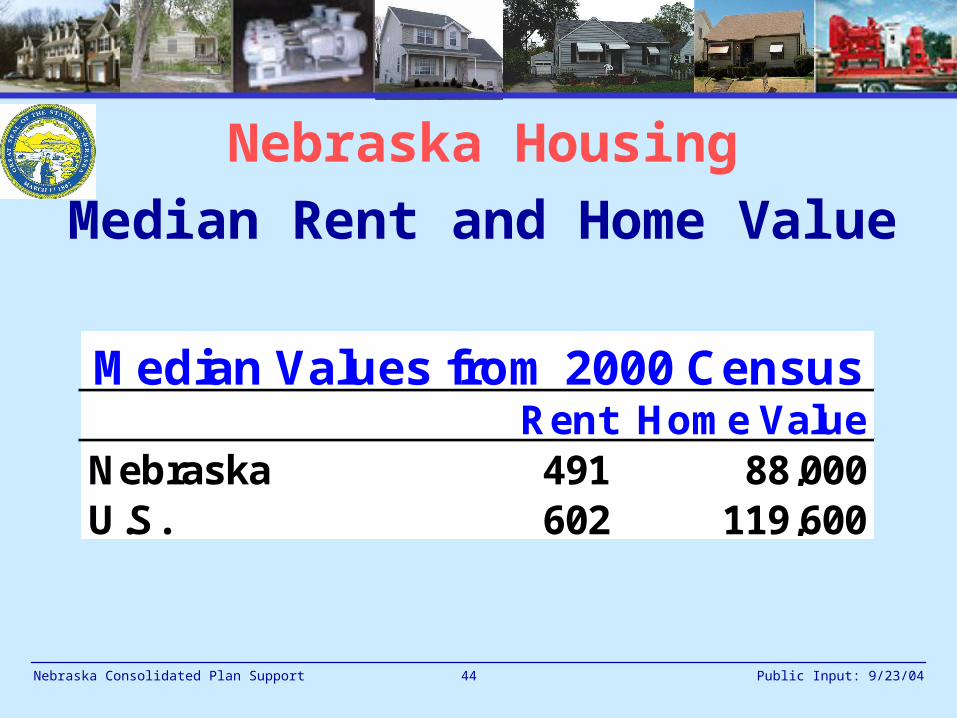
Nebraska Housing
Median Rent and Home Value
Rent Home ValueNebraska 491 88,000U.S. 602 119,600
Median Values from 2000 Census

Nebraska Consolidated Plan Support Public Input: 9/23/0445
Nebraska Housing
2000 Cost BurdenRenters NE USCost Burden 18.5% 20.8%Severe Cost Burden 14.5% 19.1%Homeowners with MortgageCost Burden 13.9% 17.7%Severe Cost Burden 5.7% 9.1%Homeowners without MortgageCost Burden 5.8% 6.5%Severe Cost Burden 3.0% 4.2%
Nebraska Consolidated Plan Support Public Input: 9/23/0446
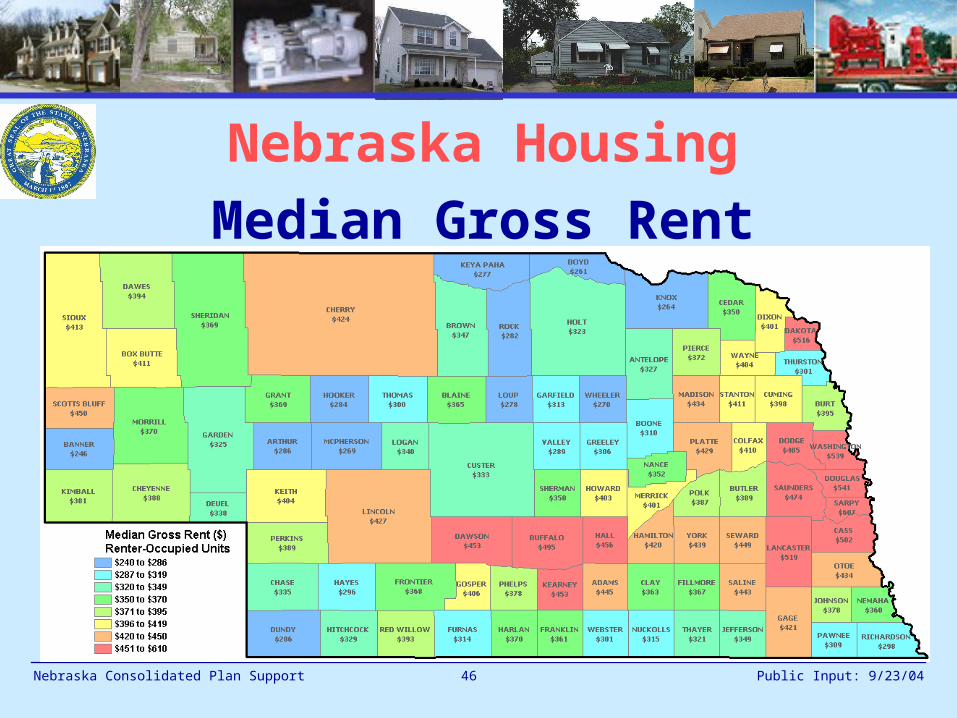
Nebraska Housing
Median Gross Rent
Nebraska Consolidated Plan Support Public Input: 9/23/0447
Nebraska Housing
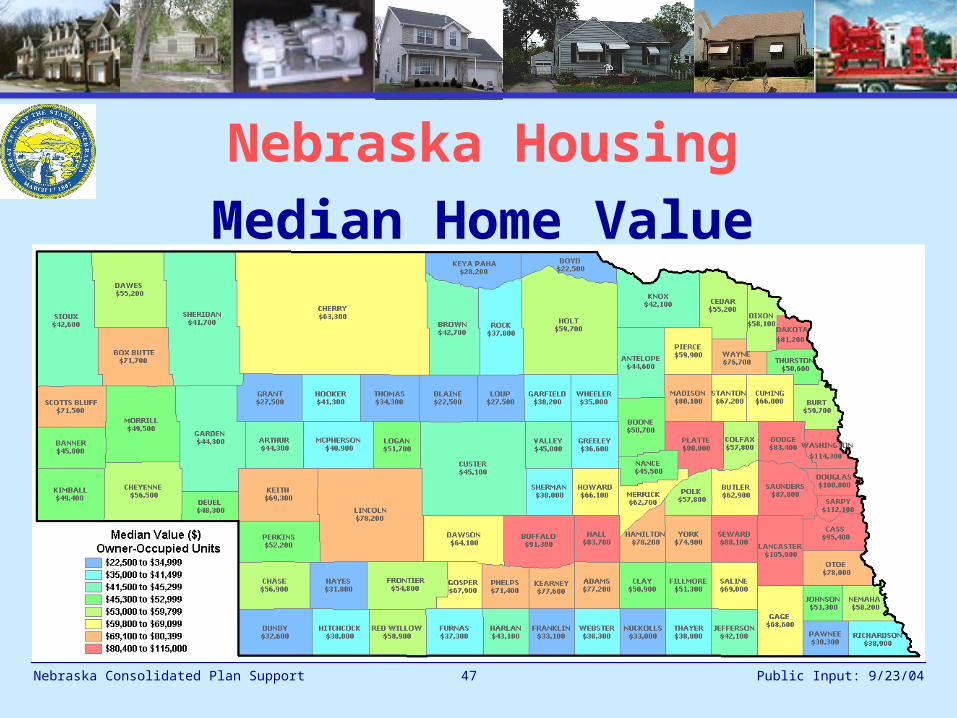
Median Home Value
Nebraska Consolidated Plan Support Public Input: 9/23/0448
Nebraska Housing
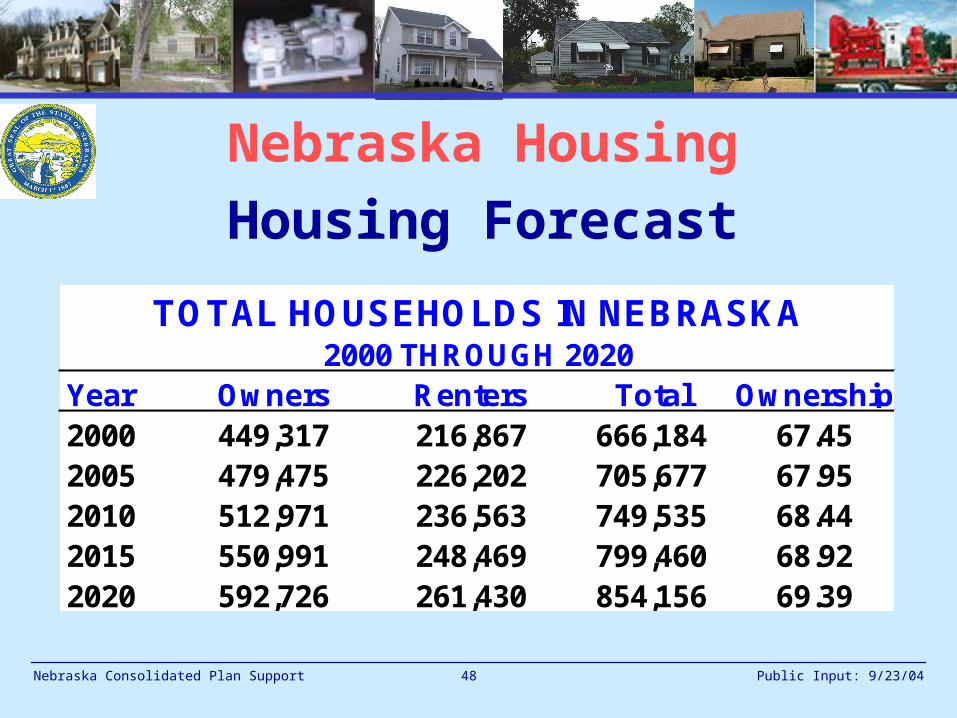
Housing Forecast
Year Owners Renters Total Ownership2000 449,317 216,867 666,184 67.452005 479,475 226,202 705,677 67.952010 512,971 236,563 749,535 68.442015 550,991 248,469 799,460 68.922020 592,726 261,430 854,156 69.39
2000 THROUGH 2020TOTAL HOUSEHOLDS IN NEBRASKA
Nebraska Consolidated Plan Support Public Input: 9/23/0449
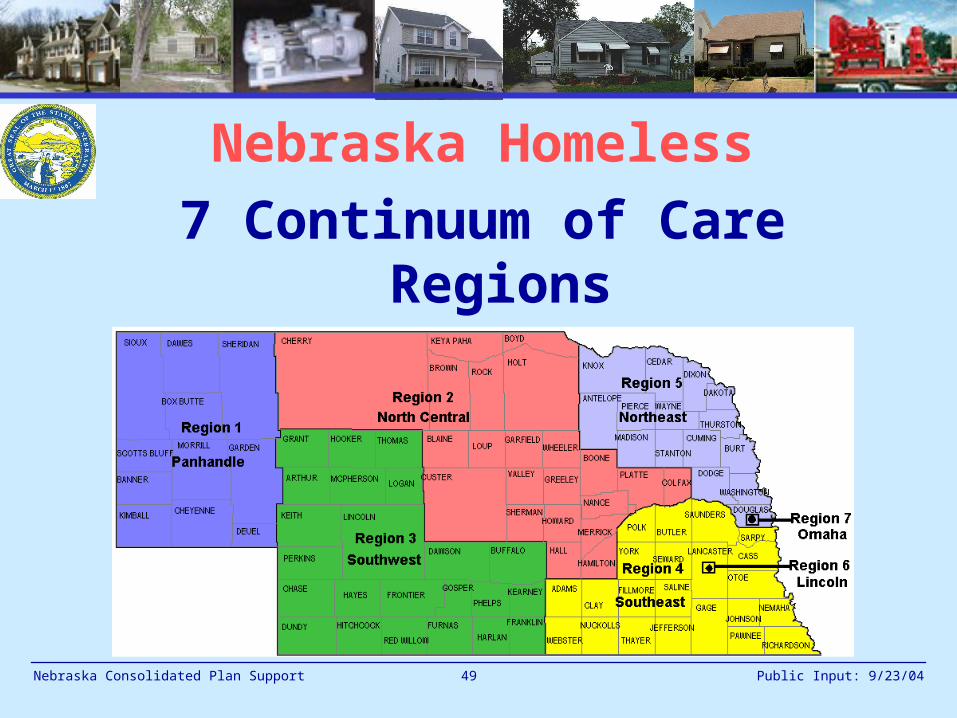
Nebraska Homeless
7 Continuum of Care Regions
Plan excludes Lincoln & Omaha
Nebraska Consolidated Plan Support Public Input: 9/23/0450
Nebraska Homeless
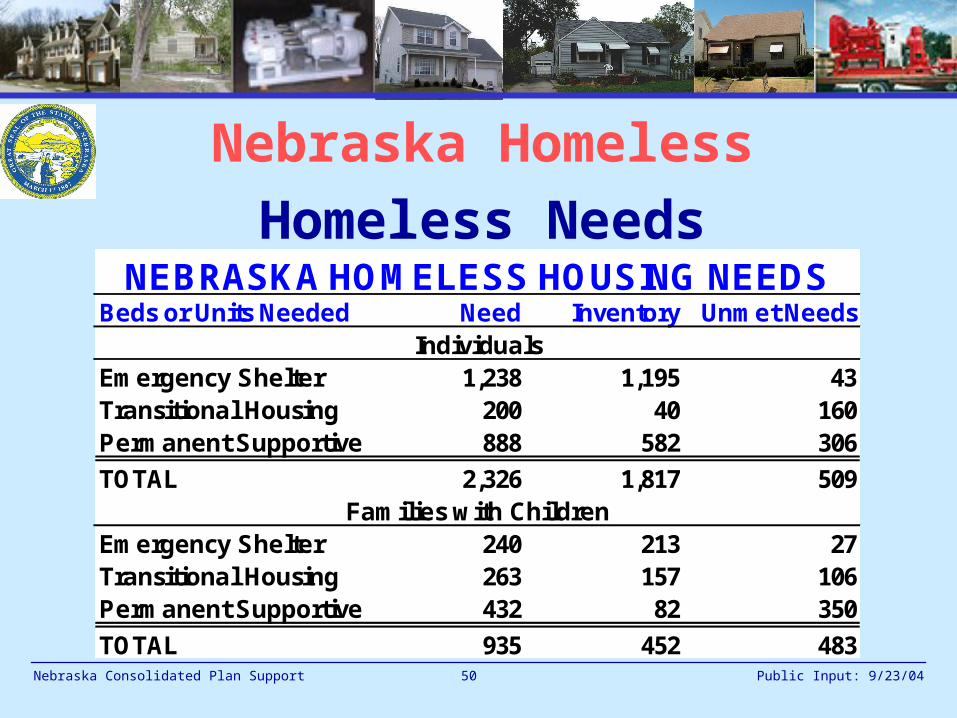
Homeless Needs
Beds or Units Needed Need Inventory Unmet Needs
Emergency Shelter 1,238 1,195 43Transitional Housing 200 40 160Permanent Supportive 888 582 306
TOTAL 2,326 1,817 509
Emergency Shelter 240 213 27Transitional Housing 263 157 106Permanent Supportive 432 82 350
TOTAL 935 452 483
Individuals
Families with Children
NEBRASKA HOMELESS HOUSING NEEDS

Nebraska Consolidated Plan Support Public Input: 9/23/0451
Nebraska Homeless
Homeless Subpopulations
Data for five Continuum of Care Regions
Subpopulations TotalChronic Substance abuse 110Seriously Mentally Ill 72Dually-Diagnosed 0Veterans 24Persons w/HIV/AIDS 0Victims of Domestic Violence 146Youth 12Other 0
HOMELESS SUBPOPULATIONS

Nebraska Consolidated Plan Support Public Input: 9/23/0452
Nebraska Homeless
NHAP Homeless Counts
NHAP data for five Continuum of Care Regions
CoC Region Homeless Near HomelessPanhandle 571 4,024North Central 704 5,761Southwest 1,415 3,319Southeast 2,182 5,889Northeast 816 2,742
Total DED Region 5,688 21,735
NHAP HOMELESS COUNTS BY REGION
Nebraska Consolidated Plan Support Public Input: 9/23/0453
Nebraska Homeless
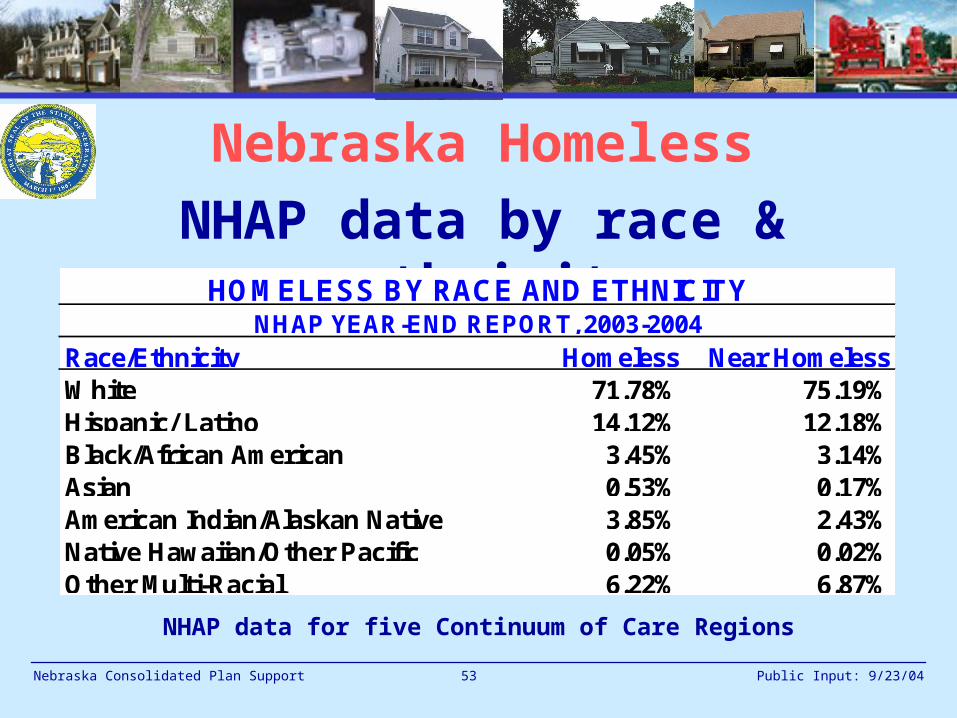
NHAP data by race & ethnicity
NHAP data for five Continuum of Care Regions
Race/Ethnicity Homeless Near HomelessWhite 71.78% 75.19%Hispanic/ Latino 14.12% 12.18%Black/African American 3.45% 3.14%Asian 0.53% 0.17%American Indian/Alaskan Native 3.85% 2.43%Native Hawaiian/Other Pacific 0.05% 0.02%Other Multi-Racial 6.22% 6.87%
HOMELESS BY RACE AND ETHNICITYNHAP YEAR-END REPORT, 2003-2004
Nebraska Consolidated Plan Support Public Input: 9/23/0454
Development District Reports
Issues ExpressedProgram design and contentSpecific project preferencesBarriers to program efficienciesLonger term issues, goals, and
strategies
Nebraska Consolidated Plan Support Public Input: 9/23/0455
Development District Reports
Summary of Needs ExpressedHousing and HomelessnessEconomic DevelopmentCommunity DevelopmentBusiness DevelopmentPlanning

Nebraska Consolidated Plan Support Public Input: 9/23/0456
Nebraska Five-Year Strategies
Housing:
1. Expand education and outreach
2. Promote housing preservation
3. Expand homeownership
4. Promote additional affordable rental units in selected markets

Nebraska Consolidated Plan Support Public Input: 9/23/0457
Nebraska Five-Year Strategies
Homelessness:
1. Promote self-sufficiency and permanent housing
2. Support and facilitate CoC
3. Improve data collection for planning and service delivery

Nebraska Consolidated Plan Support Public Input: 9/23/0458
Nebraska Five-Year Strategies
Economic Development:
1. Promote new and expanded export business
2. Foster new opportunities for entrepreneurs and small biz
3. Enhance efficiency of program

Nebraska Consolidated Plan Support Public Input: 9/23/0459
Nebraska Five-Year Strategies
Community Development:
1. Increase capacity for infrastructure planning
2. Improve water and wastewater systems throughout Nebr.
3. Assist in infrastructure planning

Nebraska Consolidated Plan Support Public Input: 9/23/0460
Nebraska Fair Housing
Contact Information:Ms. Jen Bolen
Nebr. Department of Economic Development
301 Centennial Mall South, P.O. Box 94666
Lincoln, NE 68509-4666
1-800-426-6505 or [email protected]