1 random genetic drift 2 conditions for maintaining hardy-weinberg equilibrium: 1. random mating 2....
TRANSCRIPT

1
Random Genetic Random Genetic DriftDrift
2
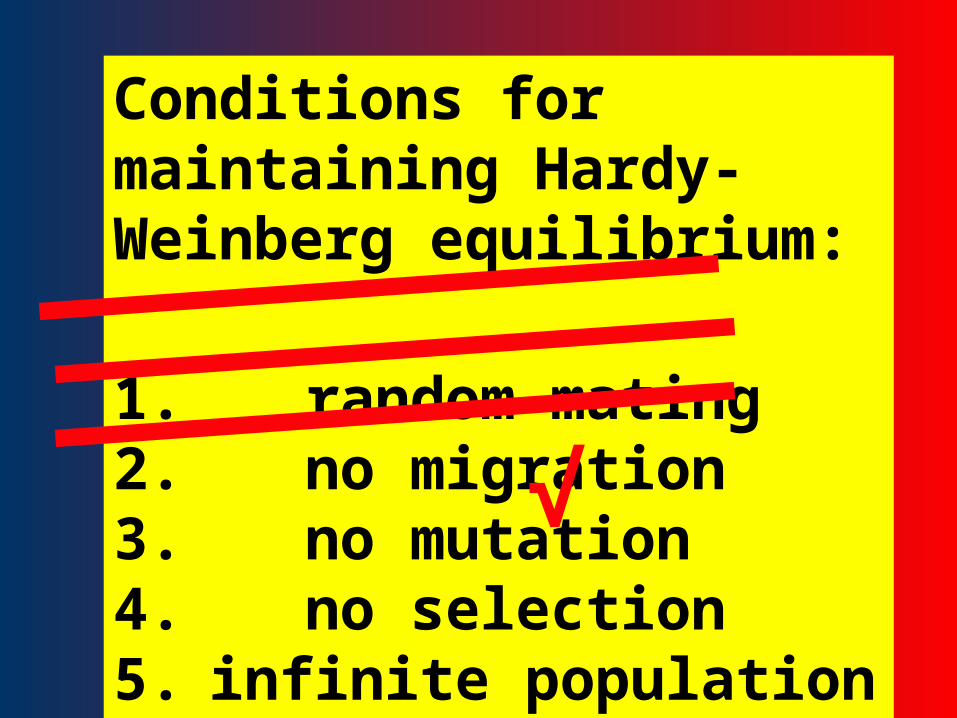
Conditions for maintaining Hardy-Weinberg equilibrium:
1. random mating2. no migration3. no mutation4. no selection5. infinite population size
√

3
2 mathematical approaches to studying genetic changes in populations:
Deterministic models
Stochastic models

4
DriftDriftAllele frequency changes can occur by chance, in which case the changes are not directional but random. An important factor in producing changes in allele frequencies is the random sampling of gametes during reproduction.
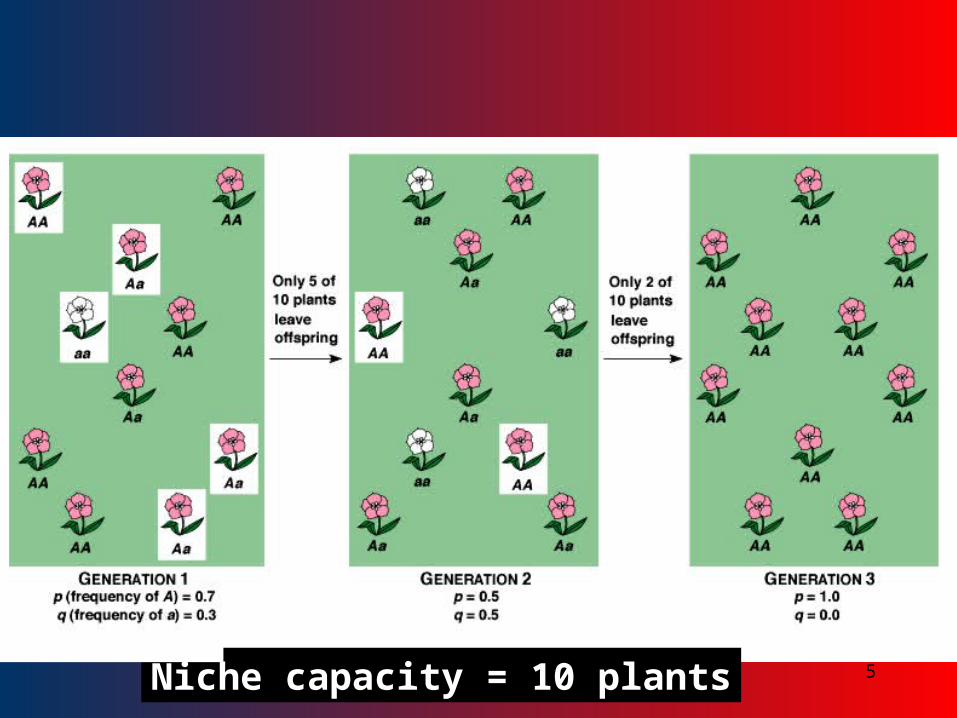
5Niche capacity = 10 plants
6
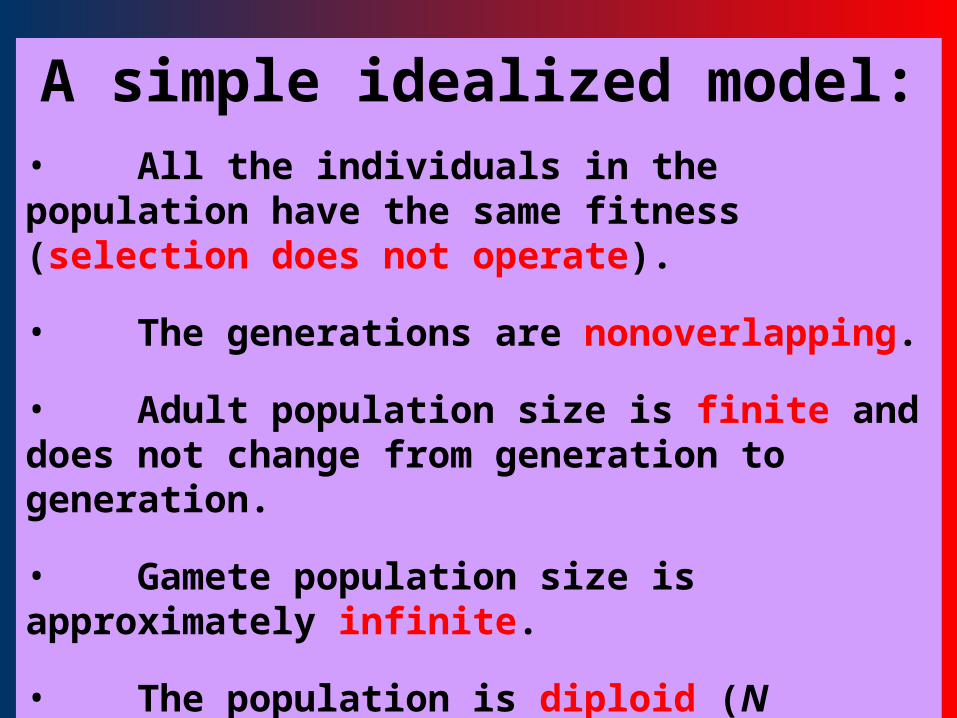
A simple idealized model:• All the individuals in the population have the same fitness (selection does not operate).
• The generations are nonoverlapping.
• Adult population size is finite and does not change from generation to generation.
• Gamete population size is approximately infinite.
• The population is diploid (N individuals, 2N alleles).
• One locus with two alleles, A1 and A2, with frequencies p and q = 1 – p, respectively.

7
Adult population = 2 diploid individuals
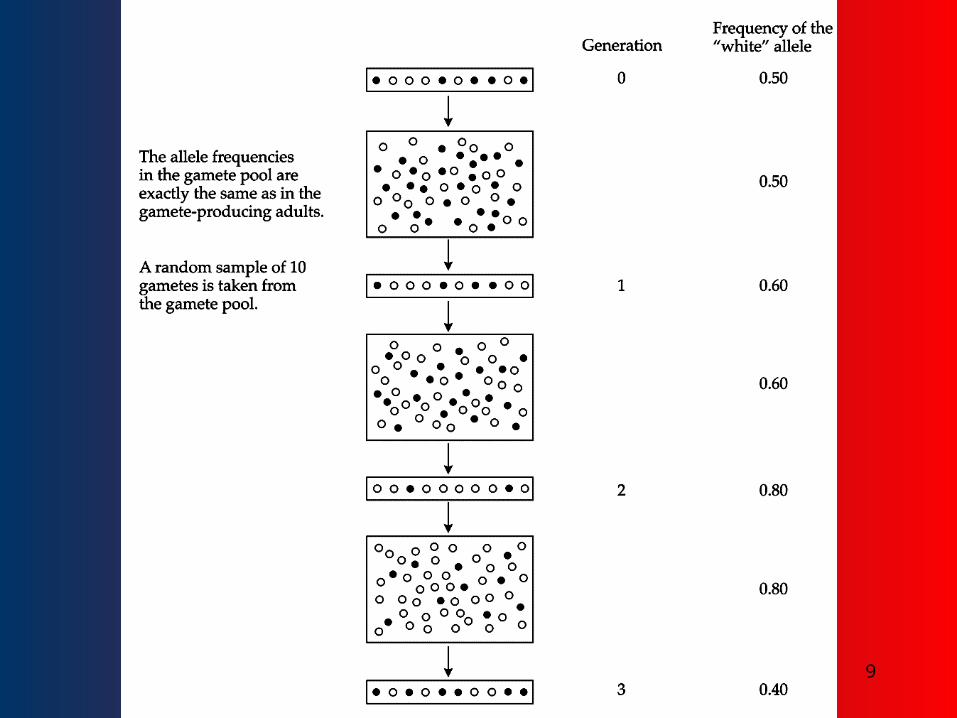
Gamete population = ∞The gamete population has exactly the same allele frequencies as the adult population from which it is derived.
Generation 1
Generation 2
Generation 3
The gamete population is sampled randomly to derived the next adult population.
8
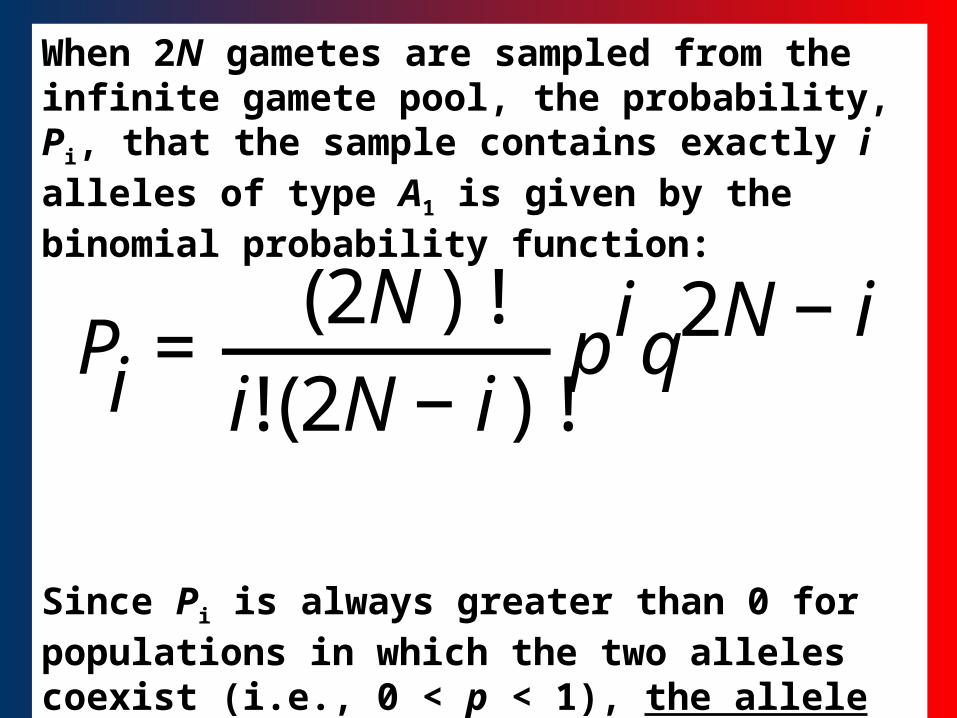
When 2N gametes are sampled from the infinite gamete pool, the probability, Pi, that the sample contains exactly i alleles of type A1 is given by the binomial probability function:
Since Pi is always greater than 0 for populations in which the two alleles coexist (i.e., 0 < p < 1), the allele frequencies may change from generation to generation without the aid of selection.
€
Pi =(2N)!
i!(2N −i)!piq2N −i
9

10
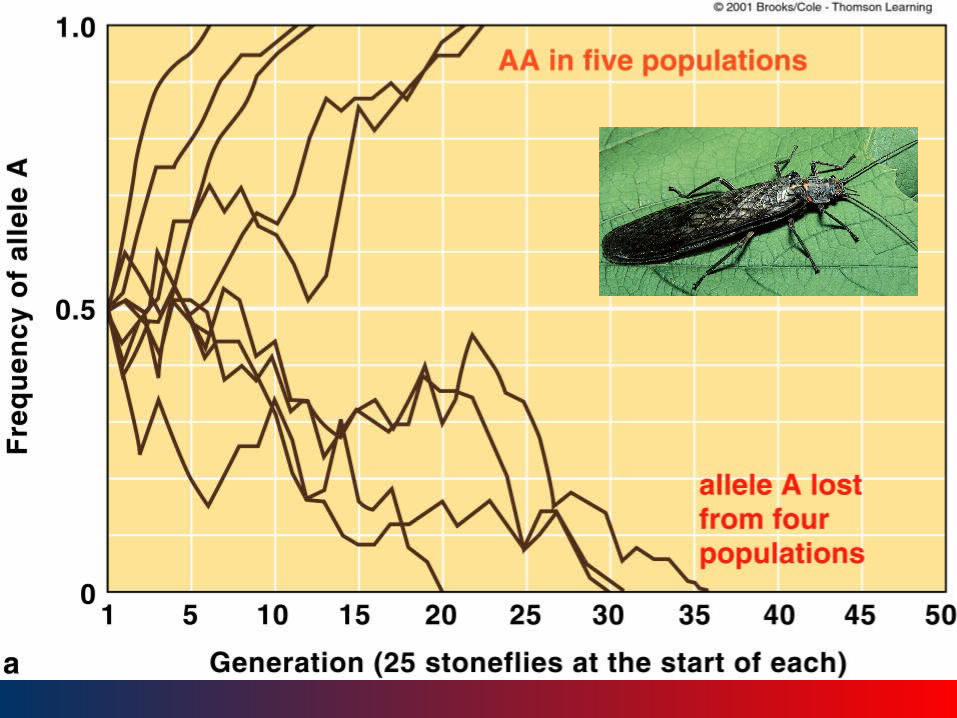
The process of The process of change in change in allele allele frequency due frequency due solely to solely to chancechance effectseffects is calledis called randomrandom geneticgenetic driftdrift. .

11FixationFixation

12

13
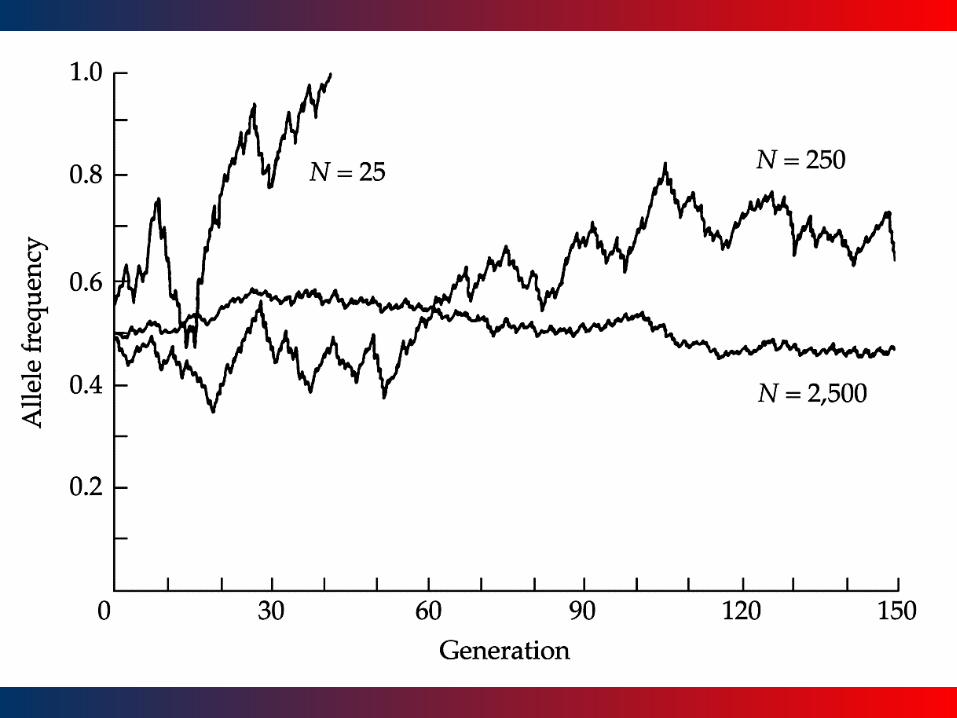
Magnitude of fluctuations Magnitude of fluctuations depends on population size. depends on population size.
Large population = Small Large population = Small fluctuations. fluctuations.
Small population = Large Small population = Large fluctuations.fluctuations.
Mean time to fixation or Mean time to fixation or loss depends on population loss depends on population size. size.
Large population = Long Large population = Long time. time.
Small population = Short Small population = Short time.time.
14

15
yet
16

17
Fixation by Drift on an Y-Linked Trait* in a Small Population
*Family names!

18
Founders of Pitcairn Island population in 17891789
30 males12 family names
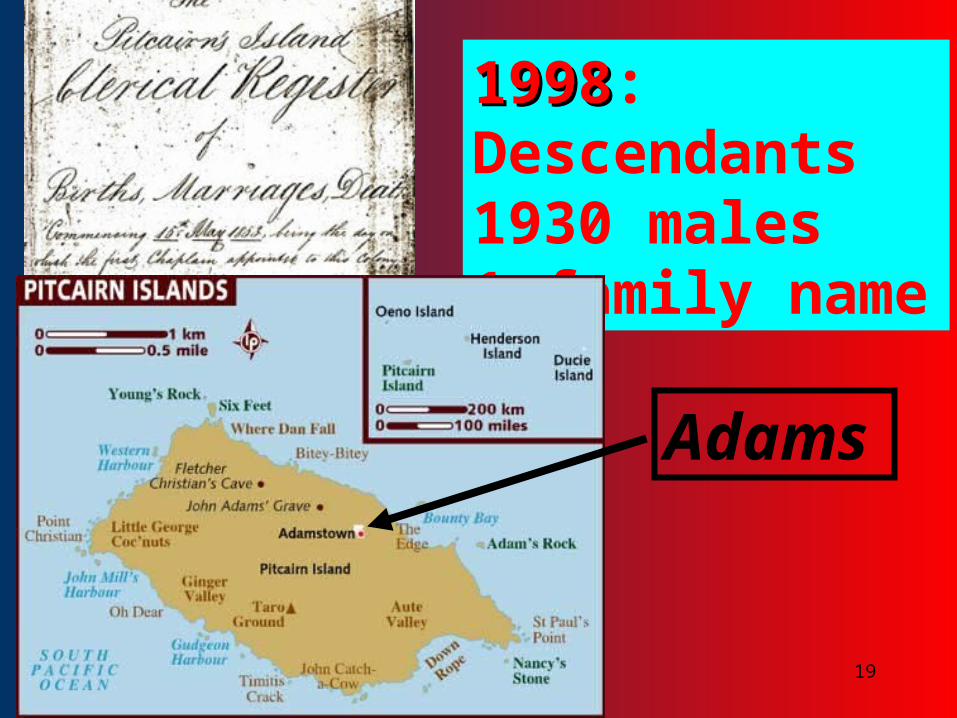
19
19981998: Descendants1930 males1 family name
Adams

20
Random Genetic Drift = Markov Random Genetic Drift = Markov ProcessProcess
A random process whose A random process whose probabilities at each probabilities at each stage are determined stage are determined by the values of its by the values of its preceding stage, i.e., preceding stage, i.e., a process with very a process with very short short historicalhistorical memormemory.y.

21
An important property An important property of random genetic of random genetic drift is its drift is its cumulativecumulative behaviorbehavior; ; i.e., from generation i.e., from generation to generation, the to generation, the frequency of an allele frequency of an allele will will tendtend to deviate to deviate more and more from its more and more from its initial frequency. initial frequency.
22
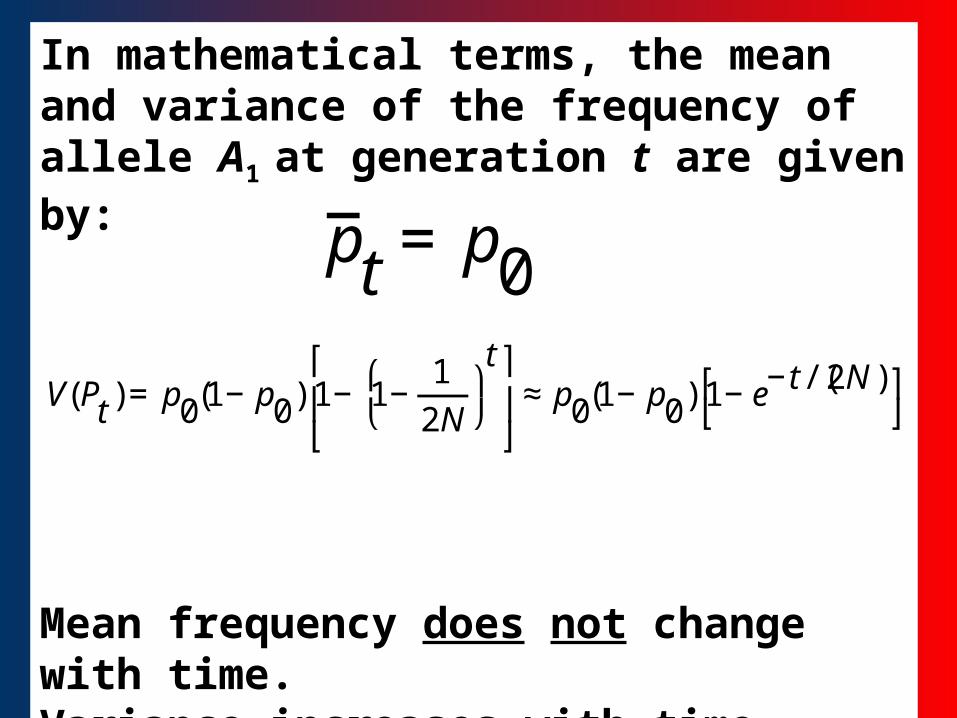
In mathematical terms, the mean and variance of the frequency of allele A1 at generation t are given by:
Mean frequency does not change with time.Variance increases with time.
€
p t = p0
€
V(Pt)= p0(1−p0) 1− 1−1
2N⎛ ⎝
⎞ ⎠
t⎡
⎣ ⎢
⎤
⎦ ⎥ ≈p0(1−p0) 1−e−t/(2N)⎡
⎣ ⎤ ⎦

23
With each passing generation the allele frequencies will tend to deviate further and further from their initial values, however the change in allele frequencies will NOT be systematic in its direction.

24
Change in probability of not deviating from initial frequencies with time

25
Random genetic driftRandom genetic driftisis an an importantimportant
evolutionary force evolutionary force

26
Selection mamayy not chan not changgee allele frequencies.
Allele frequencies mamayy chan changgee without selection.
A summary:

27

28
EffectivEffectiveepopulatipopulationonsizesize
29
Population size = the total number of individuals in a population.
From an evolutionary point of view, however, the relevant size consists of only those individuals that actively participate in the reproductive process.
This part is called the effective population size and is denoted by Ne.
30
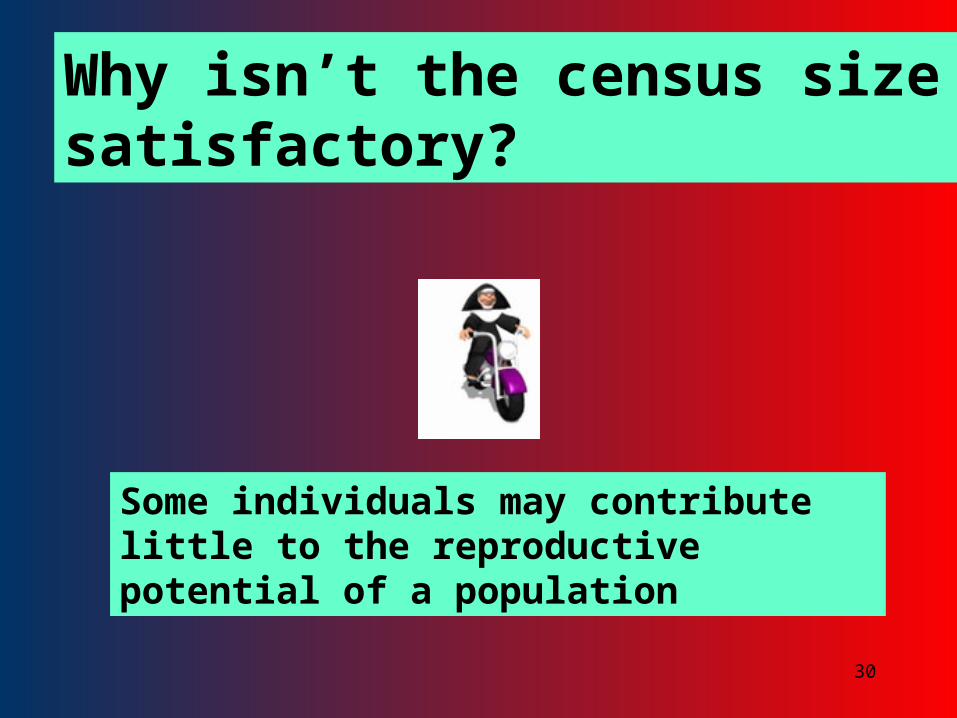
Why isn’t the census size satisfactory?
Some individuals may contribute little to the reproductive potential of a population

31
Sewall Wright (1931) introduced the concept of effective population size, which he rigorously defined as the size of an idealized population that would have the same effect of random sampling on allele frequencies as that of the actual population.

32
In mathematical terms, the mean and variance of the frequency of allele A1 at generation t are given by:
Mean frequency does not change with time.Variance increases with time.
€
p t = p0
€
V(Pt)= p0(1−p0) 1− 1−1
2N⎛ ⎝
⎞ ⎠
t⎡
⎣ ⎢
⎤
⎦ ⎥ ≈p0(1−p0) 1−e−t/(2N)⎡
⎣ ⎤ ⎦
33
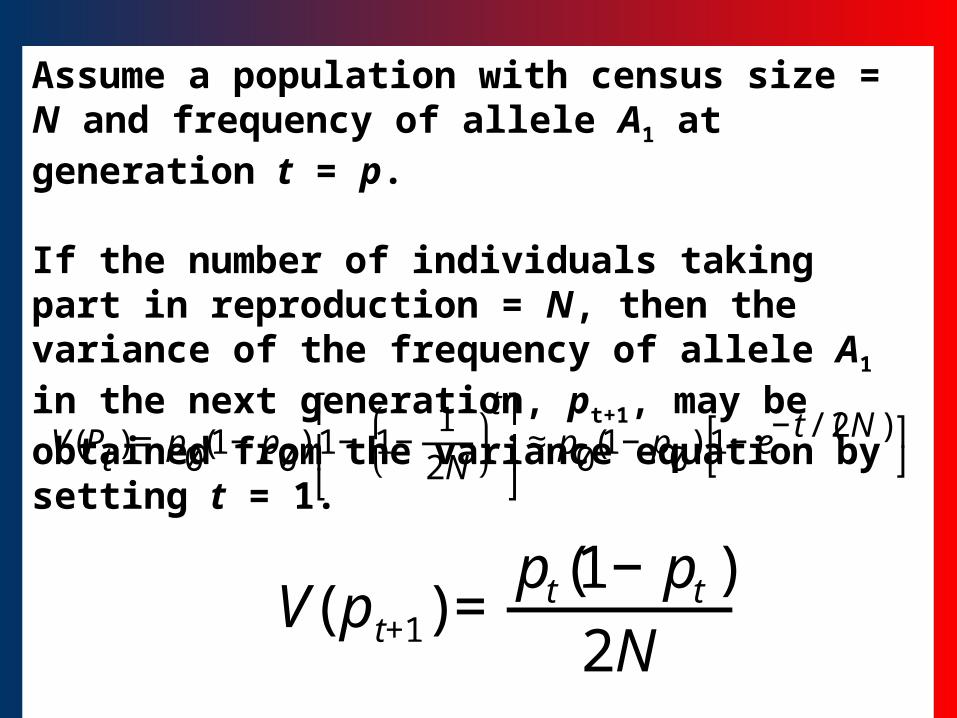
Assume a population with census size = N and frequency of allele A1 at generation t = p.
If the number of individuals taking part in reproduction = N, then the variance of the frequency of allele A1 in the next generation, pt+1, may be obtained from the variance equation by setting t = 1.
€
V(Pt)= p0(1−p0) 1− 1−1
2N⎛ ⎝
⎞ ⎠
t⎡
⎣ ⎢
⎤
⎦ ⎥ ≈p0(1−p0) 1−e−t/(2N)⎡
⎣ ⎤ ⎦
€
V(pt+1)=pt(1−pt)
2N
34
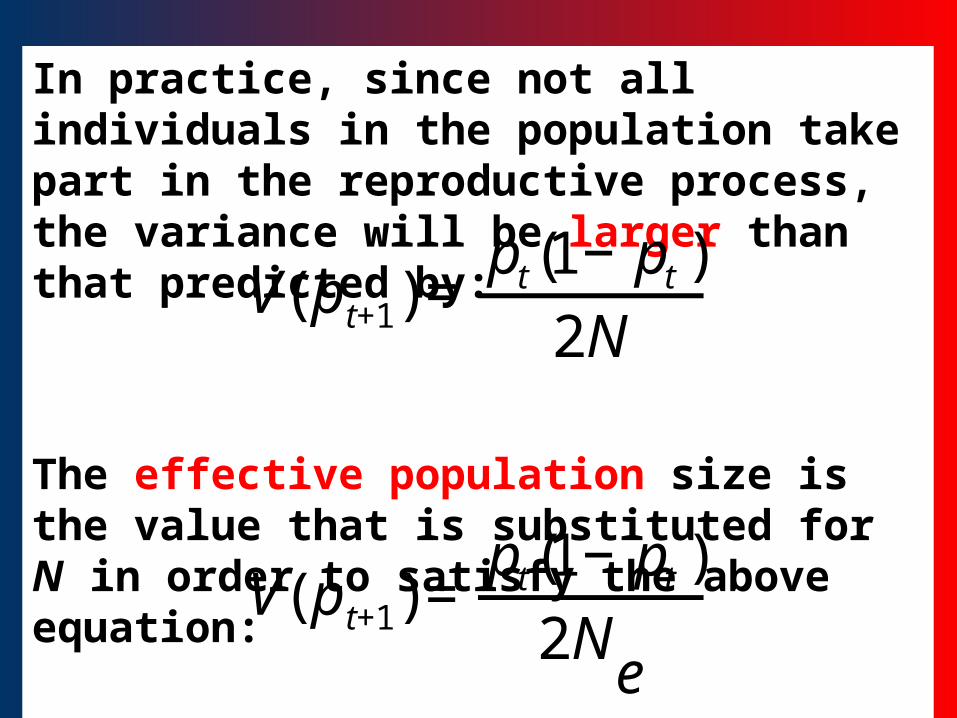
In practice, since not all individuals in the population take part in the reproductive process, the variance will be larger than that predicted by:
The effective population size is the value that is substituted for N in order to satisfy the above equation:
€
V(pt+1)=pt(1−pt)
2N
€
V(pt+1)=pt(1−pt)
2Ne
35
effective population size (Ne)
number of individuals in an ideal populationwhich has the same magnitude of geneticdrift as the actual population.
36
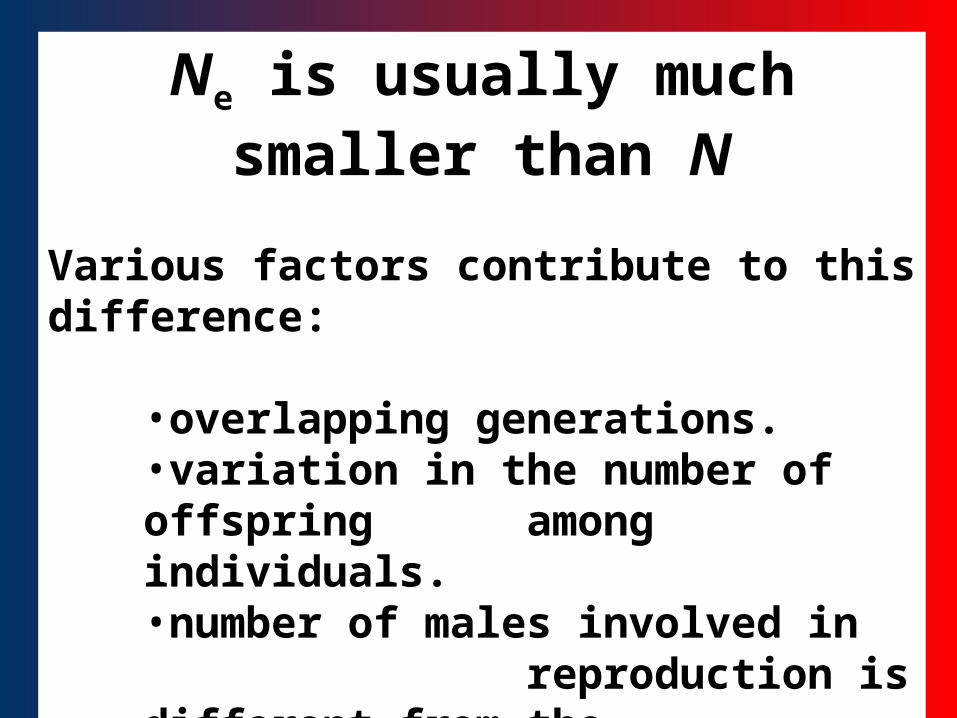
Ne is usually much smaller than N
Various factors contribute to this difference:
•overlapping generations.•variation in the number of offspring among individuals.•number of males involved in
reproduction is different from the number of females. •long-term variations in population size. •bottlenecks

37
Effects of inequality between numbers of males and numbers
of females on effective population size
Examples: •Polygamy: social mammals, territorial birds.•Nonreproductive castes: social bees, ants, termites, naked mole rats.
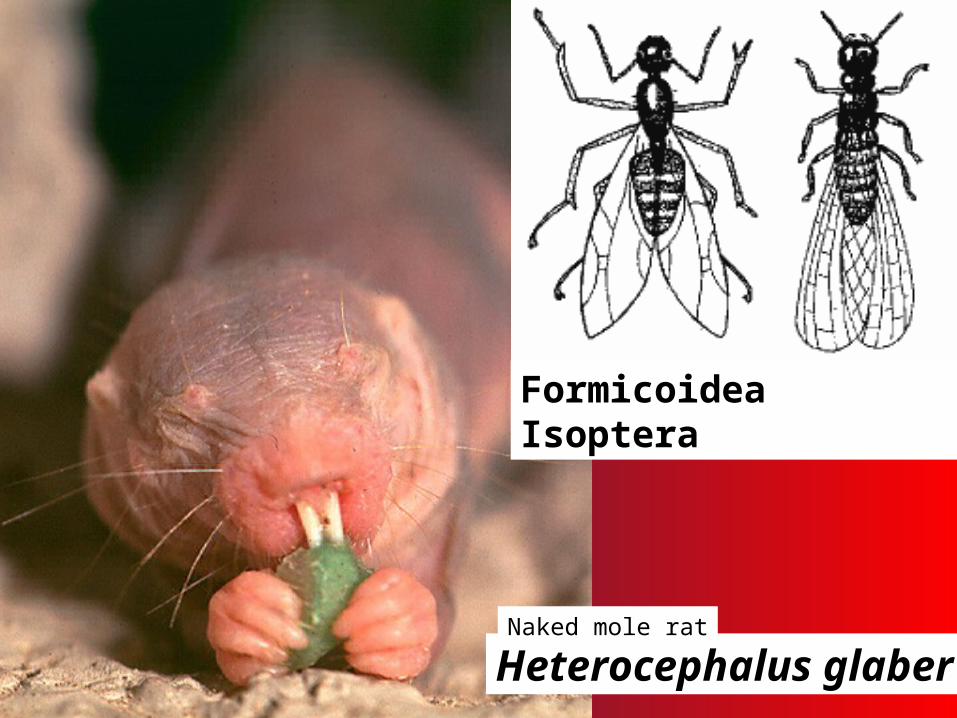
38Heterocephalus glaber
Formicoidea Isoptera
Naked mole rat
39
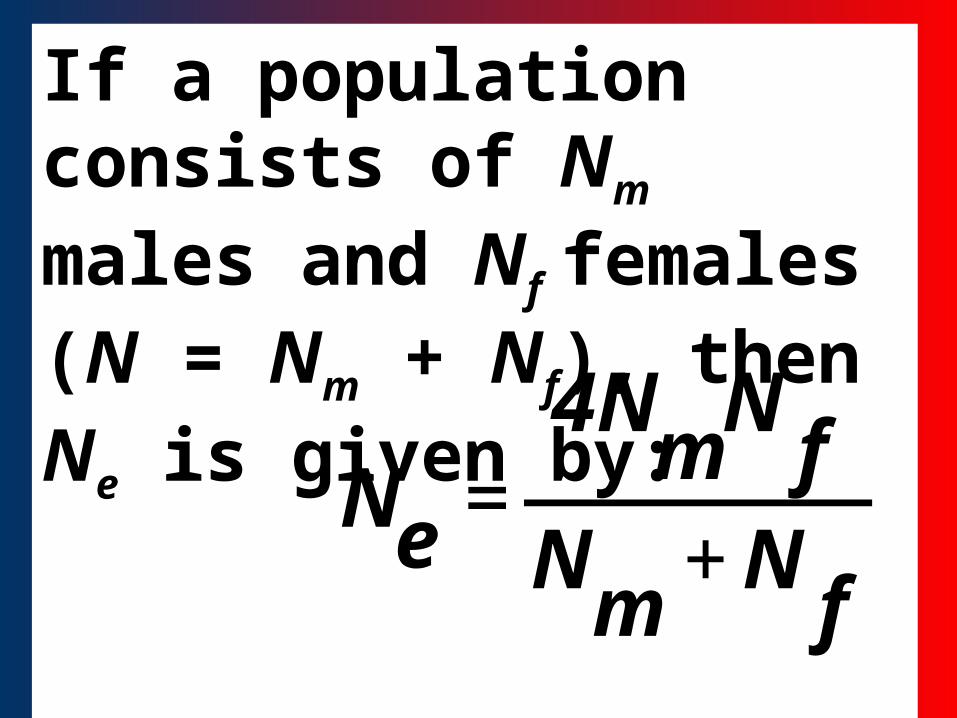
If a population consists of Nm males and Nf females (N = Nm + Nf), then Ne is given by:
€
Ne=4N
mN
fN
m+N
f

40
What is the effective population size of a honeybee hive?
€
Ne=4N
mN
fN
m+N
fN N ≈ 100,000≈ 100,000
NNff = 1= 1 NNmm >> 1 >> 1NNe e = 4= 4
41
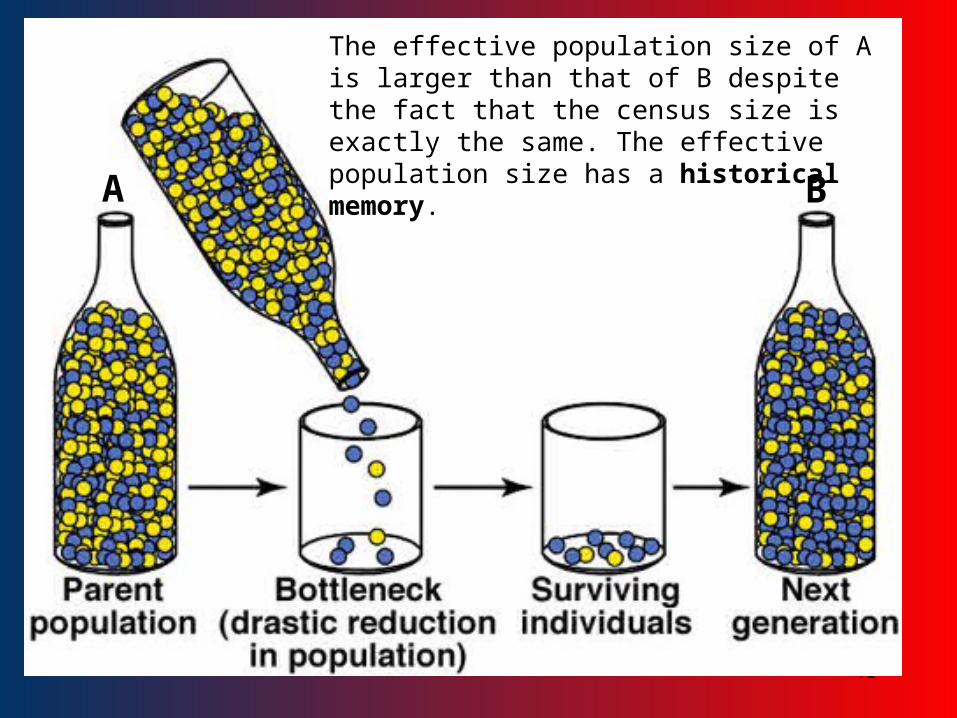
A B
The effective population size of A is larger than that of B despite the fact that the census size is exactly the same. The effective population size has a historical memory.

42
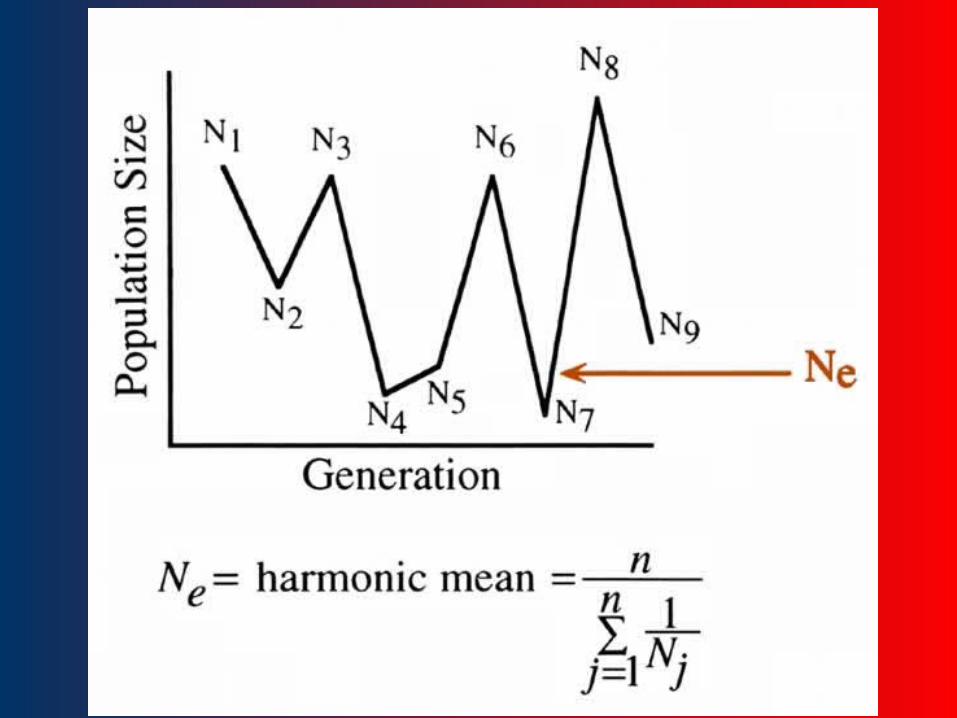
If a population goes through a bottleneck, the long-term effective population size is greatly reduced even if the population has long regained its pre-bottleneck census size.

43
Long-term (~2 million years) effective population size
Ne = 10,000
HistoricalHistoricalhumanhumanpopulationpopulationsizessizes