1 recent experimental results on hl-2a hl-2a team presented by x.t. ding southwestern institute of...
TRANSCRIPT

1
Recent Experimental Results on
HL-2A HL-2A Team presented by X.T. Ding
Southwestern Institute of Physics, Chengdu, ChinaIn collaboration withUSTC, ASIPP,…ChinaCEA-IRFM, FranceIPP, Germany University of California at San Diego, USANIFS, JAEA, Kyoto University,…Japan NFRI, WCI Center for Fusion Theory, KoreaIPR, India
Gullin China2011.11.1
SWIP8th General Scientific Assembly of the Asia Plasma and Fusion Association in 2011
APFA2011Southwestern Institute of physics, Chengdu, Sichuan, 610041E-mail:[email protected]

2
Outline
Status of the HL-2A TokamakResent Experiments on HL-2A
Summary & Next plan
Progress of H-mode studyH-mode with high power ECRHELMy mitigation with SMBI/CJIELMy free/Q H-mode observationPlasma tansport studyParticle transport during high power ECRHNew non –local phenomena Edge turbulens studyZF/GAM during ECRHProfile of the ZF/GAM intensity
3
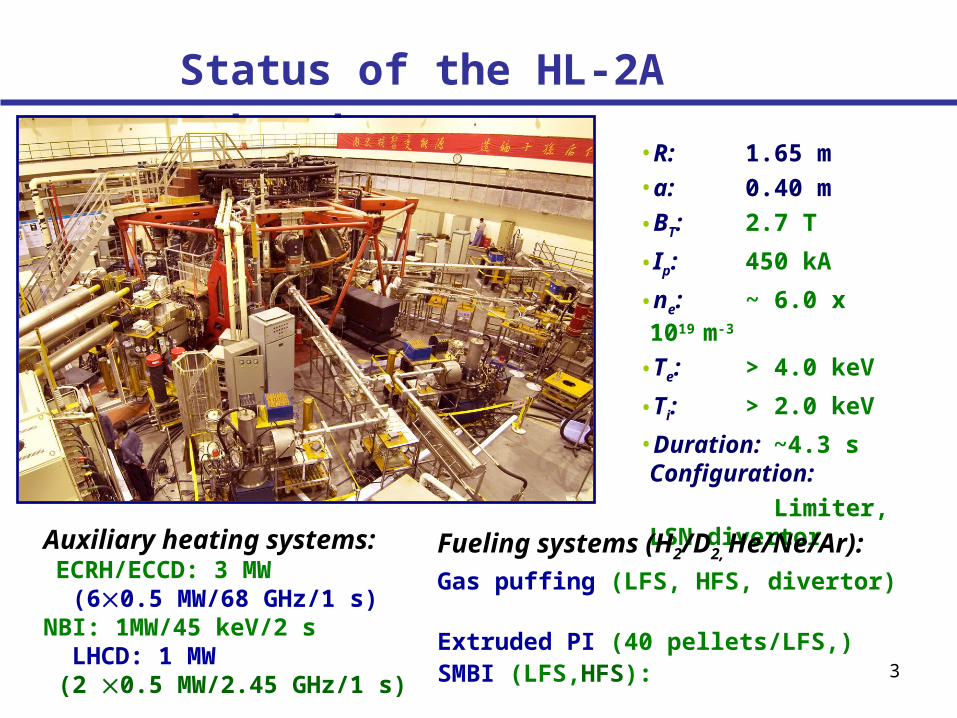
Status of the HL-2A Tokamak
•R: 1.65 m
•a: 0.40 m
•BT: 2.7 T
•Ip: 450 kA
•ne: ~ 6.0 x 10¹⁹ m-3
•Te: > 4.0 keV
•Ti: > 2.0 keV
•Duration: ~4.3 s Configuration:
Limiter, LSN divertor
Auxiliary heating systems: ECRH/ECCD: 3 MW (60.5 MW/68 GHz/1 s)NBI: 1MW/45 keV/2 s LHCD: 1 MW (2 0.5 MW/2.45 GHz/1 s)
Fueling systems (H2/D2, He/Ne/Ar):
Gas puffing (LFS, HFS, divertor) Extruded PI (40 pellets/LFS,) SMBI (LFS,HFS):

4
5#
3#4#
6#
2#
1#
ECW injected into the HL-2A from low field side 6 sets of gyrotrons (4/68GHz/500kW/1s and
2/68GHz/500kW/1.5 s )Modulation: frequency is 10~50 Hz; duty cycle is
10~100 %
Heating system on HL-2A
Antenna for four wave beamsA fixed focusing mirror;

5SMBI systems on HL-2A
1.0
1.5
2.0
n e ( 1
019
m-3
)
400 500 600 700 800 9000.5
1.0
1.5
time (ms)
n e (10
19 m
-3)
w/o ECRH
w/ ECRH
(a)
(b)
ne=0.63 n
e=0.76
ne=0.60
ne=0.30
LFS SMBIHFS SMBI
LFS SMBIHFS SMBI PECRH
=1.3MW
The HFS fuelling efficiency is higher than LFSThe penetration depth of the CJI is deeper than SMBI
Fueling system on HL-2A
Fueling systems :Gas puffing (LFS, HFS, divertor) SMBI/CJI (LFS,HFS):Extruded PI (40 pellets/LFS)

6
Status of the HL-2A Resent Experiments on HL-2A
Summary & Next plan
Progress of H-mode studyH-mode with high power ECRHELMy mitigation with SMBI/CJIELMy free/Q H-mode observationPlasma tansport studyParticle transport during high power ECRHNon –local phenomena Edge turbulens studyResults for zonal flowsResults for blobs
SWIP APFA2011

7
The Operation range of H-modeParameter range BT: 1.2-2.7 T Ip: 130_350 kA Ne: 1.5-3.5 x 10¹⁹ m-3
WE:> 80kJ
Time(ms)
WE(kJ)
Ip(kA)
ECRH
Te(a.u.) From ECE
Ne (19E19m-3)
Ha (edge)
Ha (div)
NBI
680 682 684 686 688 69025
26
27
time(ms)680 682 684 686 688 690
0
0.8
1.6
600 610 620 630 640 65027
31
35
time(ms)600 610 620 630 640 650
0
1.2
2.4
D-divWE(kJ) #11616
D-divWE(kJ) #13723
H-mode with high power ECRH

8
H-mode with type-I ELMs
0.2
1.9
D-d
iv
27.5
33.4
Wdia(k
J)
177
181
Ip(k
A)
1.4
1.7
n e(E
13
)
Ne
1(a
u)
600 610 620 630 640 650
EC
E 14(a
u)
time(ms)
shot 13723
r/a~0.6
r/a~0.8
Some large ELMs have periods of 10-30 ms with energy loss more than 10 %
large ELMs have obvious perturbation to plasma current, Te and ne at plasma edge as well
(a)
(b)
(c)
The Spectrogram of the ELM precursors from magnetic probe (LFS) and soft-X ray (edge channel). The divertor Dα indicates the onset of ELM.

9
400 500 600 700 800 900
2.5
3
3.5
n e (1019 m
-3)
400 500 600 700 800 900
0.40.60.8
11.2
N
400 500 600 700 800 9000
1
P(M
W)
400 500 600 700 800 9000
2
4
D
400 500 600 700 800 900
-1
0
1
Time (ms)
Mirnov
ECRH
NBI
Ip=300kA,Bt=2.4T, ne~3×10¹⁹m-3
PECRH~1.5MW, PNBI~0.8MWβN (onset) ~0.7
3/2 NTM during ELMy H-mode3/2 NTM during ELMy H-mode
m/n=3/2 survives
m/n=2/1 is suppressed
10
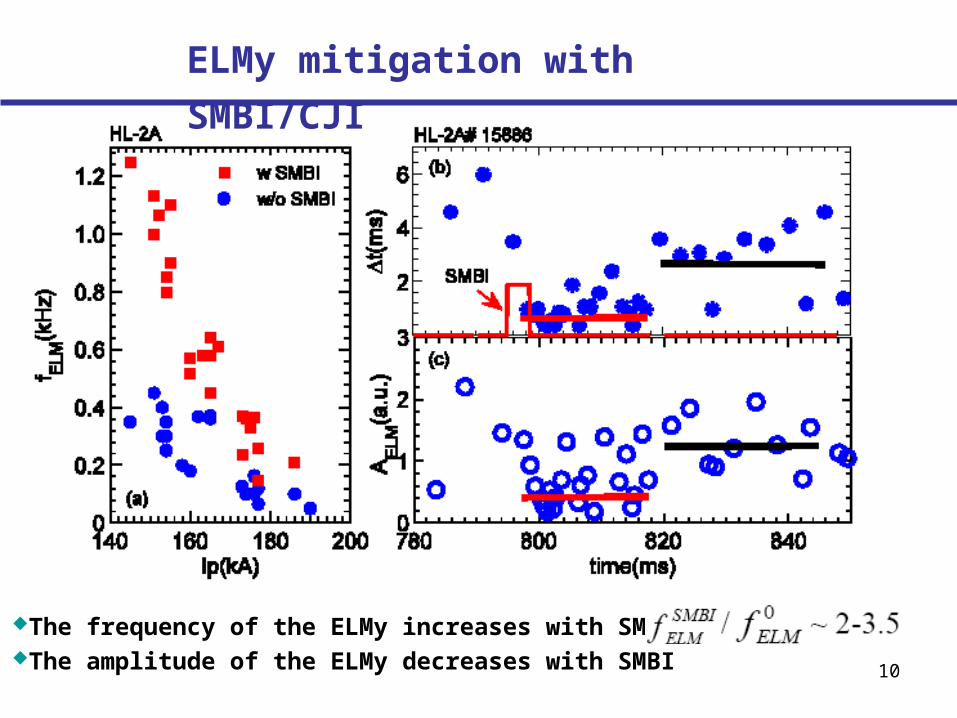
ELMy mitigation with SMBI/CJI
The frequency of the ELMy increases with SMBIThe amplitude of the ELMy decreases with SMBI

11
Density gradient of the
pedestal is decrease
after SMBIThe frequency of the
ELM depends on pulse
wide and gas presure of
the SMBICompare to the
general gas puffing, the
recycling is improved
ELMy mitigation with SMBI/CJI

12
Observation of ELMy free/QH-mode
After asmall disruotion,The stored energy of the plasma increase about two timesThe temperature and density increase,Da decrease both in diaverter and at the plasma edge.
We
Ip
Da
ECRH
NBI
Te(core)
Te(edge)
Ne

13
28 30 32 34 36 38
0.8
1
1.2
1.4
1.6
1.8
r (cm)
ne (
×1
01
9 m
-3)
# 15620450 ms510 ms520 ms530 ms
AMReflectometry
The density profiles during forming of the pedestal measured by microwave reflectometry
Signals of the Mirnov coils and soft x ray.m/n=3/1 EHO??
Observation of ELMy free/QH-mode
m/n=3/2
m/n=2/1
m/n=3/1

14
Observation of ELMy free/QH-mode
2
2/36
2/17
2/3
*
/
ln103
)(1033.1)/(
*
ee
evee
ethe
the
ee
Tn
Ra
Tnv
keVTsmv
v
qR

15
Status of the HL-2A Resent Experiments on HL-2A
Summary & Next plan
Progress of H-mode studyH-mode with high power ECRHELMy mitigation with SMBI/CJIELMy free/Q H-mode observationPlasma tansport studyParticle transport during high power ECRHNon –local phenomena Edge turbulens studyResults for zonal flowsResults for blobs
SWIP APFA2011

16
Particle transport during ECRH
The particle transport studied with modulated ECRHThe particle transport is difference in divertor and limit configuration

17
Out-gassingPump-out
D= 1.5m2/sV= -10m/s
Out-gassing(Outward)
D= 0.4m2/sV= -4m/s
Pu
mp
-ou
t
a=37 cm
D= 0.8m2/sV= 15m/s
Out-gassing (Inward)
The pump out is dominated in the divetor configuration
The out gassing is dominated in the limit configuration
Zou Xiaolan, et.al. 23rd FEC, EXC/P8-14
Particle transport during ECRH

18
0
0.5
1
1.5
Te(e
V)
350 400 450 500 550 600 6500
0.5
1
1.5
n e(10
19m
-3)
t(ms)
ECRH
r=-24.2cm
#13593
I II
sawtooth
r=-17.0cm
r=-9.0cm
r=-0.1cm
H.J.Sun tobe published to Nuclear Fusuion
Z.B. Shi, 23rd FEC, EXC/P8-14
The sustained time of the non local phenomena with continue SMBI is about 5 times of the confinement time (>100ms)
The non local phenomena have been observed after switch-off the far off-axis ECRH
Non –local phenomena

19
Non –local phenomena
100
101
102
10-1
100
101
f(kHz)
P(a.
u.)
380ms480ms540ms
#13593
afterECRH
ECRHbeforeECRH
MR measurements show:The turburlence decrease after ECRH switch off;
The low freguency spectra and the poloidal corelation increase ;
Transport decreases
0
20
40
60
80
550 560 570 580 590 600 610
(m
s)
t(ms)
#14251
ECRH

20
Status of the HL-2A Resent Experiments on HL-2A
Summary & Next plan
Progress of H-mode studyH-mode with high power ECRHELMy mitigation with SMBI/CJIELMy free/Q H-mode observationPlasma tansport studyParticle transport during high power ECRHNon –local phenomena Edge turbulence study during ECRHZF/GAM during ECRHProfile of the ZF/GAM intensity
SWIP APFA2011

21
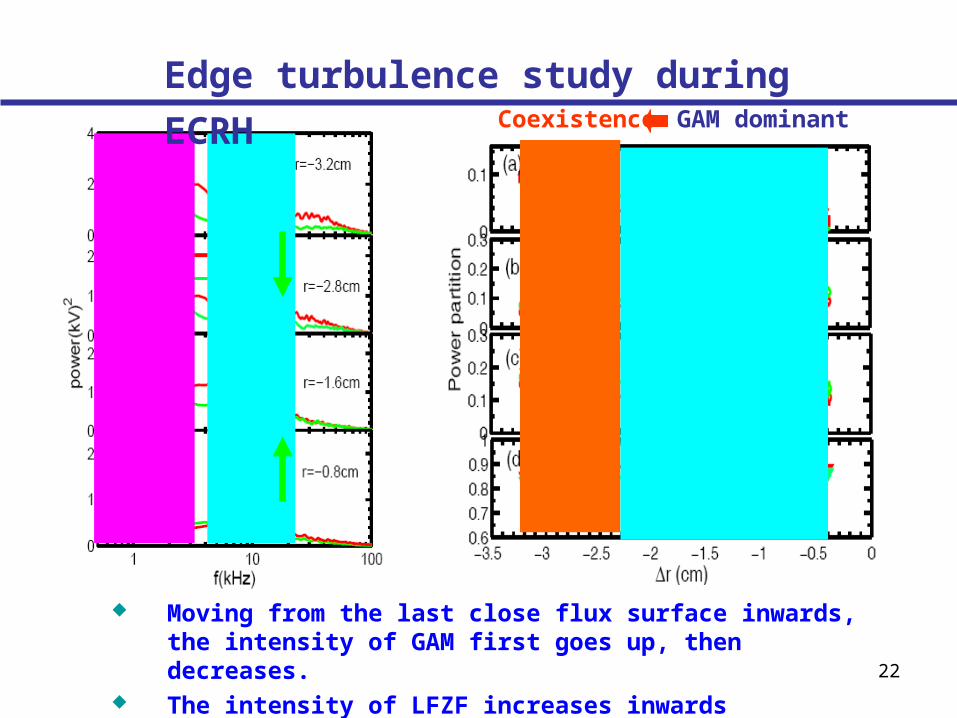
Edge turbulence study during ECRH
1 10 1000
2
4
6
8
pow
er(
a,u
)
f(kHz)
1 10 1000
1
2
3
pow
er(
a,u
)
(a)
(b)
GAM
q=6.2
q=5.2
q=3.5
380kW
680kw
GAM
LFZF
LFZF
The intensities of LFZF and GAM both increase with ECRH power
The intensities of LFZF decrease and GAM increase with the factor q (from 3.5 to 6.2)
K.J. Zhao, 23rd FEC, EXC/7-3 A.D. Liu, PRL. 103 (2009) 095002
22
GAM dominantCoexistence
Moving from the last close flux surface inwards, the intensity of GAM first goes up, then decreases.
The intensity of LFZF increases inwards
Edge turbulence study during ECRH
23
Summary
H-mode operate in high parameter ranges with high power ECRH
and NBI. The plasma stored energy larger than 80kJ. During the
H-mode, the type-I ELMs and NTM can be observed The obvious ELMy mitigation has been achieved by means of
SMBI/CJI. ELMy free or QH-mode can be observed after a small disruption.
The temperature increase greatly. During the ECRH, the particle transport is difference in diavetor
and limit configuration. The pump out is dominated in the
diavetor configuration. The sustained time of the non local phenomena with continue
SMBI is about 5 times of the confinement time (>100ms)

24
Summary
The non local phenomena have been observed after switch-off
the far off-axis ECRH. The turbulence decrease after ECRH
switch off, The low frequency spectra and the poloidal
corelation increase.
The LFZF and GAM power tends to coexist in the inner region
and GAM dominates near the LCFS.
The intensities of LFZF and GAM both increase with ECRH
power. The intensities of LFZF decrease and GAM increase with
the factor q (from 3.5 to 6.2)

25
Next plans
To develop a new NBI system with 2MW;
To develop 140GHz ECRH/ECCD system with 2MW
power;
To develop 3.7GHz LHCD system with 2MW power;
To design the RMP coils for ELMs control;
To develop new diagnostics for current profile
measurement (MSE, Faraday rotation) and plasma
rotation (CXRS).

26
Thank you for your attention
SWIP APFA2011