1 regression analysis modeling relationships. 2 regression analysis regression analysis is a study...
TRANSCRIPT
1
Regression Analysis
Modeling Relationships
2
Regression Analysis
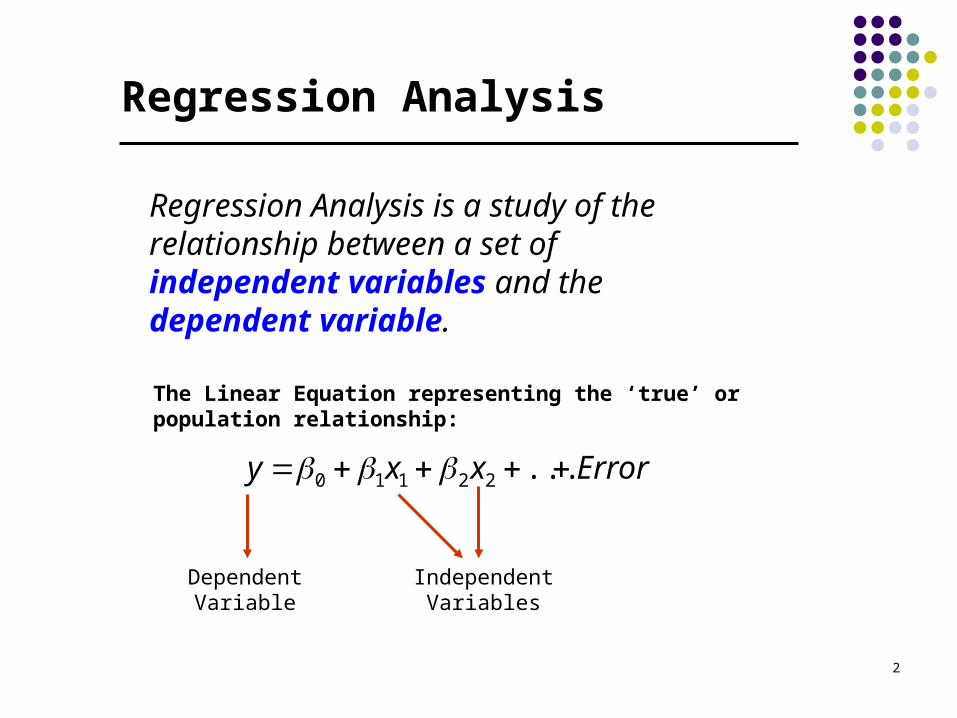
Regression Analysis is a study of the relationship between a set of independent variables and the dependent variable.
Errorxxy ...22110
DependentVariable
IndependentVariables
The Linear Equation representing the ‘true’ or population relationship:
3
Variables
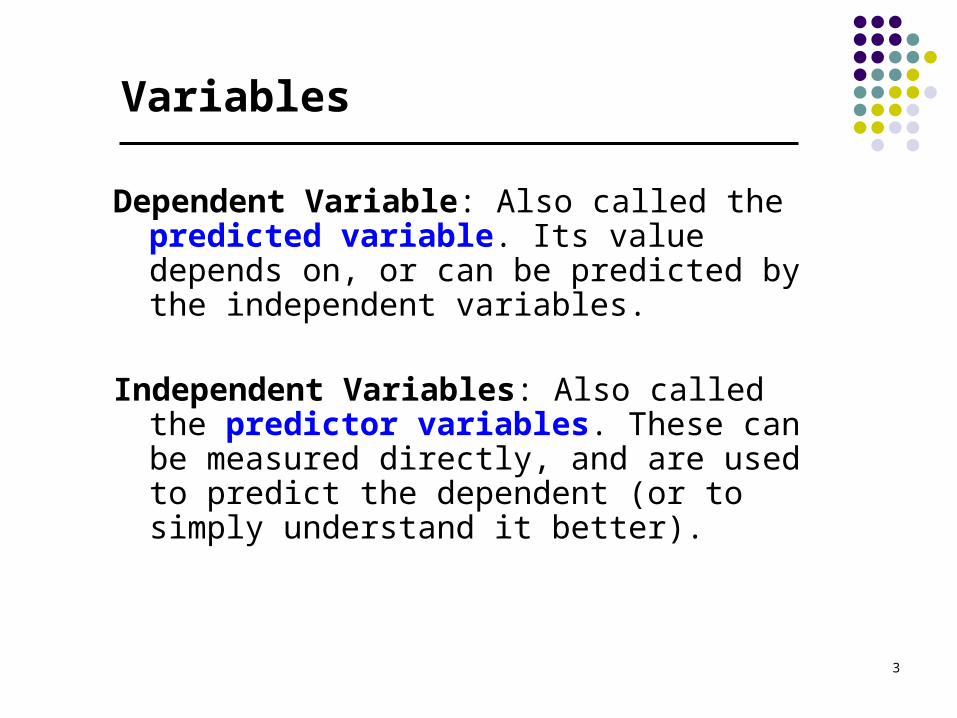
Dependent Variable: Also called the predicted variable. Its value depends on, or can be predicted by the independent variables.
Independent Variables: Also called the predictor variables. These can be measured directly, and are used to predict the dependent (or to simply understand it better).

4
Modeling Process
Define Goal To study the impact of various factors on individual health
Choose y Lung Capacity, measured in cc.
List possible Xs Minutes of Exercise per day, # of days/week of exercise, ethnicity, gender, age, height, altitude at which lived.
Collect Data Primary, Secondary sources
Preliminary Analyses Univariate, bivariate
Build Regression Model How is y related to all the Xs?
Evaluate Model How good is the model at predicting y?
Implement/Monitor Create DSS, monitor, update
5
The Data
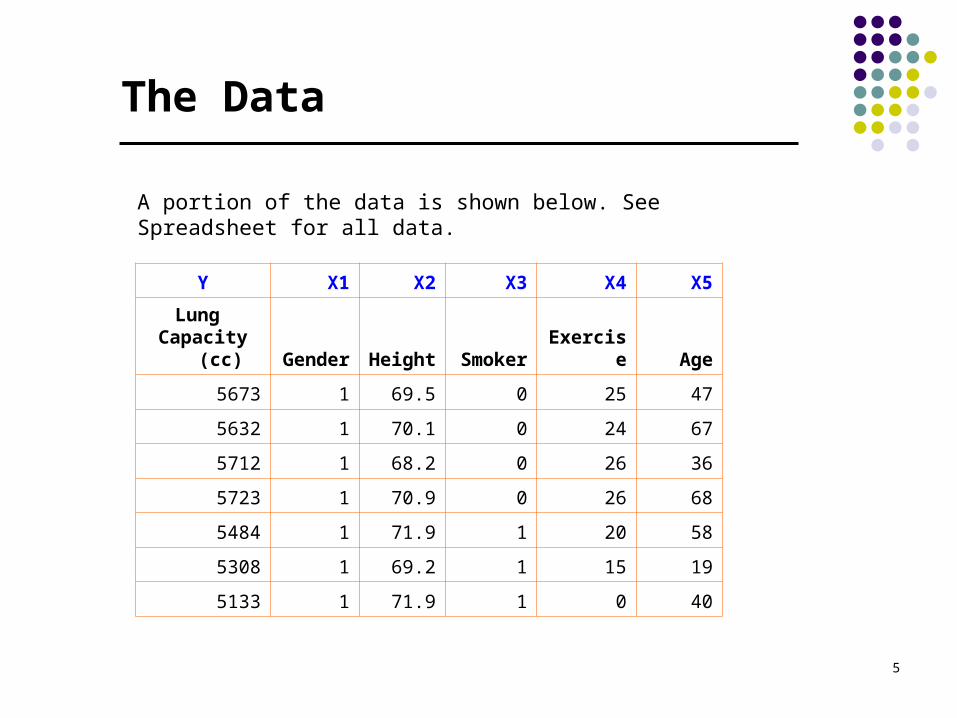
Y X1 X2 X3 X4 X5
Lung Capacity
(cc) Gender Height Smoker Exercise Age
5673 1 69.5 0 25 47
5632 1 70.1 0 24 67
5712 1 68.2 0 26 36
5723 1 70.9 0 26 68
5484 1 71.9 1 20 58
5308 1 69.2 1 15 19
5133 1 71.9 1 0 40
A portion of the data is shown below. See Spreadsheet for all data.
6
Preliminary Analyses
Lung Capacity
(cc) Gender Height Smoker Exercise Age
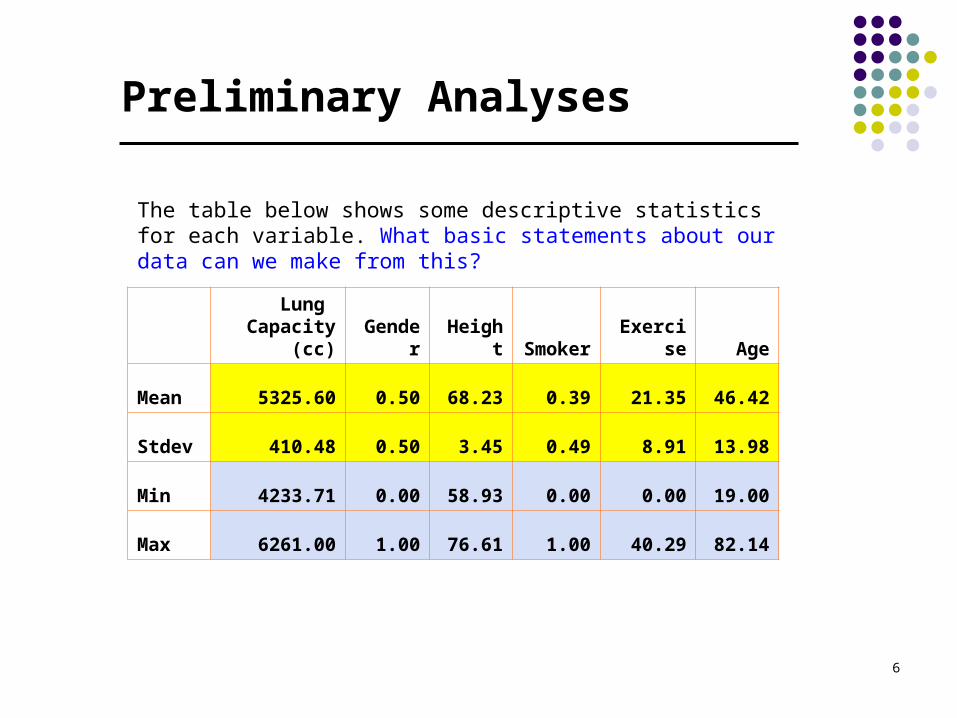
Mean 5325.60 0.50 68.23 0.39 21.35 46.42
Stdev 410.48 0.50 3.45 0.49 8.91 13.98
Min 4233.71 0.00 58.93 0.00 0.00 19.00
Max 6261.00 1.00 76.61 1.00 40.29 82.14
The table below shows some descriptive statistics for each variable. What basic statements about our data can we make from this?

7
Capacity by Gender, Smoking
Gender
Smoker Data Female MaleGrand
Total
Non-Smoker Average of Lung Capacity (cc)5427.6
75662.2
2 5546.87
StdDev of Lung Capacity (cc) 256.41 284.71 293.75
Count of Smoker 30.00 31.00 61.00
Smoker Average of Lung Capacity (cc)4837.4
55129.0
5 4979.51
StdDev of Lung Capacity (cc) 273.74 297.51 318.12
Count of Smoker 20.00 19.00 39.00
Total Average of Lung Capacity (cc)5191.5
85459.6
1 5325.60
Total StdDev of Lung Capacity (cc) 391.51 387.93 410.48
Total Count of Smoker 50.00 50.00 100.00Does there appear to be a relationship between, Smoking, Gender, and Lung Capacity?
8
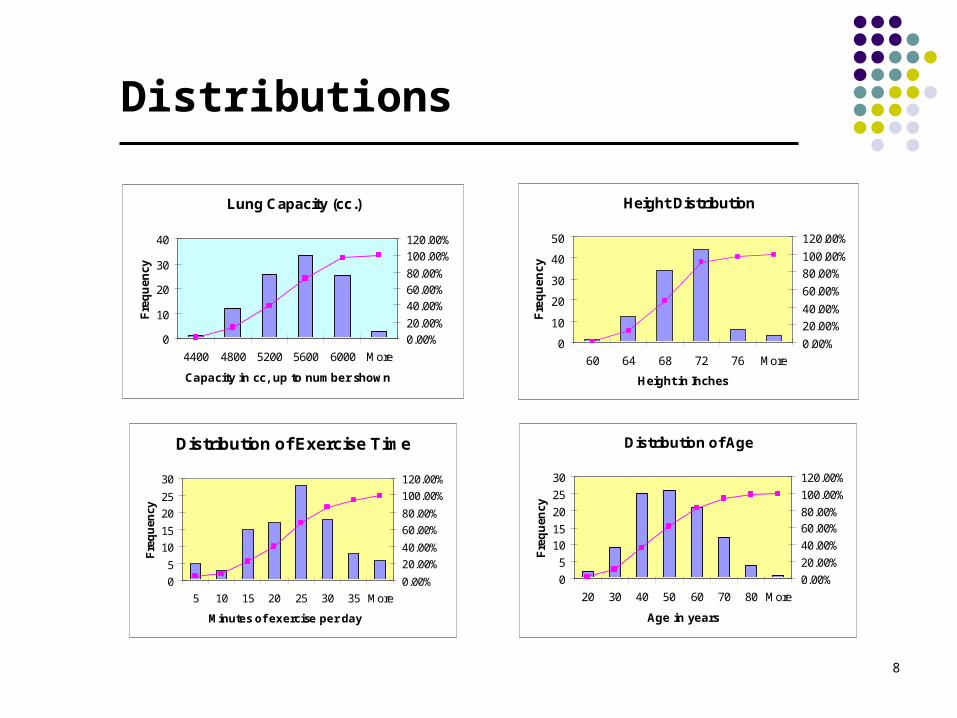
Distributions
Lung Capacity (cc.)
0
10
20
30
40
4400 4800 5200 5600 6000 More
Capacity in cc, up to number shown
Fre
qu
ency
0.00%20.00%
40.00%60.00%80.00%
100.00%120.00%
Height Distribution
0
10
20
30
40
50
60 64 68 72 76 More
Height in Inches
Fre
qu
en
cy
0.00%
20.00%
40.00%
60.00%
80.00%
100.00%
120.00%
Distribution of Exercise Time
0
5
10
15
20
25
30
5 10 15 20 25 30 35 More
Minutes of exercise per day
Fre
qu
ency
0.00%
20.00%
40.00%
60.00%
80.00%
100.00%
120.00%
Distribution of Age
0
5
1015
20
25
30
20 30 40 50 60 70 80 More
Age in years
Fre
qu
ency
0.00%
20.00%
40.00%
60.00%80.00%
100.00%
120.00%
9
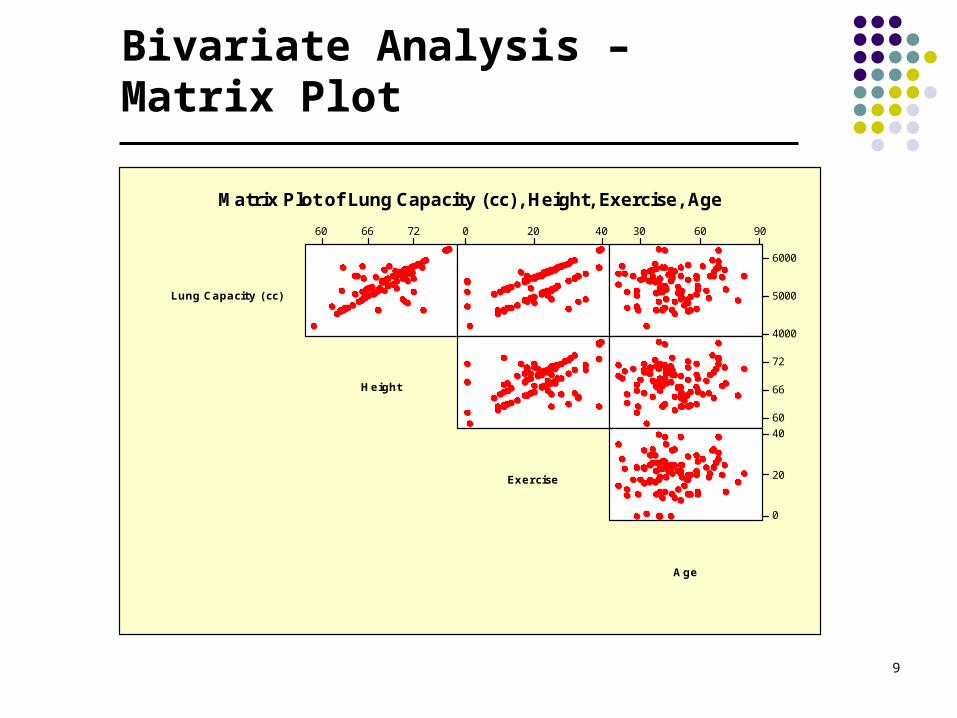
Bivariate Analysis – Matrix Plot
Lung Capacity (cc)
Exercise
Age
Height
726660 40200 906030
6000
5000
4000
72
66
6040
20
0
Matrix Plot of Lung Capacity (cc), Height, Exercise, Age

10
Capacity distribution by Gender, Smoking
Lung Capacity (cc)
Frequency
640060005600520048004400
10
8
6
4
2
0
Mean StDev N5192 391.5 505460 387.9 50
Gender01
Histogram of Lung Capacity (cc)Normal
Lung Capacity (cc)
Frequency
60005600520048004400
18
16
14
12
10
8
6
4
2
0
Mean StDev N5547 293.7 614980 318.1 39
Smoker0
1
Histogram of Lung Capacity (cc)Normal
Men have a larger lung capacity than women, on average.
Non-Smokers have a larger lung capacity than smokers on average. What about the variance?
11
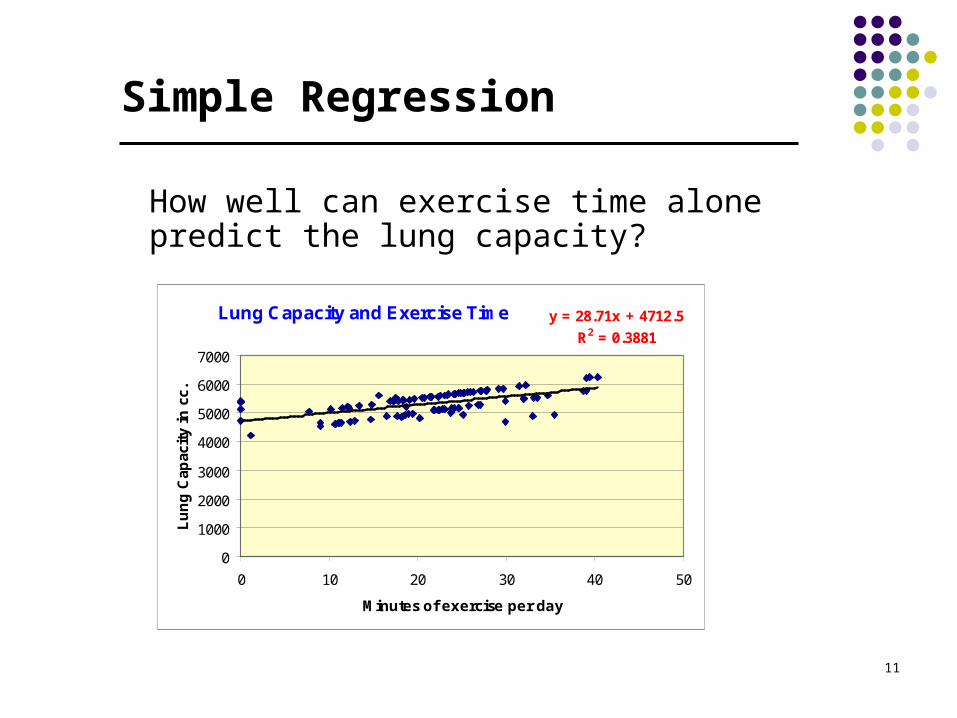
Simple Regression
How well can exercise time alone predict the lung capacity?
Lung Capacity and Exercise Time y = 28.71x + 4712.5
R2 = 0.3881
0
1000
2000
3000
4000
5000
6000
7000
0 10 20 30 40 50
Minutes of exercise per day
Lu
ng
Cap
acit
y in
cc.
12
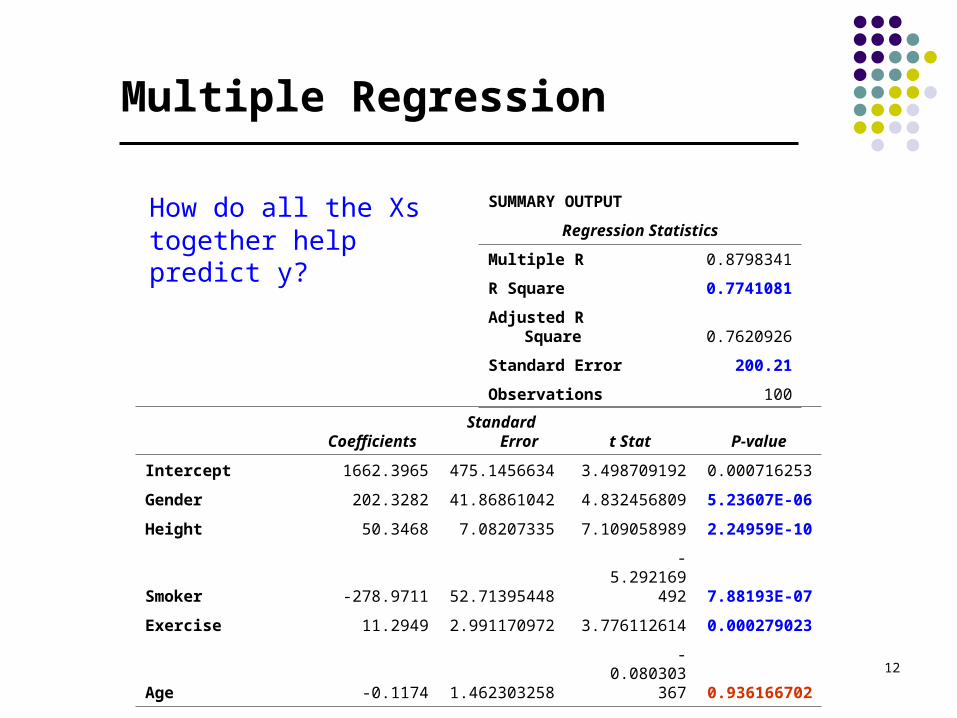
Multiple Regression
How do all the Xs together help predict y?
SUMMARY OUTPUT
Regression Statistics
Multiple R 0.8798341
R Square 0.7741081
Adjusted R Square 0.7620926
Standard Error 200.21
Observations 100
CoefficientsStandard
Error t Stat P-value
Intercept 1662.3965 475.1456634 3.498709192 0.000716253
Gender 202.3282 41.86861042 4.832456809 5.23607E-06
Height 50.3468 7.08207335 7.109058989 2.24959E-10
Smoker -278.9711 52.71395448 -5.292169492 7.88193E-07
Exercise 11.2949 2.991170972 3.776112614 0.000279023
Age -0.1174 1.462303258 -0.080303367 0.936166702

13
Final Model
SUMMARY OUTPUT
Regression Statistics
Multiple R 0.879825
R Square 0.774093
Adjusted R Square 0.764581
Standard Error 199.164
Observations 100
Coefficients Standard Error t Stat P-value
Intercept 1656.937 467.7903 3.54205 0.000617
Gender 202.104 41.55695 4.86332 4.57E-06
Height 50.359 7.043082 7.150271 1.78E-10
Smoker -279.025 52.43341 -5.3215 6.85E-07
Exercise 11.259 2.943494 3.825342 0.000234
y 1656.937 + 202.104 * Gender + 50.359 * Height – 279.025 * Smoker + 11.259 * Exercise
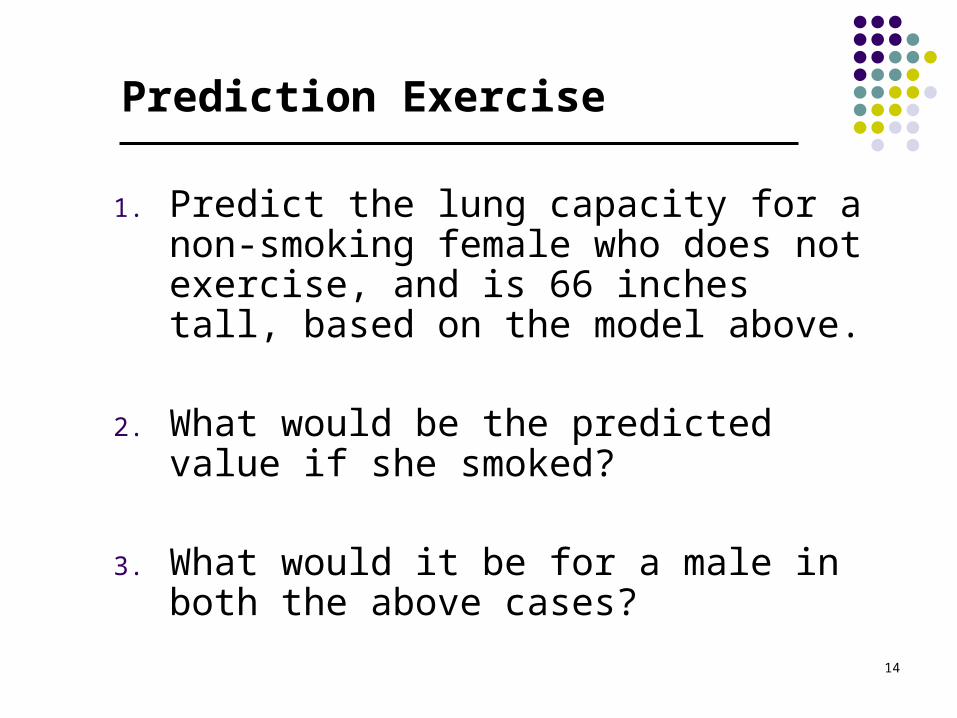
14
Prediction Exercise
1. Predict the lung capacity for a non-smoking female who does not exercise, and is 66 inches tall, based on the model above.
2. What would be the predicted value if she smoked?
3. What would it be for a male in both the above cases?