1 regulation of itam positive receptors: role of il-12 and il - blood
TRANSCRIPT
1
Regulation of ITAM positive receptors: Role of IL-12 and IL-18
John R. Ortaldo, Robin Winkler-Pickett, Jon Wigginton, Meagan Horner, Earl W. Bere,
Anna T. Mason, Narayan Bhat, James Cherry, Michael Sanford, Deborah L. Hodge, and
Howard A. Young
From the Laboratory of Experimental Immunology, and Pediatric Oncology Branch, National
Cancer Institute-Center for Cancer Research, and SAIC Frederick, Frederick, MD 21702-1201
Correspondence should be addressed to Dr. Howard Young, , NCI-CCR, Bldg. 560, Rm. 31-93,
Frederick, MD 21702-1201, (301) 846-1323, Fax: (301) 846-1673, Email: [email protected]
The content of this publication does not necessarily reflect the views or policies of the Department
of Health and Human Services, nor does mention of trade names, commercial products, or
organizations imply endorsement by the U.S. Government.
This research was supported [in part] by the Intramural Research Program of the NIH, National
Cancer Institute, Center for Cancer Research.
Animal care was provided in accordance with the procedures outlined in the “Guide for the Care
and Use of Laboratory Animals” (National Institutes of Health Publication No. 86-23, 1985).
Blood First Edition Paper, prepublished online October 25, 2005; DOI 10.1182/blood-2005-04-1579
Copyright © 2005 American Society of Hematology
For personal use only.on April 11, 2019. by guest www.bloodjournal.orgFrom

2
Author Statement:
Designed experiments, analyzed data, and wrote manuscript: John R. Ortaldo and Howard A.
Young,
Provided new vital reagents: Jon Wigginton,
Performed the research: Robin Winkler-Pickett, Meagan Horner, Earl W. Bere, Anna T. Mason,
Narayan Bhat, James Cherry, Michael Sanford, and Deborah L. Hodge
The publisher or recipient acknowledges the right of the U.S. Government to retain a nonexclusive,
royalty-free license in and to any copyright covering the article.
For personal use only.on April 11, 2019. by guest www.bloodjournal.orgFrom

3
Abstract
Our previous studies have identified mechanisms by which cytokine production,
blocked by Ly49G2 receptor crosslinking, can be overridden. In this manuscript, we have
analyzed the regulation of other ITAM positive receptor signaling on NK, NKT and T cells
and characterized the biochemical pathways involved in this signaling. Our studies
demonstrate that crosslinking of NKG2D and NK1.1 results in a synergistic NK IFN-γ
response when combined with IL-12 or IL-18. Examination of NKT and T cell responses
demonstrated that cross-linking of NKG2D and CD3 resulted in potent synergy when
combined with IL-12, and to a lesser degree with IL-18. We have now found that both the
p38 MAP kinase and the ERK dependent signal transduction pathways are required for the
synergistic response. Further mechanistic examination of the synergy indicated a potent
upregulation of total IFN-γ mRNA in both the nuclear and cytoplasmic compartment but
mRNA half-life was not affected. Fifteen minutes of IL-12 pretreatment was sufficient to
result in maximal synergistic activation indicating that the response of the cells to the IL-12
signal is rapid and immediate. Thus our data demonstrates that multiple convergent signals
maximize the innate immune response by triggering complimentary biochemical signaling
pathways.
For personal use only.on April 11, 2019. by guest www.bloodjournal.orgFrom
4
Introduction
Murine NK cells express multiple Ly49 receptors 1-5 that either inhibit or activate NK cell
functions including cytolysis and cytokine secretion. A functionally similar family of molecules
exists on human NK cells, i.e. the killer cell immunoglobulin-like receptors (KIRs). The inhibitory
Ly49 receptors, (Ly49A, C, G and I), inhibit NK cell function upon binding of class I ligands on
target cells.6-8 These Ly49 inhibitory receptors as well as inhibitory KIRs contain cytoplasmic
immune receptor tyrosine-based inhibitory motifs (ITIMs) that are phosphorylated upon
stimulation, leading to the recruitment of SHP-1 phosphatase and attenuation of intracellular
signals. In contrast, the ITAM associated activating receptors, (e.g. Ly49D and Ly49H), mobilize
intracellular 2+Ca, induce cytokine mRNA and protein production and mediate reverse antibody
dependent cellular cytotoxicity (ADCC) in the presence of specific mAbs.9-12
Circulating NK cells expressing activating Ly49s also express co-receptor paired inhibitory
Ly49s. Thus effector cells that express the activating Ly49D receptor that binds H2-Dd as a ligand,
also co-express, at very high levels, the inhibitory Ly49G2 or Ly49A 13-15 receptors, that also bind
H2-Dd and inhibit the activating function. Based on this co-expression, engagement of activating
Ly49 NK receptors in vivo appears constantly at odds with inhibitory forces. Our previous studies
demonstrated that crosslinking of activating Ly49D murine NK cell receptors can potently
synergize with IL-12 for selective and synergistic production of IFN-γ, both in vitro and in vivo.
Importantly, IL-12 was the key signal needed for over-riding the inhibitory receptor blockade for
cytokine production.
Since there are numerous co-receptor systems in the T cell system that require two signals
to induce sufficient cellular activation, we postulated that other NK cell receptors may require two
positive signals to override the ever vigilant inhibitory receptor blockade. Thus, we sought to
examine a model where the secretory function of activating receptors in addition to the Ly49
For personal use only.on April 11, 2019. by guest www.bloodjournal.orgFrom

5
family, might be triggered by co-receptor function. Furthermore, as reported here, we have now
characterized the biochemical pathways required for the expression of IFN-γ in response to
multiple, yet distinct, extracellular signals.
Materials and Methods
Reagents
Alpha (α) GalCer (KRN7000) was graciously provided by the Kirin Brewery Company, Limited,
Tokyo, Japan. The ceramide reagents were first dissolved in DMSO, then diluted in PBS
containing 0.5% Tween 20. Control diluent or PBS was used as a control for all studies. MAP
kinase inhibitors SB203580 (source) and U0126 (source) were used at a final concentration of
1uM.
Cell lines
The B cell lines (A20 and A20/CD1d generously provided by M. Kronenberg, La Jolla Inst., San
Diego, CA), were pretreated with various reagents for 30 minutes at 37°C, washed and mixed with
sorted populations, and supernatants were collected for analysis after specified culture time.
NK cell isolation
Liver NK cells were isolated from C57BL/6 (B6) mice as previously described.14 Liver
mononuclear cells were used either untreated (15-25% CD3-, NK1.1+) or after in vivo IL-2
treatment (35-70% CD3-, NK1.1+), followed by lineage depletion (with CD3, CD19 and CD24)
(>90% CD3-, NK1.1+) and/or after in vitro expansion with IL-2 (6000 IU/ml recombinant IL-2
(Chiron Corp., ) as previously described.16 In vivo IL-2 treatment was as previously described
using a plasmid containing the murine IL-2 gene.17
For personal use only.on April 11, 2019. by guest www.bloodjournal.orgFrom

6
Antibodies used
The monoclonal antibodies 4E5 (Ly49D), 3D10 (Ly49H), and 3A10 (NKG2D) were
previously described 11 or were provided by Dr. Wayne Yokoyama (Washington University). Rat
IgG (Becton Dickinson/Pharmingen, San Jose, CA) was used as a control for flow cytometric and
functional studies. Rabbit F(ab’)2 anti-rat IgG was used as a crosslinking reagent. CD19 F or APC,
NK1.1-PE or APC, DX-5-PE and CD3,-PercP (Becton Dickinson/Pharmingen, San Jose, CA) as
well as 4E5-FITC were used for flow cytometric analysis.
Flow cytometry analysis (FCA)
Cells were stained as previously described 16 and analyzed on a either as FACSort or a LSR
flow cytometer (Becton Dickinson, San Jose, CA). Cells were directly stained using FITC-,
phycoerythrin (PE-), Per-CP- and APC-labeled primary abs. The BD™ CBA Phospho Flex Set
(Becton Dickinson, San Jose, CA) is a bead-based immunoassay measuring mouse signal regulated
kinases (p38, ERK1/2) was analyzed in denatured cell lysate samples.
Cytokine measurement
Cytokines were measured using IFN-γ and chemokine ELISA kits (R&D Systems,
Minneapolis, MN). Cell stimulations were performed at cell concentrations of 1-5x10⁶ cells/ml.
Antibodies were added at a concentration of 1 :g/106 cells for 30 minutes at 4ΕC. Cells were then
washed and plated on 24-well Costar (Corning, NY) plates that were pre-coated with 2 :g/well
rabbit F(ab’)2 anti-rat IgG and blocked with media containing 10% fetal calf serum. Unless
otherwise stated, samples were collected after 5-6 hours incubation (37°C, 5% CO2) and were
measured in duplicate against the standard curve of the assay and reported as pg/ml. In all assays,
the standard deviation was less than 5 pg/ml.
For personal use only.on April 11, 2019. by guest www.bloodjournal.orgFrom
7
Ribonuclease protection assay
The multiprobe RNAse Protection Assay (RPA) was performed utilizing the mck-1 or mck-
5 template set (Pharmingen, San Diego, CA). Total cellular RNA was extracted utilizing Trizol
(Life Technologies, Gaithersburg, MD) and 1-5 :g of total mRNA was hybridized with a 33-P UTP
labeled RNA probe (1 x 10⁶ cpm/sample) prepared according to the manufacturer's directions
(Pharmingen, La Jolla, CA) using the Pharmingen RiboQuant In Vitro Transcription kit. Following
hybridization, the samples were treated with RNAse A and T1 according to the procedure provided
by Pharmingen. The RNAse was inactivated and precipitated utilizing a master cocktail containing
200 :l Ambion (Austin, TX) RNAse inactivation reagent, 50 :l ethanol, 5 :g yeast tRNA and 1 :l
Ambion GycoBlue co-precipitate per RNA sample. The samples were mixed well, incubated at -
70ΕC for 15 minutes and centrifuged at 14,000 rpm for 15 minutes at room temperature. The
pellets were suspended in 3 :l of Pharmingen sample buffer and subjected to polyacrylamide gel
electrophoresis as recommended by the manufacturer (Pharmingen).
Quantification of variant forms of Nkg2d mRNA
Specific forward and common reverse primers for quantification of short and long forms of Nkg2d
mRNA were designed using Primer Pick 3 program (http://frodo.wi.mit.edu/cgi-
bin/primer3/primer3_www.cgi.) from the published mRNA sequences for the long (Genbank
accession: AF054819) and short form (Genbank accession: AF030313) of Nkg2d mRNA. Nkg2d R
5' ctc gaa caa cga aca ttg ga 3’(R); Nkg2d long form specific L 5’gcattgattcgtgatcgaaa 3’ (L);
Nkg2d short form specific S 5’ acaagaaaca ggatctccct (S) [see supplemental Figure 1 for location of
the primers].
For personal use only.on April 11, 2019. by guest www.bloodjournal.orgFrom
8
Generation of positive controls for real time PCR assays
For isolating the cDNA segment specific for the long form of the Nkg2d mRNA, the previously
published 18 forward primer (P2 primer: 5’caggaagcagaggcagattatctc) was used. Plasmid DNA
containing cDNA segments specific for the long and short form of the Nkg2d mRNA was isolated
as follows. Amplicons were isolated from RNA obtained from either spleen or IL-2 treated spleen.
cDNA were synthesized using the Superscript III kit from Invitrogen following the manufacturer’s
protocol using either oligodT or the Nkg2d R primer listed above. Amplicons were amplified by
PCR using P2/R and S/R primers using Advantage2 polymerase from BD Biosciences. PCR
conditions used were 94ΕC for 2 min, 30 cycles of 94ΕC for 30 seconds, 60ΕC for 30 seconds, and
72ΕC for 60 seconds and a final extension at 72ΕC for 7 minutes. Both cDNA fragments were
cloned into the Topo TA cloning vector (Invitrogen) and the cDNA inserts in the plasmid DNA
were verified by DNA sequencing (data not shown).
Real time PCR assays
For quantification of the variant form of Nkg2d mRNA, plasmid DNA isolated as described above
was used to generate a standard curve. The real-time PCR assays for Nkg2d plasmid DNA or
cDNA were carried out in 10 :l reactions using primers S/R and L/R primers, SYBR Green master
mix (Qiagen Inc.) and run on an ABI 7900 (Applied Biosystems, Inc., Foster City, CA, USA). PCR
conditions used were: 95ΕC for 15 minutes, 40 cycles of 95ΕC for 15 seconds, 60ΕC for 1 minute;
then a dissociation curve: 95ΕC for 15 seconds, 60ΕC for 15 seconds and then a 2% ramp rate to
95ΕC for 15 seconds. The standard, mouse glyceraldehyde-3-phosphate dehydrogenase (Gapd)
plasmid DNA, was purchased from Serologicals (Gaithersburg, MD, USA). The real-time PCR
assays for Gapd plasmid DNA were carried out in 10 :l reactions using the mouse Gapd control kit
For personal use only.on April 11, 2019. by guest www.bloodjournal.orgFrom

9
(Applied Biosystems) and run on an ABI 7900. PCR conditions used were: 95ΕC for 15 minutes,
40 cycles of 95ΕC for 15 seconds, 60ΕC for 1 minute, then a dissociation curve: 95ΕC for 15
seconds, 60ΕC for 15 seconds and then a 2% ramp rate to 95ΕC for 15 seconds. Sensitivity and
linear dynamic range were checked on the serial dilutions (10 to 106 copies/reaction) of Nkg2d
short and long and Gapd plasmid DNA and found to be >.99% efficient with a slope of -3.6. The
Nkg2d short form of mRNA expression was normalized to the Gapd expression in multiplex and
quantified with its own standard curve, >.97% efficiency with a slope of -3Α8. Similarly Nkg2d
long form of mRNA had > .97% efficiency and a slope of -3.5.
Nuclear and cytoplasmic fractionation and RNA isolation
Approximately 5x10⁷ NK cells were pelleted by centrifugation at 1200 rpm in a Sorvall H1000B
rotor, washed once in PBS, resuspended in 3 ml of homogenization buffer (15 mM Hepes, pH 7.4,
0.3 M sucrose, 60 mM KCl, 15 mM NaCl, 2 mM EDTA, 0.5 mM EGTA, 0.15 mM spermine, 0.5
mM spermidine, 1 mM phenylmethylsulfonylfluoride (PMSF) and 0.6% NP40) and lysed by
incubation on ice for 5 minutes. The homogenate was centrifuged at 800 X g for 5 minutes at 4°C.
The resulting pellet was washed twice in 2 ml of nuclei wash buffer (homogenization buffer
without detergent) and centrifuged at 800 X g for 5 minutes at 4°C and used immediately for
nuclear RNA isolation by addition of Trizol to the pellet. Cytoplasmic RNA extraction was
performed following cell lysis and centrifugation by addition of Trizol LS to the supernatant
fraction.
For personal use only.on April 11, 2019. by guest www.bloodjournal.orgFrom

10
Results
ITAM contaning receptor- cytokine synergy
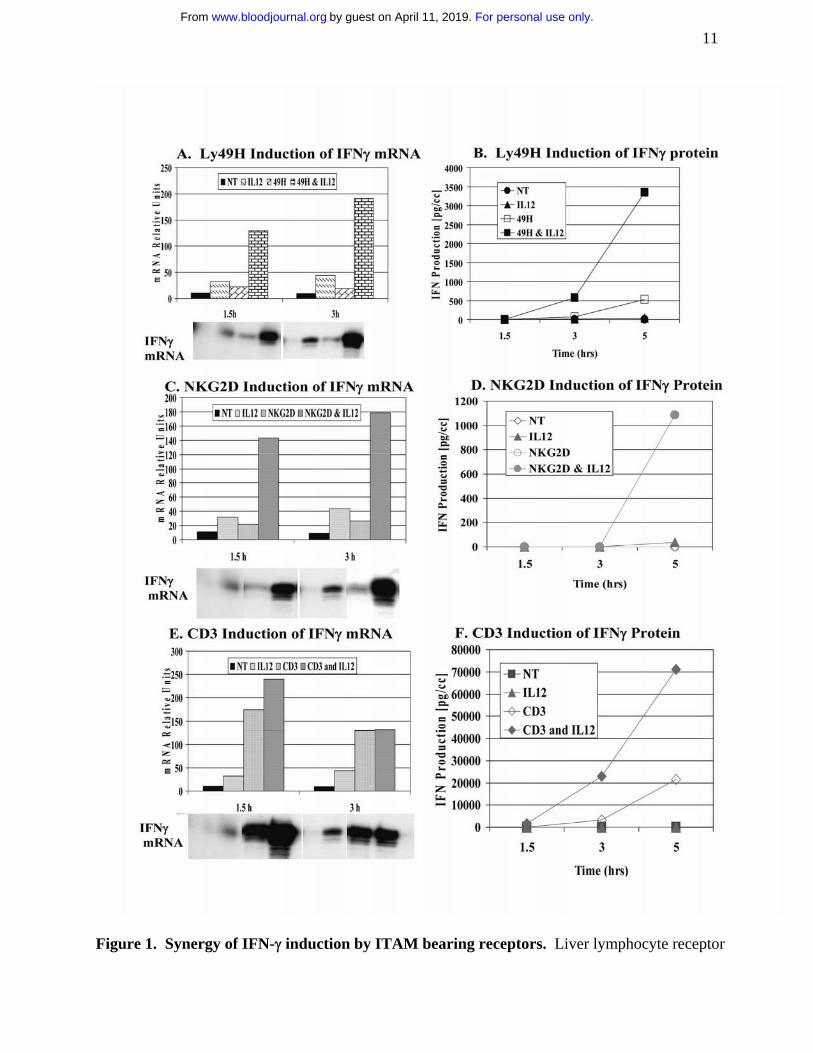
Based on our previous studies, we examined additional ITAM associated receptors present
on NK cells for their ability to synergize with cytokines following ligation. Utilizing both
untreated mouse liver NK cells or purified NK cells (after magnetic depletion of lineage positive
cells), specific receptor ligation was performed with antibodies specific for Ly49H and NKG2D.
Figures 1A and 1B demonstrate a representative experiment examining the mRNA expression and
secretion of IFN-γ, respectively, after crosslinking Ly49H with or without IL-12. Similar to what
has been observed with Ly49D, the DAP associated Ly49H receptor exhibited strong synergy for
IFN-γ mRNA and cytokine production compared to either cytokine or receptor crosslinking alone.
Next we examined the effects of crosslinking the DAP associated NKG2D after crosslinking with
NKG2D specific mAb 3D10 (Figure 1C and 1D). Unlike Ly49D and H, receptor crosslinking
NKG2D alone did not result in significant IFN-γ secretion unless IL-12 was added. Based on these
results, we examined the effects of crosslinking the TcR-associated receptor using the NKT rich
liver leukocytes, since the conical ITAM bearing receptor is CD3. We observed strong synergy for
IFN-γ cytokine production when the receptor was cross-linked in the presence of IL-12 compared
to either cytokine or receptor crosslinking alone (Figure 1E and 1F). Thus, with all classes of
ITAM bearing receptors examined, a potent co-stimulatory signal could be observed with IL-12
(Figure 1) or IL-18 (not shown). Furthermore, crosslinking of NK1.1 (linked to the signaling
chain, FcγR), also demonstrated similar synergy with IL-12 and IL-18 (not shown).
For personal use only.on April 11, 2019. by guest www.bloodjournal.orgFrom
11
Figure 1. Synergy of IFN-γ induction by ITAM bearing receptors. Liver lymphocyte receptor
For personal use only.on April 11, 2019. by guest www.bloodjournal.orgFrom

12
crosslinking was performed with anti-Ly49H (3D10; panel A, B); anti-NKG2D (3A10; panel C,
D); and anti-CD3 (500A2; panel E, F). The IFN-γ mRNA (panels A, C, E) and protein (panels B,
D, F) expression were evaluated at 1.5, 3 and/or 5 hours. RPA evaluation of IFN-γ mRNA was
normalized to control GAPDH. Values are representative of 3 experiments.
In vitro analysis of NKG2D gene expression in spleen and liver NK cells
As the association of the short form of NKG2D with DAP12 is critical for the triggering of
cytokine gene expression, we believe it is important to confirm the presence of sufficient short form
in the NK cells to support our data. Our results indicate that the short form of the Nkg2d mRNA
level increased by 5 and 19 fold in IL-2 treated spleen and liver NK- cells respectively, while the
long form of the Nkg2d mRNA increased by 3 and 10 fold respectively. Since DAP12 associates
with shorter form of Nkg2d, our data support the in vitro data that resting fresh liver NK cells
contain sufficient DAP12 associated NKG2D to exhibit synergy with IL-12 as measured by IFN-γ
production (see Supplemental Data)
Regulatory role of NKRs in cytokine gene expression
Our previous studies 17,19 demonstrated that IFN-γ was predominately induced by IL-12
when Ly49D was co-engaged. In order to examine whether IFN-γ might alter production or co-
stimulation of other cytokines upon NKR ligation, we performed the IL-12 co-stimulation in IFN-γ
deficient mice (GKO). The representative results of several experiments are shown in Figure 2. In
B6 mice, MIP1α and MIP1β were strongly increased by Ly49, NK1.1 and NKG2D crosslinking.
IL-10 mRNA was increased to a lesser degree while IL-13 mRNA was only weakly increased.
When GKO mice were evaluated, a strong TH2 bias was observed. NKRs strongly increased
For personal use only.on April 11, 2019. by guest www.bloodjournal.orgFrom

13
MIP1α and MIP1β, whereas IL-10 and IL-13 had high basal levels of mRNA that were only
modestly increased by NKR ligation (Figure 2, panel A). Co-treatment with IL-12 did not
significantly alter the expression of any of these genes. When cytokine protein levels were
analyzed, the results indicated that IFN-γ does not alter the response of NK cells to receptor
For personal use only.on April 11, 2019. by guest www.bloodjournal.orgFrom

14
For personal use only.on April 11, 2019. by guest www.bloodjournal.orgFrom

15
Figure 2. IL-12 synergy in GKO mice. Lymphocytes were obtained from liver of untreated B6
mice and stimulated with the specific anti-NKRs. Cells were evaluated for IFN-γ mRNA (panel A)
and cytokine production of IL-13 and MIP1α in 3 hour supernatants (panels B-C. Values are
representative of 3 experiments.
crosslinking with respect to other chemokine/cytokine production (Figure 2; panel B&C) in either
the presence or absence of IL-12. Of possible interest is the strong synergy also observed in MIP1a
production when IL-12 is combined with cross-linking NKRs. This was not seen in the GKO
mouse and may indicate a role for IFN-γ in this synergy. This observation awaits further analysis.
Regulatory role of IL-12 in NKT cells
Since the liver is a rich source of NKT cells and our data with anti-CD3 crosslinking
indicated that TcR-ITAM ligation synergizes with IL-12, we examined the response of NKT cells
to co-stimulation. Ligation of the TCR receptor resulted in production of IFN-γ, TNFα, and IL-2
production (Figure 3; panel A). As expected, cytokine stimulation was rapid and direct, with
mRNA increases being observed by 1 hour and maximal by 3 hours followed by rapid protein
expression in culture supernatants. Similar to the NK cells, IL-12 synergy was only seen with
respect to IFN-γ expression (Figure 3, panel B), as TNFα (panel B), and IL-2 (panel C) expression
was not affected by the addition of IL-12 (Figure 3, panels B and D). Identical results were
obtained when primary NKT cells were stimulated with αgalactosyl ceramide (αGalCer) (Figure 3;
panel D) in the presence or absence of IL-12. Thus IL-12 appears to also be a key cytokine for
maximizing the response of NKT cells to cell surface receptor cross-linking.
For personal use only.on April 11, 2019. by guest www.bloodjournal.orgFrom

16
Effects of IL-12 and IL-18 on the synergistic response
To further evaluate the synergistic response, we sought to determine if multiple interactions with
different co-stimulatory cytokines would result in even a greater response to NKR activation.
Therefore, a dosing checkerboard of IL-12 and IL-18 was added to NK cells either pretreated with
Figure 3. IL-12 synergy with TcR on NKT cells. Highly purified NKT cells were sorted from
untreated liver lymphocytes (CD3+, NK1.1+), then expanded for 4-5 days in IL-2. Cells were
evaluated for synergy as described above using anti-CD3. IFN-γ mRNA (panel A) or cytokines
For personal use only.on April 11, 2019. by guest www.bloodjournal.orgFrom

17
TNFα, and IFN-γ (panel B) or IL-2 (panel C) were measured in 1 and 3 hours supernatants,
respectively in panels B-D. Values are representative of 3 experiments. In panel D, liver NKT
cells were obtained from untreated B6 mice and stimulated with the specific ligand αGalCer after
loading into a CD1d positive cell line A20. Cells were evaluated for synergy of cytokine
production with IL-12 and αGalCer at 3 hours. TNFα, IFN-γ or IL-2 was measured in 3 hour
supernatants. Values are representative of 3 experiments.
control IgG or anti-Ly49D (4E5) antibodies. As expected, IL-12 and IL-18 demonstrated potent
co-stimulation without NKR crosslinking for IFN-γ production in NK cells; however when doses of
IL-18 reached 0.1 ng/ml, limiting activation by IL-12 was observed at 1 and 0.1 ng/ml (Table 1 see
IFN-γ production in control IgG). However, when these same sub-optimal co-stimulating doses of
IL-12 and IL-18 were analyzed with NK cells stimulated through the Ly49D NKR, strong, near
maximal IFN-γ production was observed (29,000 and 25,200 pg/ml; bolded values) compared to
the 10 ng treatment results. Thus these physiological levels of IL-12 and IL-18 could sensitize NK
cells to produce a greatly enhanced response to ligation of NKRs.
Receptor crosslinking: Synergy other cytokines
With the recent emergence of other IL-12 family members, we sought to evaluate whether
IL-23 and IL-27 would result in similar co-stimulation as IL-12. Figure 4; panel A depicts a typical
result with these cytokines and crosslinking of Ly49D. Both IL-23 and IL-27 co-stimulated IFN-γ
production upon Ly49D ligation, but they were quantitatively less potent that IL-12. In contrast to
IL-12, the cytokines alone did not result in significant levels of IFN-γ (not shown). In addition, we
For personal use only.on April 11, 2019. by guest www.bloodjournal.orgFrom

18
sought to determine if other cytokines that interacted with NK cells at the time of NKR ligation and
IL-12 interaction might alter subsequent synergy. Therefore, NK cells were pretreated with other
inflammatory cytokines such as IFN-α, IFN-∃, IFN-γ, IL-1, IL-10, IL-13 and TNFα. None of these
cytokines demonstrated a strong and consistent alteration in the ability of IL-12 to synergize with
NKR ligation for the production of IFN-γ (not shown) nor did they synergize with receptor
crosslinking when cytokine expression was analyzed.
For personal use only.on April 11, 2019. by guest www.bloodjournal.orgFrom

19
Figure 4. IL-12, 23, 27 regulation of ITAM receptors. Panel A. IL-23 and IL-27 synergy of
For personal use only.on April 11, 2019. by guest www.bloodjournal.orgFrom

20
IFN-γ induction by NK receptors. Enriched NK cells were evaluated for synergy with media, IL-
12, IL-23 and IL-27 by addition into the assay for 4 hours after pre-coating with anti-Ly49D (4E5).
Values are representative of 3 experiments. Panel B. Reversal of the dominant inhibitory signal
by IL-12. Highly enriched Ly49G2+ NK cells were expanded for 4 days with IL-2 after selection
by antibody coated magnetic beads. Cells were depleted of CD3, CD19 and CD24, then selected
into Ly49G2+ subsets. Cells were >95% Ly49G2+, 52% Ly49D+, 88% NKG2D+ and >95%
NK1.1+. NK cells were pre-coated with NKR antibodies, then crosslinked for 4 hours with or
without IL-12. Values are representative of 2 experiments. Panel C. In vivo evaluation of
NKG2D synergy with IL-12. B6 mice were injected intra-splenically with either Baf3 or Rae/γ
expressing Baf3 cells (5x10⁵ cells). After 15 minutes, mice had their spleens surgically removed.
After 1 hour, mice were injected intra-peritoneally with 10 ng of IL-12 protein and serum was
collected for indicated times to 48 hours. Serum was evaluated for cytokine production using CBA
Th1/Th2 kit (Becton-Dickinson). Values represent mean and standard error (S.E.) with 5 mice per
group.
Inhibitory receptors and IL-12
Our previous studies 17 demonstrated that IL-12 can override the the ability of Ly49G2 to
inhibit Ly49D activator. Since Ly49G2+ NK cells also co-express NKG2D and NK1.1 in addition
to being 50-60% Ly49D+, we examined whether IL-12 could also co-regulate their inhibition. As
shown in Figure 4; panel B, the co-treatment with IL-12 strongly stimulated IFN-γ production
regardless of whether Ly49G2 was co-engaged. The co-engagement of Ly49G2 on cells not
treated with IL-12 demonstrated a 50-70% inhibition of IFN-γ production, regardless of which
activating receptor was crosslinked. Thus, the co-stimulation with IL-12 with activating receptors
For personal use only.on April 11, 2019. by guest www.bloodjournal.orgFrom

21
results in the dimunition of the ability of multiple inhibitory receptors to attenuate the NK cell
cytokine response.
In vivo synergy
In order to determine if the synergy of IL-12 with the NKG2D NKRs examined in this study
occurred in vivo, B6 mice were injected intrasplenically (a route which results in rapid migration of
tumor cells to the liver; a rich environment for NK and NKT cells) with cells that did or did not
express Rae/γ, an NKG2D ligand and then injected with IL-12 protein As shown in Figure 4C,
when either the parent tumor line (Baf3), the Rae/γ expressing Baf3, or IL-12 was injected alone,
less than 10pg/ml of IFN-γ was detected in the serum. However, when Rae/@ expressing Baf3
cells were injected with IL-12, significant levels of IFN-γ were detected at 24 hours. These results
indicate that the in vivo response to the NKG2D receptor-ligand interaction can be significantly
enhanced upon exposure to IL-12.
Role of IL-12 in the synergistic response
The potent synergy that is observed in vitro and in vivo 17 for NKR activation and
production of cytokines suggests an important regulatory role for IL-12 in vivo. Therefore we
evaluated whether pretreatment of NK cells with IL-12 (Figure 5A) or IL-18 (not shown) would
result in subsequent synergy if NKRs were subsequently ligated. Cells were pretreated with IL-12
for 15 to 60 minutes at 37ΕC, stimulated on ice with anti-Ly49D (4E5), then evaluated for co-
stimulation of IFN-γ. As shown in Figure (5A), the pretreatment for as little at 15 minutes resulted
in near maximal production of IFN-γ at 4 hours compared to IL-12 being added during the assay.
Furthermore, the activation of phospho-STAT4 by IL-12 was similar in the presence or absence of
For personal use only.on April 11, 2019. by guest www.bloodjournal.orgFrom

22
cross-linking (not shown). These results suggested that a brief encounter with co-stimulatory
cytokine in vivo is sufficient to result in potent subsequent synergy with NKRs. We next
determined how long the cells retained their sensitivity following IL-12 treatment as cells were
treated with IL-12 for 30 minutes, followed by delayed NKR crosslinking (Figure 5B). The results
demonstrated synergy with IL-12 was still observed even if NKR crosslinking was delayed 2-3
hours. However synergy was lost if crosslinking was delayed for 4-6 hours.
For personal use only.on April 11, 2019. by guest www.bloodjournal.orgFrom

23
Figure 5. Pretreatment with IL-12 and response NKR activation. Panel A. Liver lymphocytes
were obtained from untreated liver cells from B6 mice. Cells were pre-treated with IL-12 at 37ΕC
for specified times. Cells were washed, chilled, then coated with anti-NKRs for 20 minutes. Cells
were then washed and cultured for 4 hours. Control (“In Assay”) had IL-12 added at time of assay
initiation and IL-12 remained in assay for 4 hours. Panel B. Delayed NKR activation. Liver
For personal use only.on April 11, 2019. by guest www.bloodjournal.orgFrom

24
enriched NK cells (>90% NK1.1+) were pretreated at 37ΕC with IL-12, then held for specified
times, where the cells were coated with anti-Ly49D or anti-NKG2D at 4ΕC for 15 minutes, then
washed and cross-linked on plastic dishes coated with anti-rat or anti-hamster secondary antibodies.
Supernatants were collected at 4-5 hours.
We next investigated the role of STAT4 in the synergistic response by comparing the response in
BALB/c WT and STAT4 KO mice using NKRs; NKG2D and Ly49L (Data not shown). All
synergy whether between IL-2 and IL-12 or NKR and IL-12, was ablated in cells from the STAT4
KO mice demonstrating the obligatory role for STAT4 in priming the cells for a maximal response
to NKR cross-linking.
Effects on IFN-γ mRNA
To investigate whether a possible mechanism for the observed synergy was stabilization of the
IFN-γ mRNA, we analyzed mRNA half-life following the treatments alone or in combination
(Figure 6A). With all three treatments (NKR, IL-12 and combination) the half-life of IFN-γ mRNA
was between 1-2 hours indicating that the increased production of IFN-γ was not due to effects on
mRNA stability. Previous studies from our laboratory have demonstrated that IL-12 causes an
accumulation of IFN-γ unprocessed mRNA in the nucleus that is processed and driven out of the
nucleus by co-stimulation with IL-2. Using this model and probes that uniquely recognized
unprocessed mRNA (detecting intron-exon boundries), we examined the effects of co-stimulation
on IFN-γ mRNA processing and cellular compartmentalization. The results (Figure 6B; suppl.
Figure 2) indicated that IL-12 plus Ly49D stimulation resulted in a synergistic increase in
For personal use only.on April 11, 2019. by guest www.bloodjournal.orgFrom

25
cytoplasmic IFN-γ mRNA with a 10-25 fold increase over that observed in untreated cells. The
examination of nuclear RNA indicated that similar and parallel increases in both Exon3-Intron3
and Exon1-Intron1 and Exon3 and Exon1 containing RNAs occurred, demonstrating that IL-12
plus Ly49D treatment increased nuclear accumulation of both unprocessed and processed forms of
For personal use only.on April 11, 2019. by guest www.bloodjournal.orgFrom

26
Figure 6. Evaluation of mRNA for IFN-γ. In panel A IFN-γ message was analyzed. Liver
enriched NK cells (>90% NK1.1+) were coated with anti-Ly49D at 4ΕC for 15 minutes, washed,
then pretreated at 37ΕC with IL-12. Cells were washed and actinomycin D was added and cell
lysates were evaluated for IFN-γ mRNA. Values are expressed relative to mRNA level at 30
minutes prior to actinomycin D addition (100%) and were derived from digital evaluation of RPA
for IFN-γ+ relative to L32 control RNA. Values are representative of 2 experiments.
In panel B, nuclear versus cytoplasmic mRNA for IFNγ was analyzed. NK cells were lysed
and fractionated as described in materials and methods. RPA was performed on nuclear and
cytoplasmic RNAs using [33P]UTP labeled exon 1-intron 1 (E1-I1), exon 3-intron 3 (E3-I3), and
L32 rRNA riboprobes. The exon-intron probes hybridize and protect unspliced nuclear IFN-γ pre-
mRNA whereas the exon portion of the exon-intron probes recognize only the spliced form of the
IFN-γ mRNA in both the nucleus and cytoplasm. L32 was used as a control for RNA input
between samples. (Results from a representative RPA are shown in supplemental Figure 2.) Lanes
from left to right represent the following: nontreated (NT), LY49D crosslinked (49D), IL-12
activated (IL-12), and LY49D plus IL-12 (D/12) co-activated NK cells. Graphical representation
of the quantitation performed by ImageQuaNT analysis on the image shown in Figure 6B. The
normalized mRNA values correspond to the accumulation of exon-intron and exon only IFN-γ
mRNA relative to L32 mRNA in the nuclear (top) and cytoplasmic (bottom) compartments.
the IFN-γ mRNA. Additionally, nucleocytoplasmic transport of the IFN-γ mRNA was not altered
as similar increases in both nuclear and cytoplasmic accumulation of IFN-γ mRNA was observed
following IL-12 plus Ly49D treatment.
For personal use only.on April 11, 2019. by guest www.bloodjournal.orgFrom

27
Analysis of the biochemical pathways involved in the synergistic response
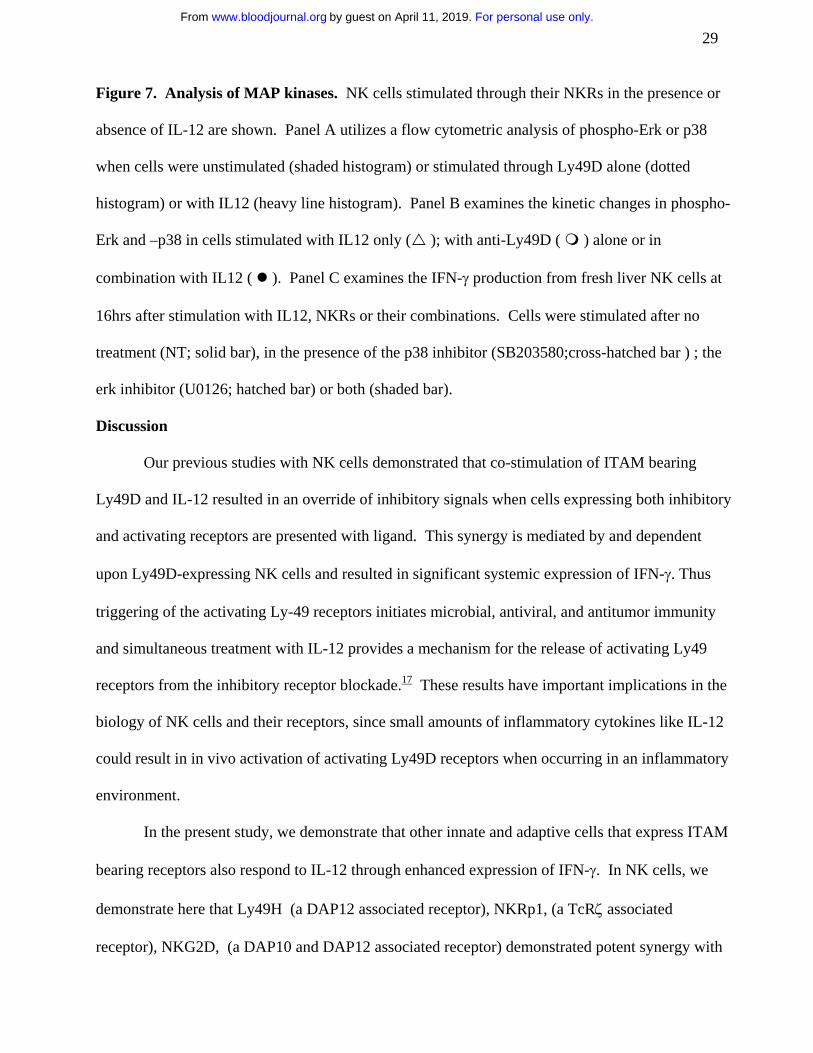
Since previous studies have shown an important role for p38 in the IL-12 signaling pathway, we
sought to examine to potential addition role for erk (p42/p44) in the synergistic responses. Several
recent studies20-23 have shown a direct role for DAP12 signaling via PLCγ and Erk. NK cells were
stimulated with control Ig, anti-Ly49D with or without IL-12 and phospho-Erk and p38 were
analyzed by flow cytometry. As expected IL12 alone markedly increased p38 (shown at 20
minutes; Figure 7A) and marginally increased phospho-Erk (shown at 30 minutes). However,
increased phospho-Erk and p38 is observed upon antibody crosslinking and the levels of these
phosphoproteins are increased and sustained upon addition of IL12 (Figure 7; panel B). Similar
results were seen with NKG2D, except that antibody alone was minimally activating for phospho-
Erk (data not shown). This result is consistent with our observation that NKG2D cross linking by
itself was not sufficient for production of IFN-γ. To directly test if the synergistic response was
due to the activation of both signal transduction pathways, we analyzed the effects of p38 and Erk
inhibitors on the combined treatments. As shown in Figure 7C, the synergistic response between
NKR crosslinking and IL12 was completely abrogated by blocking both MAP kinases whereas
either inhibitor alone had only partial effects. As expected, the response to IL12 alone was blocked
by p38 inhibitors. Collectively these data indicate that synergy between the MAP kinases p38 and
Erk is essential for the NKR synergy with IL12.
For personal use only.on April 11, 2019. by guest www.bloodjournal.orgFrom

28
For personal use only.on April 11, 2019. by guest www.bloodjournal.orgFrom
29
Figure 7. Analysis of MAP kinases. NK cells stimulated through their NKRs in the presence or
absence of IL-12 are shown. Panel A utilizes a flow cytometric analysis of phospho-Erk or p38
when cells were unstimulated (shaded histogram) or stimulated through Ly49D alone (dotted
histogram) or with IL12 (heavy line histogram). Panel B examines the kinetic changes in phospho-
Erk and –p38 in cells stimulated with IL12 only ( ); with anti-Ly49D ( ) alone or in
combination with IL12 ( ). Panel C examines the IFN-γ production from fresh liver NK cells at
16hrs after stimulation with IL12, NKRs or their combinations. Cells were stimulated after no
treatment (NT; solid bar), in the presence of the p38 inhibitor (SB203580;cross-hatched bar ) ; the
erk inhibitor (U0126; hatched bar) or both (shaded bar).
Discussion
Our previous studies with NK cells demonstrated that co-stimulation of ITAM bearing
Ly49D and IL-12 resulted in an override of inhibitory signals when cells expressing both inhibitory
and activating receptors are presented with ligand. This synergy is mediated by and dependent
upon Ly49D-expressing NK cells and resulted in significant systemic expression of IFN-γ. Thus
triggering of the activating Ly-49 receptors initiates microbial, antiviral, and antitumor immunity
and simultaneous treatment with IL-12 provides a mechanism for the release of activating Ly49
receptors from the inhibitory receptor blockade.17 These results have important implications in the
biology of NK cells and their receptors, since small amounts of inflammatory cytokines like IL-12
could result in in vivo activation of activating Ly49D receptors when occurring in an inflammatory
environment.
In the present study, we demonstrate that other innate and adaptive cells that express ITAM
bearing receptors also respond to IL-12 through enhanced expression of IFN-γ. In NK cells, we
demonstrate here that Ly49H (a DAP12 associated receptor), NKRp1, (a TcRζ associated
receptor), NKG2D, (a DAP10 and DAP12 associated receptor) demonstrated potent synergy with
For personal use only.on April 11, 2019. by guest www.bloodjournal.orgFrom

30
IL-12 and IL-18 in the induction of IFN-γ both alone and in the presence of an inhibitory ITIM
signal. In addition, we have found that co-stimulation with IL-12 results in greatly enhanced IFN-γ
production upon cross-linking of T cells and NKT cells with CD3 (a TcRζ associated receptor) or
αGalCer). The IL-12 signaling is STAT4 dependent and does result in much higher levels of total
IFN-γ mRNA. However we did not observe either an increase in the IFN-γ mRNA half-life or
transport of the mRNA from the nucleus to the cytoplasm. Another interesting aspect of this
synergy is the restricted association to expression of the Th1 cytokine, IFN-γ. IFN-γ-KO mice
demonstrated only a minimal co-stimulation response with respect to IL-13 and MIP1α expression
when activating NKRs were crosslinked. Similarly with T cells, the cellular response to IL-12 co-
stimulation was restricted to IFN-γ and was not observed for TNFα or IL-2. Furthermore our data
demonstrates that the synergy observed requires activation through both the p38 and Erk pathways
and demonstrates how these pathways converge at a single point, i.e. enhanced expression of the
IFN-γ gene.
The synergy observed with NKG2D, previously reported to be a DAP10 associated
receptor9,18 in primary NK cells, could be attributed to a low frequency of DAP12 associated
NKG2D receptors. This is an important point and as a result of our analysis we determined that the
reported methods to analyze expression of the mRNA of these two forms was confusing18. As
demonstrated in the supplemental data, the in vivo activation of NK cells with IL-2 resulted in a
dramatic shift in DAP12 association of NKG2D consistent with previous reports18. Thus the
expression of IFN-γ in response to NKG2D crosslinking is dependent upon association with
DAP12,
We believe that our data reflects conditions that are very relevant to the in vivo host
response as only a short (15 minutes) pretreatment with IL-12 can result in maximal activation of
For personal use only.on April 11, 2019. by guest www.bloodjournal.orgFrom

31
the synergy with cross-linking of the ITAM bearing receptors. This data indicates that new protein
synthesis is not required following IL-12 treatment and that post transcriptional modifications of
proteins, including transcription factors, may be a result of the brief IL-12 treatment. This may
result in enhanced recruitment of AP-1 to the IFN-γ promoter as has been reported in in vitro
models24. Consistent with this model is the fact that Ly49 cross-linking does result in increased
AP-1 activity (McVicar DW – personal communication). In addition, NKR activation kinetics
(Figure 5B) indicated that once lymphocytes were activated with IL-12, they remain sensitive to
cross-linking for up to 3 hours. This has important in vivo implications since cells that are in an
inflammatory environment can receive co-stimulation in a number of ways, but the outcome would
be release from inhibitory signals as long as both cytokine and ITAM receptor signals are received
in a proximal time frame. Secondly, our demonstration that multiple combinations of IL-12, IL-18
and ITAM receptor signal experiments can result in an optimal response when utilizing picogram
levels of cytokines, reflects the in vivo condition where IL-12 and IL-18 might be simultaneously
or sequentially released from effector cells such as macrophages. Finally, the in vivo experiments
with tumor cells expressing Rae/γ substantiate our in vitro data and indicate that synergy with
cytokines like IL-12 can occur in inflammatory in vivo environments.
These studies have provided novel results regarding the in vivo function of all potential
ITAM bearing receptors. These data support the contention that the in vivo regulation of inhibitory
and activating receptors occurs not only in NK cells but also in T cells and NKT cells and can be
co-regulated by stimulation with inflammatory cytokines including, IL-12, IL-23, IL-27 and IL-18.
These results are consistent with a model whereby the immune systems ability to regulate innate
and adaptive responses is to maximize the IFN-γ response when multiple “warning” signals are
received in inflammatory sites.
For personal use only.on April 11, 2019. by guest www.bloodjournal.orgFrom

32
Acknowledgment: The authors would like to thank Tim Back, John Wine, and Erin Lincoln for
their support in animal care and experimentation. The authors thank Jeff Subleski for his assistance
in the generation of mouse specific RPA probes for IFN-( .
For personal use only.on April 11, 2019. by guest www.bloodjournal.orgFrom

33
References
1. Leibson PJ. MHC-recognizing receptors: they're not just for T cells anymore. Immunity.
1995;3:5-8.
2. Yokoyama WM. Natural killer cell receptors. Curr Opin Immunol. 1995;7:110-120.
3. Long EO, Colonna M, Lanier LL. Inhibitory MHC class I receptors on NK and T cells: a
standard nomenclature. Immunol Today. 1996;17:100.
4. Long EO, Burshtyn DN, Clark WP et al. Killer cell inhibitory receptors: diversity,
specificity, and function. Immunol Rev. 1997;155:135-144.
5. Takei F, Brennan J, Mager DL. The Ly-49 family: genes, proteins, and recognition of class
I MHC. Immunol Rev. 1998;155:67-77.
6. Raulet DH, Correa I, Corral L, Dorfman J, Wu MF. Inhibitory effects of class I molecules
on murine NK cells: speculations on function, specificity and self-tolerance. Semin
Immunol. 1995;7:103-107.
7. Mason LH, Gosselin P, Anderson SK et al. Differential tyrosine phosphorylation of
inhibitory versus activating Ly-49 receptor proteins and their recruitment of SHP-1
phosphatase. J Immunol. 1997;159:4187-4196.
8. Ortaldo J, McVicar DW. Murine NK receptors: Ly-49 expression, function and intracellular
signaling. In: Sitkovsky MV, Henkart PA, eds. Cytotoxic Cells: Basic Mechanisms and
Medical Applications. Lippincott, Williams and Wilkins; 1999:45-63.
For personal use only.on April 11, 2019. by guest www.bloodjournal.orgFrom

34
9. Lanier LL. NK cell receptors. Annu Rev Immunol. 1998;16:359-393.
10. Mason LH, Anderson SK, Yokoyama WM et al. The Ly-49D receptor activates murine
natural killer cells. J Exp Med. 1996;184:2119-2128.
11. Mason LH, Willette-Brown J, Anderson SK et al. Cutting Edge: Characterization of an
associated 16-kDa tyrosine phosphoprotein required for Ly-49D signal transduction. J
Immunol. 1998;160:4148-4152.
12. Smith KA, Wu J, Bakker ABH, Phillips JH, Lanier LL. Ly49D and Ly49H associate with
mouse DAP12 and form activating receptors. J Immunol. 1998;161:7-10.
13. George TC, Mason LH, Ortaldo JR, Kumar V, Bennett M. Positive recognition of MHC
class I molecules by the Ly49D receptor of murine NK cells. J Immunol. 1999;162:2035-
2043.
14. Ortaldo JR, Winkler-Pickett R, Willette-Brown J et al. Structure/function relationship of
activating Ly-49D and inhibitory Ly- 49G2 NK receptors. J Immunol. 1999;163:5269-5277.
15. Ortaldo JR, Winkler-Pickett R, Wiegand G. Activating Ly-49D NK receptors: expression
and function in relation to ontogeny and Ly-49 inhibitor receptors. J Leukoc Biol.
2000;68:748-756.
16. Ortaldo JR, Winkler-Pickett R, Mason AT, Mason LH. The Ly-49 family: regulation of
cytotoxicity and cytokine production in murine CD3+ cells. J Immunol. 1998;160:1158-
1165.
For personal use only.on April 11, 2019. by guest www.bloodjournal.orgFrom
35
17. Ortaldo JR, Young HA. Expression of IFN-gamma upon triggering of activating Ly49D NK
receptors in vitro and in vivo: costimulation with IL-12 or IL-18 overrides inhibitory
receptors. J Immunol. 2003;170:1763-1769.
18. Diefenbach A, Tomasello E, Lucas M et al. Selective associations with signaling proteins
determine stimulatory versus costimulatory activity of NKG2D. Nat Immunol.
2002;3:1142-1149.
19. Ortaldo JR, Mason LH, Gregorio TA, Stoll J, Winkler-Pickett RT. The Ly-49 family:
regulation of cytokine production in murine NK cells. J Leukoc Biol. 1997;62:381-388.
20. Snyder MR, Nakajima T, Leibson PJ, Weyand CM, Goronzy JJ. Stimulatory killer Ig-like
receptors modulate T cell activation through DAP12-dependent and DAP12-independent
mechanisms.J Immunol. 2004 Sep 15;173(6):3725-31.
21. Snyder MR, Lucas M, Vivier E, Weyand CM, Goronzy JJ. Selective activation of the c-Jun
NH2-terminal protein kinase signaling pathway by stimulatory KIR in the absence of
KARAP/DAP12 in CD4+ T cells. J Exp Med. 2003 Feb 17;197(4):437-49.
22. Jiang K, Zhong B, Gilvary DL, Corliss BC, Vivier E, Hong-Geller E, Wei S, Djeu JY.
Syk regulation of phosphoinositide 3-kinase-dependent NK cell function. J Immunol. 2002
Apr 1;168(7):3155-64.
23. McVicar DW, Taylor LS, Gosselin P, Willette-Brown J, Mikhael AI, Geahlen RL,
Nakamura MC, Linnemeyer P, Seaman WE, Anderson SK, Ortaldo JR, Mason LH.
For personal use only.on April 11, 2019. by guest www.bloodjournal.orgFrom
36
DAP12-mediated signal transduction in natural killer cells. A dominant role for the Syk
protein-tyrosine kinase. J Biol Chem. 1998 Dec 4;273(49):32934-42.
24. Park WR, Nakahira M, Sugimoto N, Bian Y, Yashiro-Ohtani Y, Zhou XY, Yang YF,
Hamaoka T, Fujiwara H. A mechanism underlying STAT4-mediated up-regulation of IFN-
gamma induction inTCR-triggered T cells Int Immunol. 2004 Feb;16(2):295-302.
For personal use only.on April 11, 2019. by guest www.bloodjournal.orgFrom

37
Table 1. Combinatorial synergy between Ly49D receptor, IL-12 and IL-18
Control IgG Pretreatment* Anti-Ly49D (4E5) Pretreatment IL-18 Dose [ng/ml] IL-18 Dose [ng/ml]
IL-12 0 10 1 0.1 0 10 1 0.1
Dose[ng/ml]____________________________________________________________________________
0 2 16 15 6.4 22 1244 127.8 56.9
10 2 19900 21300 20300 1544 31400 34300 34500
1 8 18400 23100 2364 104 32900 30100 **29000
0.1 12 17400 18900 0 23 27300 27700 25200
Difference from control IgG
0 20 1228 113 51
10 1542 11500 13000 14200
1 96 14500 7000 26636
0.1 12 9900 8800 25200_____________________________________________________________________________________
For personal use only.
on April 11, 2019.
by guest
ww
w.bloodjournal.org
From

38
* Liver lymphocytes were obtained from untreated B6 mice, pre-treated with IL-12 or IL-18 at specified
doses at 37ΕC for 30 minutes. Cells were washed, chilled, then coated with anti-NKRs for 20 minutes.
Cells were then washed and cultured for 4 hours.
** Bolded values represent dose combinations where strong synergy was observed
For personal use only.
on April 11, 2019.
by guest
ww
w.bloodjournal.org
From

39
For personal use only.on April 11, 2019. by guest www.bloodjournal.orgFrom
doi:10.1182/blood-2005-04-1579Prepublished online October 25, 2005;
Narayan Bhat, James Cherry, Michael Sanford, Deborah L Hodge and Howard A YoungJohn R Ortaldo, Robin Winkler-Pickett, Jon Wigginton, Meagan Horner, Earl W Bere, Anna T Mason, Regulation of ITAM positive receptors: role of IL-12 and IL-18
http://www.bloodjournal.org/site/misc/rights.xhtml#repub_requestsInformation about reproducing this article in parts or in its entirety may be found online at:
http://www.bloodjournal.org/site/misc/rights.xhtml#reprintsInformation about ordering reprints may be found online at:
http://www.bloodjournal.org/site/subscriptions/index.xhtmlInformation about subscriptions and ASH membership may be found online at:
digital object identifier (DOIs) and date of initial publication. indexed by PubMed from initial publication. Citations to Advance online articles must include final publication). Advance online articles are citable and establish publication priority; they areappeared in the paper journal (edited, typeset versions may be posted when available prior to Advance online articles have been peer reviewed and accepted for publication but have not yet
Copyright 2011 by The American Society of Hematology; all rights reserved.Hematology, 2021 L St, NW, Suite 900, Washington DC 20036.Blood (print ISSN 0006-4971, online ISSN 1528-0020), is published weekly by the American Society of
For personal use only.on April 11, 2019. by guest www.bloodjournal.orgFrom