1 responses to transformational leadership - academy of management
TRANSCRIPT

1
RESPONSES TO TRANSFORMATIONAL LEADERSHIP:
ARE SOME FOLLOWERS IMMUNE?
2
RESPONSES TO TRANSFORMATIONAL LEADERSHIP:
ARE SOME FOLLOWERS IMMUNE?
The purpose of this study was to examine the extent to which individual differences in self-
esteem, trust or cynicism, and intellect or general mental ability influence individuals’ responses
to transformational leaders. In a series of studies, we test the notion that follower personality and
ability interact with leader behaviors in predicting outcomes, such as job and leader satisfaction,
motivation, and job performance. Across three independent samples (community leaders,
business managers, and undergraduate students), using multi-source methodology, we found
little evidence that follower personality or intellect affected responses to transformational
leaders. Findings of these studies are consistent with the notion that the effects of
transformational leadership on job and leader satisfaction, motivation, and job performance,
broadly generalize across followers.

3
Transformational and charismatic leadership have received a great deal of research
attention over the past fifteen years. Inspired by Burns’ (1978) notion of the transformational
leader, Bass (1985) extended and developed transformational leadership theory and placed it in
the context of work organizations. In general, transformational leaders are those who have a
strong sense of direction (vision), which they communicate in inspiring ways. They are
charismatic and elicit emotional responses and trust from followers. In addition to being
charismatic, transformational leaders are said to raise follower self-confidence and self-efficacy
(Shamir, House, & Arthur, 1993), both by expressing confidence in followers and by providing
training, coaching, and development opportunities. Although Bass (1990) considers charisma to
be only one dimension of transformational leadership, there is substantial overlap in theory and
research on charismatic and transformational leadership (see House & Shamir, 1993) and both
literatures inform this inquiry.
Strong evidence has accrued in support of the idea that transformational leadership
behaviors are associated with outcomes desired by individuals and organizations.
Transformational leadership has been associated with follower satisfaction with the leader, with
extra effort, and with ratings of leadership effectiveness (Lowe, Kroeck, & Sivasubramaniam,
1996). Further, transformational leadership has been associated with follower performance at the
individual (Judge & Bono, 2000; Yammarino, Dubinsky, Comer, & Jolson, 1997), group (Pillai
& Meindl, 1998), and business unit (Hater & Bass, 1988; Howell & Avolio, 1993) levels of
analysis. Furthermore, the followers of transformational leaders are more satisfied with their jobs
and display greater trust in their leaders (Podsakoff, Mackenzie, & Bommer; 1996), and are more
committed to their organizations (Barling, Weber, & Kelloway, 1996).

4
Although the focus of transformational leadership theory has been on the behaviors of
leaders, most contemporary views of leadership accept the notion that leadership is a dynamic
process, influenced by leaders, their followers, and the interaction between the two (Hollander,
1992; Mathieu, 2001). Yet, in the transformational leadership literature, little attention has been
paid to follower characteristics or behaviors. This oversight is surprising given the views of
prominent researches in the area. Bass (1985) and Conger and Kanungo (1998) have suggested
that transformational leadership may be more effective for some followers than for others. In
recent reviews of the literature, Conger and colleagues state that dispositional attributes of
followers and how those attributes affect receptivity and responses to transformational and
charismatic leaders have been “poorly explored” (Conger, 1999, p. 161) and represent a “largely
neglected area of research” (Conger & Kanungo, 1998, p. 248). Furthermore, in one of the few
well articulated theories regarding the motivational effects of leaders, Shamir et al. (1993) state,
“Our theory implies that charismatic leaders will not have similar effects on all followers” (p.
587).
Hence, the purpose of the present studies is to examine the extent to which follower
characteristics and leader behaviors interact in predicting job-related outcomes. In a series of two
field studies and an experimental lab study, we test the notion that individual differences in
personality and general mental ability may influence the extent to which the behaviors of
transformational leaders lead to increases in motivation, job and leader satisfaction, and job
performance. In the next section of the paper, we discuss the transformational leadership “effect”
on followers, follower characteristics that have been proposed as moderators of transformational
leadership, and the hypothesized directional nature of these hypothesized effects.
5
Transformational Leadership Processes and Role of Follower Characteristics
Although there is a great deal of empirical evidence documenting the effects of
transformational leadership on followers, Bass (1995) notes that only a few studies have been
devoted to exploring the psychological processes by which the behaviors of transformational
leaders and follower responses are linked. In most early conceptualizations of charismatic and
transformational leadership, leaders were defined by their effects on followers in terms of
admiration, liking, trust, and respect (Bass, 1985; Conger & Kanungo, 1987; House, 1977). Over
time, these theories have placed greater emphasis on leader behaviors, but the emotional and
inspirational elements of the influence process have remained at the heart of this genre of
leadership theory. In his initial exposition of transformational leadership theory, Bass (1985)
notes that this type of leadership “packs an emotional wallop,” “has an intense emotional
component,” and “is an absolute emotional and cognitive identification with the leader” (p. 36).
In addition to emotional engagement, transformational leaders influence followers by
building their confidence. Shamir et al. (1993) note that transformational leaders increase effort-
accomplishment expectancies by expressing high-expectations and confidence in followers’
ability to perform. Furthermore, empirical evidence indicates that trust is a key psychological
process by which transformational leaders and followers are linked (Podsakoff, MacKenzie,
Moorman, & Fetter, 1990). Thus, transformational leaders influence followers, at least in part, by
a) engaging them emotionally (inspiring them), b) increasing their confidence, and c) gaining
their trust.
Whereas there is no well-developed theoretical explanation of the role of individual
differences in response to behaviors of transformational leaders, there has been some speculation
with respect to three “types” of individuals who would be likely to respond to or resist emotional

6
appeals and attempts to build confidence and trust. First, Bass (1985) suggested that individuals
who are skeptical, cynical, and distrustful might be less likely to respond to emotional
inspiration. A review by Conger (1999) also cites cynicism and distrust as individual attributes
related to responses to charismatic leaders. Furthermore, Podsakoff et al. (1990) report that the
effects of transformational leadership behaviors on follower performance (citizenship behaviors)
was indirect, mediated by trust, suggesting that those prone to trusting their leaders will respond
more favorably to transformational leadership behaviors. Indeed, in House’s (1977) model of
charismatic leadership, follower trust in the leader is a necessary condition for charismatic
leadership to produce its desired effects on follower performance. Hence,
H1: Individuals differences in the tendency to be cynical and trusting will moderate
the relationship between transformational leadership and outcomes. Specifically,
individuals who score high on cynicism and low on trust will be less responsive to
transformational leaders.
Next, Bass (1985) suggests that individuals who are rational, highly educated,
independent, and high in status may be resistant to the influence attempts of transformational
leaders. The basic argument here is that intelligent and intellectual individuals—because of their
tendencies to think logically and critically—will be less likely to “succumb to the blandishments
of the charismatic leader or the leader who emphasizes emotional inspiration” (Bass, 1985, p.
164). In addition to being less influenced by emotional appeals, individual high in ability may
also experience smaller (or no) incremental improvements in performance due to
transformational leadership because they are already performing at a high level. Considering this
argument from another angle, there is more potential for improvement through any motivational
intervention—including transformational leadership—for individuals with low general mental

7
ability. In conceptualizing this moderating effect of intellectance, we consider both the
personological (intellectual personality—a facet of openness [Costa & McCrae, 1992]) and
ability (cognitive or general mental ability) components. Therefore,
H2: The relationship between transformational leadership and job-related outcomes
(satisfaction and performance) will be moderated by intellectual/cognitive ability.
Specifically, the effects of transformational leaders will be stronger for
individuals who are unintellectual or have low cognitive ability and weaker for
those who are intellectual or high in cognitive ability.
The individual difference most discussed with respect to transformational leadership is
self-esteem. Wiererter (1997) proposed that follower self-concept stability and clarity would
predict follower responses to charismatic leaders. In addition, there is some empirical support for
the idea that followers of charismatic leaders show greater feelings of helplessness and that
individuals low in self-esteem are more likely to be drawn to inspirational leaders (see Conger,
1999 for a review). It should be pointed out that none of the studies reviewed by Conger
involved business organizations. Indeed, it is important to note the distinction between traits
which might lead to joining a cult led by a charismatic leader (the context for much prior
research on this topic) and traits which might lead to working harder in response to a
transformational leader in a business organization. Nonetheless, there are additional reasons to
believe that follower self-esteem will affect follower responses to transformational leaders. As
noted earlier, one of the ways in which such leaders influence followers is by building self-
confidence. Since low self-confidence is an element of self-esteem, it is likely that coaching,
development, and expression of confidence will more fruitful for individuals with low self-
esteem. Indeed, McNatt’s (2000) meta-analysis revealed that leader actions designed to raise
8
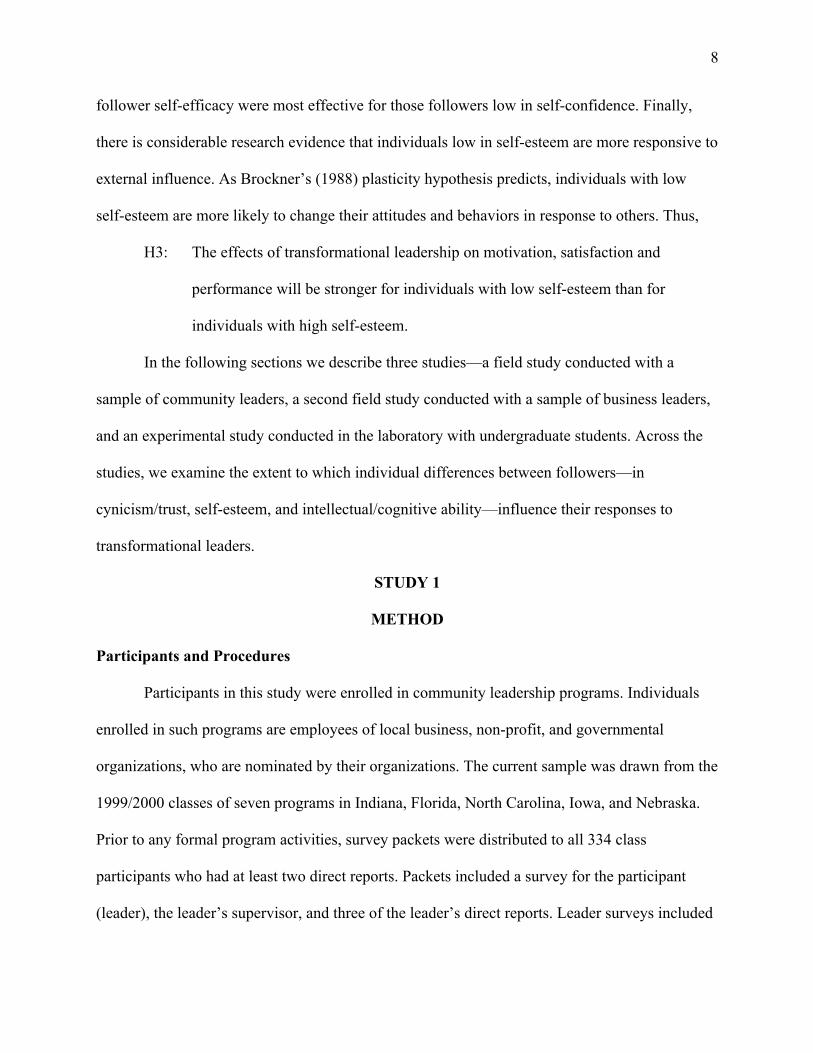
follower self-efficacy were most effective for those followers low in self-confidence. Finally,
there is considerable research evidence that individuals low in self-esteem are more responsive to
external influence. As Brockner’s (1988) plasticity hypothesis predicts, individuals with low
self-esteem are more likely to change their attitudes and behaviors in response to others. Thus,
H3: The effects of transformational leadership on motivation, satisfaction and
performance will be stronger for individuals with low self-esteem than for
individuals with high self-esteem.
In the following sections we describe three studies—a field study conducted with a
sample of community leaders, a second field study conducted with a sample of business leaders,
and an experimental study conducted in the laboratory with undergraduate students. Across the
studies, we examine the extent to which individual differences between followers—in
cynicism/trust, self-esteem, and intellectual/cognitive ability—influence their responses to
transformational leaders.
STUDY 1
METHOD
Participants and Procedures
Participants in this study were enrolled in community leadership programs. Individuals
enrolled in such programs are employees of local business, non-profit, and governmental
organizations, who are nominated by their organizations. The current sample was drawn from the
1999/2000 classes of seven programs in Indiana, Florida, North Carolina, Iowa, and Nebraska.
Prior to any formal program activities, survey packets were distributed to all 334 class
participants who had at least two direct reports. Packets included a survey for the participant
(leader), the leader’s supervisor, and three of the leader’s direct reports. Leader surveys included

9
a self-report of transformational leadership behaviors. In addition, leaders completed a
performance evaluation for each of their direct reports. Leaders’ supervisors also reported on
transformational leadership behaviors. Direct report (follower) surveys included measures of
leadership behaviors, job satisfaction, and organizational commitment, along with the personality
items. Leaders were asked to distribute the surveys to their colleagues, choosing the three direct
reports with whom they worked most closely. Although participant names were on the surveys to
allow matching, responses were confidential and were returned directly to the authors.
Responses were received from 212 leaders, representing a 63% response rate. Participant
leaders were predominantly female (69%), with an average age of 43 years. Ninety percent had a
bachelor’s degree or higher and, on average, they had been working in their current job for nine
years, their current organization for nine years, and had seven direct reports.
Measures
Leadership. Transformational leadership was measured with the Multifactor Leadership
Questionnaire (MLQ - Form 5X), the most commonly used measure of transformational
leadership.1 Although the measure has been found to be a valid and reliable measure of
transformational leadership. (Kirnan & Snyder, 1995), there is some controversy over its
dimensionality. With respect to transformational leadership (vs. transactional), most factor
analytic work, including a recent large-scale study (Avolio, Bass, & Jung, 1999; Carless, 1998)
demonstrate equally good fit for a multi-dimensional model (idealized influence, inspirational
motivation, intellectual stimulation and individual consideration), and a single factor,
transformational leadership model. Since the single factor model is most parsimonious and the
dimensions tend to be highly correlated and lack discriminant validity (Bycio, Hackett, & Allen,
1995; Lowe et al., 1996), we measured each of the four dimensions with four items on a scale of

10
1=Not at all to 5=Frequently, if not always and then averaged the items to form an overall
transformational leadership score. The MLQ was completed by the leader, his or her supervisor,
and up to three direct reports.
Cynicism. Dispositional cynicism was measured with a six-item scale (Kanter & Mirvis,
1989). Sample items include “People claim to have ethical standards, but few stick to them when
money is at stake,” “Most people are just out for themselves,” and “Most people are not really
honest by nature.” Participants responded to a five point scale anchored by 1=Strongly disagree
to 5=Strongly agree. The six items were averaged to form a single cynicism score for each
participant.
Trust. Dispositional trust was measured with the trust scale from the International
Personality Item Pool (IPIP; Goldberg, 1999), a public-domain personality inventory containing
items developed conjointly among scientists worldwide. Trust was assessed with ten items on a
1=Strongly disagree to 5=Strongly agree scale. Items included “I believe that others have good
intentions,” (reverse scored) “I suspect hidden motives in others,” and “I am wary of others.”
Responses on this scale were on the same five-point scale used for cynicism. Items were
averaged to form an overall trust score.
Intellect. Because we were interested in the potential personological effects of intellect as
much as the ability effects, in this study, we assessed intellect with a personality measure.
Specifically, we used the 10-item IPIP measure of intellect (Goldberg, 1999). Items included “I
like to solve complex problems,” “I have a rich vocabulary,” “I have difficulty understanding
abstract ideas,” and “I avoid difficult reading material.” Responses were on the same five-point
scale used for the other personality measures and were averaged to form a single Intellect score.

11
Subordinate satisfaction with supervision. Subordinate satisfaction with the leader was
measured with three items from the Job Diagnostic Survey (Hackman & Oldham, 1980). The
three items were, “I am satisfied with the overall quality of supervision I receive in my work,” “I
am satisfied with the amount of support and guidance I receive from my supervisor,” and “I am
satisfied with the degree of respect and fair treatment I receive from my boss.” Responses to
these three items were evaluated on a 1=Strongly disagree to 5=Strongly agree scale. They were
averaged to form a satisfaction with supervision score.
Subordinate overall job satisfaction. Subordinate overall job satisfaction was measured
with five items taken from the Brayfield-Rothe measure of overall job satisfaction (Brayfield &
Rothe, 1951). These five items were, “I feel fairly satisfied with my present job,” “Most days I
am enthusiastic about my work,” “Each day at work seems like it will never end (reverse
scored),” “I find real enjoyment in my work,” and “I consider my job to be rather unpleasant”
(reverse scored). Responses were evaluated on a 1=Strongly disagree to 5=Strongly agree scale,
and averaged to form a scale.
Subordinate work motivation. Subordinate work motivation was measured with three
items from the MLQ that assess subordinate willingness to exert extra motivation as a result of
the leader’s influence. An example item is: “My leader increases my willingness to try harder.”
These items were evaluated on a 1=Not at all to 5=Frequently, if not always scale. These items
were averaged to form a scale.
Subordinate organizational commitment. Subordinate organizational commitment was
measured with the affective commitment scale (Allen & Meyer, 1990). The affective scale was
used as it provides a specific measure of the employees’ desire to remain with the organization
rather than a need to do so (continuance commitment). Sample items include, “I would be very

12
happy to spend the rest of my career with this organization,” “I enjoy discussing my organization
with people outside it,” and “I do not feel a strong sense of belonging to my organization”
(reverse scored). As with the satisfaction items, responses were evaluated on a 1=Strongly
disagree to 5=Strongly agree scale, and were averaged across items.
Subordinate job performance. Overall, task, and contextual performance were measured
using items adapted from Borman and Motowidlo (1993). Leaders responded to this question
stem, “In comparison to others, how effective is this person . . .” Sample items include, “On the
technical areas of his/her job (e.g., sales, engineering or accounting proficiency)”—task
performance (3 items); “On his/her contribution to work unit effectiveness”—overall
performance (3 items); and “In looking for challenging assignments” and “In supporting and
encouraging a coworker with a problem”—contextual performance (10 items). Supervisors
responded on a seven point scale, 1= Very poor and 7=Very strong. Items were averaged within
criterion to form three performance scores—overall, task, and contextual.
RESULTS
Consistent with past research on the MLQ (see Lowe et al., 1996), the correlations among
the transformational leadership dimensions were quite high—the average correlation among the
four dimensions, across the three rating sources, was .69. If this correlation were corrected for
unreliability, the average correlation would be above .80. Thus, because of the high
intercorrelations among the dimensions, and because the distinctiveness among the dimensions
has been debated in the literature (Bycio et al., 1995), we conducted a principle components
analysis of the four dimensions for leaders and their followers and supervisors. For all ratings
sources, a single factor (with an Eigenvalue greater than 1.0) was extracted. Across all sources
and dimensions, the average factor loading was .76 and, on average, the single factor explained
13
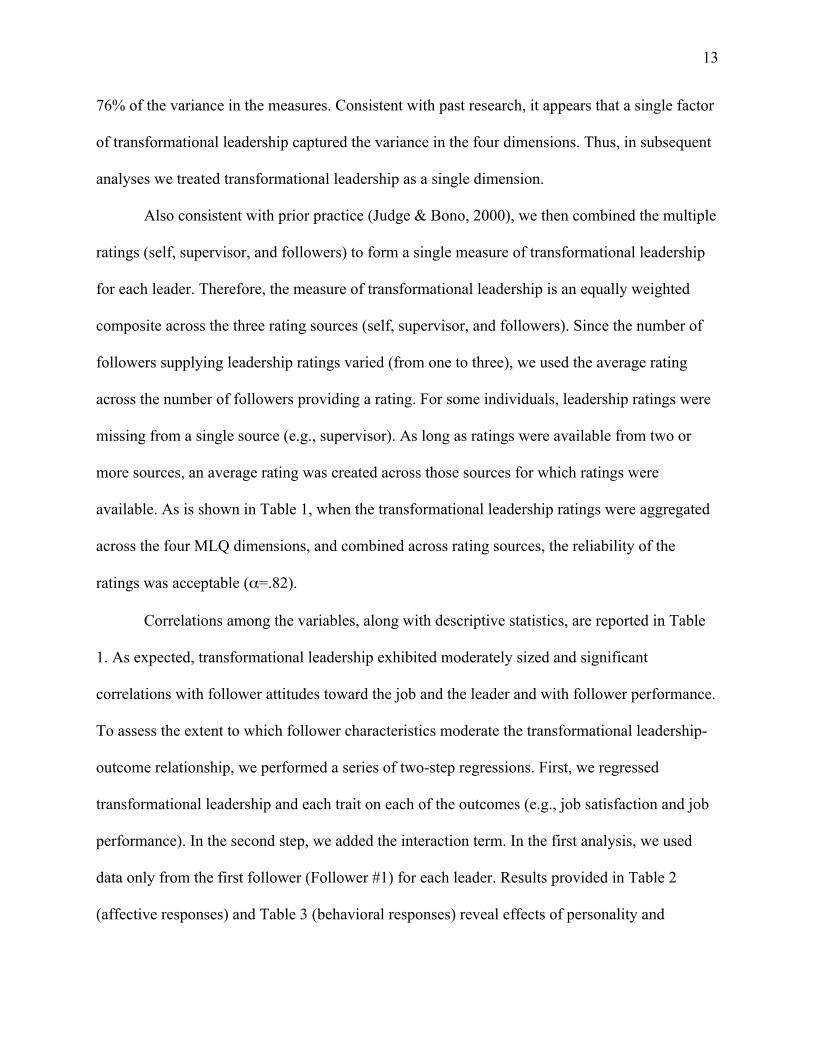
76% of the variance in the measures. Consistent with past research, it appears that a single factor
of transformational leadership captured the variance in the four dimensions. Thus, in subsequent
analyses we treated transformational leadership as a single dimension.
Also consistent with prior practice (Judge & Bono, 2000), we then combined the multiple
ratings (self, supervisor, and followers) to form a single measure of transformational leadership
for each leader. Therefore, the measure of transformational leadership is an equally weighted
composite across the three rating sources (self, supervisor, and followers). Since the number of
followers supplying leadership ratings varied (from one to three), we used the average rating
across the number of followers providing a rating. For some individuals, leadership ratings were
missing from a single source (e.g., supervisor). As long as ratings were available from two or
more sources, an average rating was created across those sources for which ratings were
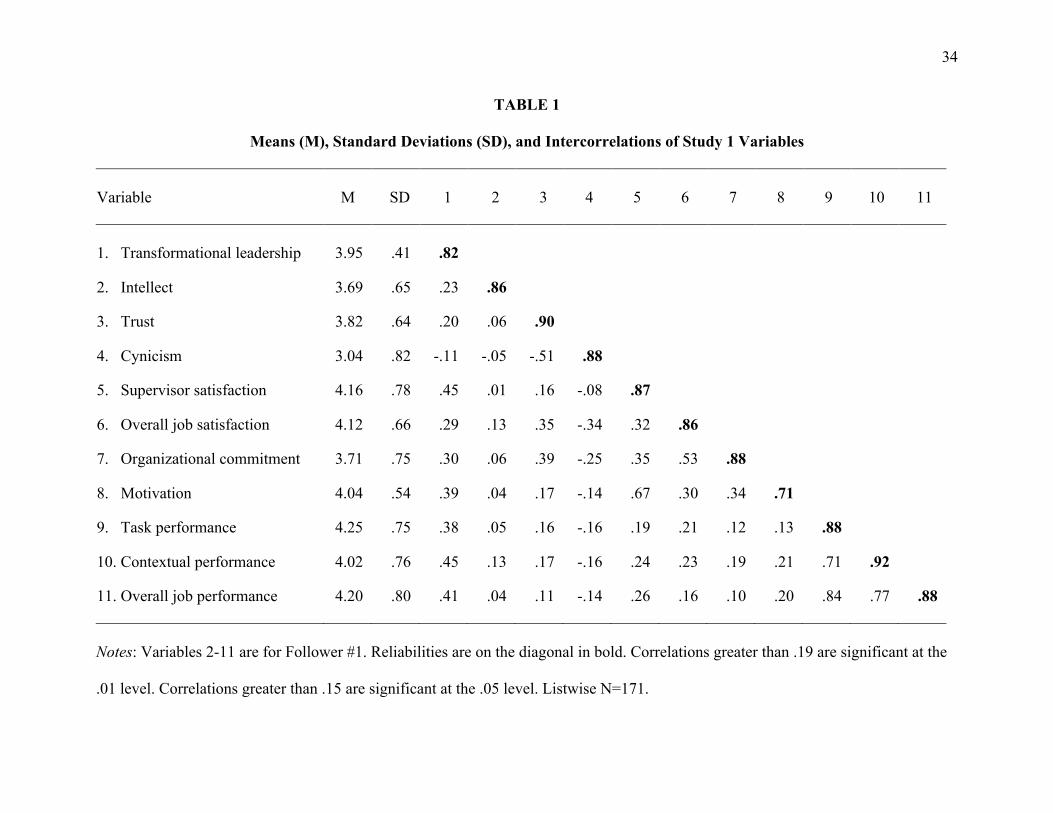
available. As is shown in Table 1, when the transformational leadership ratings were aggregated
across the four MLQ dimensions, and combined across rating sources, the reliability of the
ratings was acceptable (!=.82).
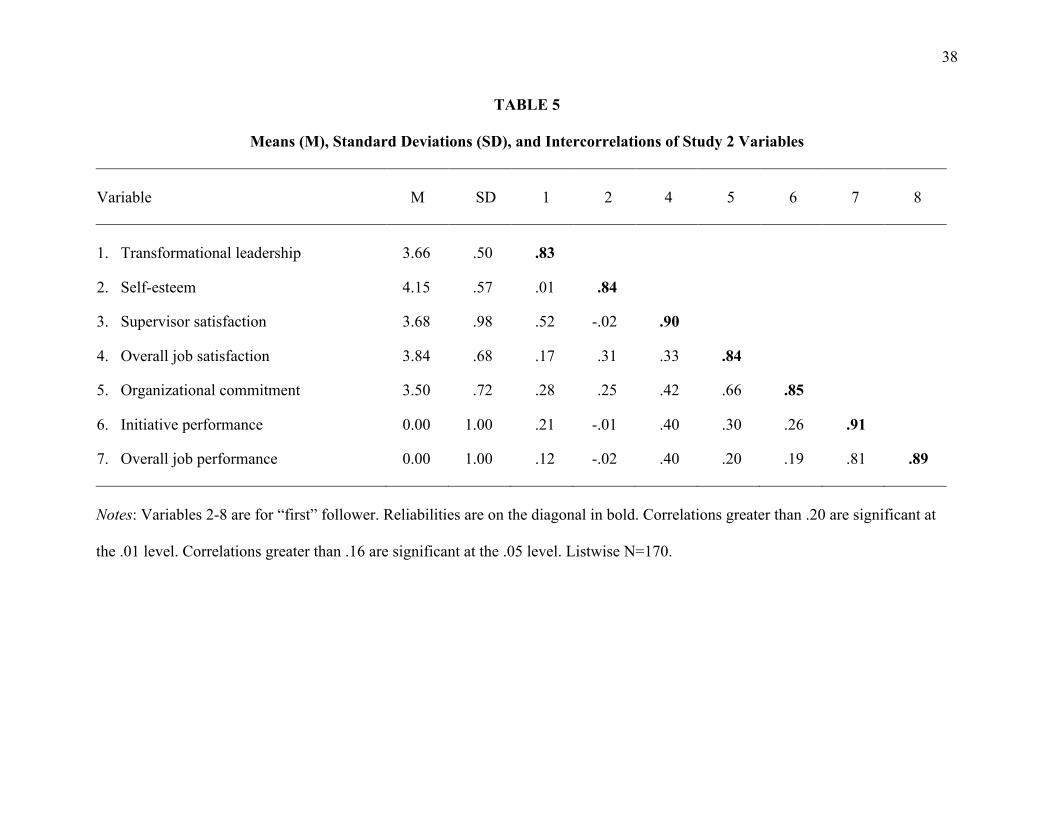
Correlations among the variables, along with descriptive statistics, are reported in Table
1. As expected, transformational leadership exhibited moderately sized and significant
correlations with follower attitudes toward the job and the leader and with follower performance.
To assess the extent to which follower characteristics moderate the transformational leadership-
outcome relationship, we performed a series of two-step regressions. First, we regressed
transformational leadership and each trait on each of the outcomes (e.g., job satisfaction and job
performance). In the second step, we added the interaction term. In the first analysis, we used
data only from the first follower (Follower #1) for each leader. Results provided in Table 2
(affective responses) and Table 3 (behavioral responses) reveal effects of personality and
14
leadership on the outcomes of interest. One significant interaction was found; cynicism
moderated the relationship between transformational leadership and overall job satisfaction in
the direction expected. However, no significant moderating effects were found for Intellect or
Trust; nor was a moderating effect found for Cynicism with respect to the other outcomes. Thus,
out of 21 regressions, only one significant relationship was found, indicating a level of
significant effects (5%) that would be predicted by chance alone. In conducting these same
analyses for Follower #2 (N=150), the interaction between Cynicism and transformational
leadership in predicting job satisfaction was not replicated. However, several significant
interactions were found for both Intellect and Trust with respect to the motivational and
attitudinal outcomes. These results are presented in Table 4.
In an attempt to provide an even stronger test of our hypotheses, we conducted an
additional analysis with all the data from Followers #1, #2 and #3 (N=416) combined. In
combining the data from all followers, we reduce sampling error, using all the data to get the
single best estimate of the true interaction between personality and leadership, and increase our
power to detect small moderating effects. However, with this analysis we violate assumptions of
independence in our data, with respect to reports of transformational leadership behaviors. Since
we aggregated all the leadership reports into a single measure of transformational leadership, the
leadership score for Follower #1 for any given leader is the same as the leadership report for
Follower #2. This results in a reduced variance in leadership scores and downwardly biased
standard errors in our regression analysis, leading to a greater likelihood of finding significant
results. Since we are now attempting to replicate null findings with respect to the leadership-
personality interaction, the biased standard errors result in a more conservative test of the idea
that no moderation is present. In other words, if we do not find significant results in the

15
combined analysis, we can be more certain that non-significant findings mean that moderating
effects to not exist, as the data are biased in favor of finding significant results (due to reduced
variance in leadership scores). Results in Table 4 indicate that in the combined sample, there was
one moderating effect present. The effects of transformational leaders interacted with Intellect in
predicting motivation. This was an effect also found in the Follower #2 sample.
In general, the results of this study do not provide support for the idea that individuals are
differentially responsive or resistant to transformational leaders, as no consistent moderating
effects were found for Cynicism, Trust, or Intellect. However, in this study we did not measure
self-esteem. Thus, we test our hypothesis with respect to self-esteem in a second field study.
STUDY 2
METHOD
Participants
Participants were individuals holding supervisory, managerial, or leadership positions
within a participating organization and their direct reports. For the purpose of this study, a leader
was defined by formal position (at least two direct reports) and a participating organization was
one who endorsed leader participation in this study in exchange for a leadership development
workshop. Organizations were recruited through the National Management Association, and
local Chambers of Commerce. In total, managers from nine organizations participated in the
study. Organizations represented a broad variety of industries from aerospace to advertising to
financial services.
Participating organizations were required to identify an intact group of managers for
participation. In some organizations, this included all managers in the organization. In other
organizations, participating managers were all managers at a particular geographic location, or

16
all managers in a particular work unit (e.g., all managers in the customer service division).
Participating managers had titles that ranged from supervisor and team leader to director and
senior vice president. They had a mean of 14 direct reports and, on average, had been in their
current jobs for 5.5 years. Sixty three percent of the managers were male and their average age
was 43 years old. Of the 324 leaders invited to participate, 247 (76%) completed a series of
surveys, along with 861 of their followers. However, complete data—leadership reports,
personality, attitudes, and job performance obtained at two points in time—was obtained for 661
individuals (170 leaders).
Procedures
Data for this study were collected over the Internet in two waves. At Time 1, leaders
identified the employees who reported to them from a company list. Six employees (direct
reports) were randomly selected for participation in the study. An email was sent to the randomly
selected direct reports, who were asked to complete a survey of leadership behaviors for the
target leader. If a manager had fewer than six employees, all employees were included. At Time
2 (approximately 60 days later), leaders completed job performance reports for each of the direct
reports who had been selected for participation. Also at Time 2, direct reports completed job
attitude surveys. Individual survey responses were confidential, although participants were
notified that an executive summary would be provided to the organization.
Measures
Leadership. Consistent with procedures in Study 1, transformational leadership behaviors
were measured with the Multifactor Leadership Questionnaire (MLQ - Form 5X).
Self-esteem. Self-esteem was measured using Rosenberg’s (1965) 10-item self-esteem
scale, which includes items such as, “I feel that I am a person of worth, at least on an equal basis

17
with others,” and “At times I think I am no good at all” (reverse scored). Responses to the 10
items were on a five point scale, anchored by 1=Strongly disagree to 5=Strongly agree. They
were averaged to form a single self-esteem score.
Satisfaction and commitment. Subordinate satisfaction with the leader was measured
with three items from the Job Diagnostic Survey (Hackman & Oldham, 1980), subordinate job
satisfaction was measured with the Brayfield-Rothe measure of overall job satisfaction
(Brayfield & Rothe, 1951), and subordinate organizational commitment was measured with the
affective commitment scale (Allen and Meyer, 1990), as in Study 1.
Subordinate job performance. Transformational leadership is focused on the attainment
of “performance beyond expectations” (Bass, 1985). Thus, in this study, we attempted to
measure job performance in a way that specifically focused on initiative aspects of job
performance (personal initiative, innovation, self-direction) as well as overall job performance.
Overall job performance was measured with three items, two of which are taken from the Role
Based Performance Scale (RBPS; Welbourne, Johnson, & Erez, 1998). The third item is a
measure of overall task performance and asks supervisors to rate their subordinates “on his/her
overall performance in the tasks associated with his/her job.” The response scale for these items
is a five-point scale anchored by “Needs improvement” (1) and “Excellent” (5). The initiative
aspect of job performance was assessed with three subscales measuring self-direction (with items
adapted from a scale developed by Stewart, Carson, & Cardy [1996]), personal initiative (with a
four-item scale based on a prior, qualitative measure of the construct [see Freese, Kring, Soose,
& Zempel, 1996]). Responses to these items were on a 1=never to 5=frequently scale. Responses
from all three dimensions were averaged to form a single initiative performance score for each
direct report.

18
RESULTS
Consistent with Study 1 and prior research, the multiple MLQ reports for each leader
were combined to form a single transformational leadership score. In this study, we obtained
leadership reports only from followers. Thus, the measure of transformational leadership is an
equally weighted composite across an average of four followers per leader. To control for
possible differences in norms surrounding supervisory ratings of performance between
companies (e.g., in one organization, managers routinely used only the top two items on a five
point rating scale), follower performance ratings were standardized within organization.
Correlations among the variables, along with descriptive statistics, are reported in Table 5. As
expected, transformational leadership exhibited significant correlations with follower attitudes
toward the job and the initiative dimension of performance. However, these relationships were
somewhat smaller than in Study 1 and the relationship between transformational leadership and
task performance was positive but not significant.
To assess the extent to which self-esteem moderates the transformational leadership-
outcome relationship, we performed the same series of two-step regressions as in Study 1. Once
again we analyzed Follower #1 (N=170) Follower #2 (N=160) and also, due to adequate sample
size, Follower #3 (N=128). Across all three data sets (15 regressions), we found only one
significant interaction. In the Follower #2 data, self-esteem and transformational leadership
interacted in predicting organizational commitment ("=#.14, $ R2 =.02, p<.05). Given only
one—non-replicated—significant interaction, we followed the logic described in Study 1. That
is, we used the entire data set (N=661) in order to gain the best estimate of the moderating effects
of self-esteem. Results in Table 7 demonstrate that no significant moderating effects are found
for self-esteem with any of the outcome variables.
19
Because of the essentially null finding with respect to leadership personality interactions
in both field studies, we conducted an exploratory analysis in this data set using the Big Five
personality traits (NEO-FFI; Costa & McRae, 1992). Using the entire sample, all five outcomes
(satisfaction with the job and the leader, organizational commitment, and overall and initiative
performance) and all five traits (neuroticism, extraversion, openness to experience, agreeableness
and conscientiousness), we performed 25 two-step regressions. Results from this analysis
revealed two significant moderating effects. Specifically, openness to experience moderated the
effect of transformational leadership on satisfaction with supervision, ($R2=.004, p < .05), and
agreeableness moderated the effect of transformational leadership on performance ($R2=.007, p
< .05). Since this analysis revealed only two of 25 (8%) significant interaction effects, these
results are consistent with those of the main analysis in suggesting that follower personality does
not interact with leader behaviors in predicting outcomes.
In a final study, we report the results of a laboratory experiment in which
transformational leadership was manipulated. In this study, we test for moderating effects of self-
esteem and cognitive ability in a more controlled setting. Because we did not find moderators in
the field studies, we seek to replicate the null finding with respect to self-esteem. Furthermore, in
this study we obtain a direct measure of cognitive ability.
STUDY 3
METHOD
Participants and Procedures
Participants in this study were 144 undergraduate management students at a Midwestern
university who participated in the study in exchange for extra credit. Demographically,

20
participants were representative of undergraduate management students at this university: 94%
percent were Caucasian, 53% were male, and their average age was 21 years.
Participants were told that they would be participating in a business simulation, the
context of which was the opening of a new student-oriented restaurant in a university town. They
were told that the CEO of a restaurant chain was interested in having students provide
information and assist in the selection of a site for the new restaurant. Participants were told that
the CEO had prepared some comments for them and would be asking them to complete some
tasks and answer some questions related to the operation of a college-town restaurant. The study
was conducted in two stages. In the first stage, participants completed demographic and
individual difference measures in a group setting. After completing surveys, each participant
signed up for an individual session in a computer lab. In the second session, participants were
exposed to a transformational leadership manipulation. Then, they completed a series of tasks
and surveys. The leadership manipulation, the surveys, and the tasks took place at a computer.
Participants were randomly assigned to a leadership condition (transformational vs. non-
transformational). In addition to the initial leadership manipulation, there were two short follow-
up leadership manipulations (30 second videos), which were streamed over the Internet after the
completion of each task.
Participants were asked to complete three tasks. First, they were asked to come up with a
list of names for the restaurant. In the second task, they were asked to proofread a menu and
identify errors. In the third task, they were asked to come up with a logo for the restaurant. In
tasks 1 and 3, participants were asked to list as many ideas (for names and logos) as possible.
Responses were typed into the computer. After completion of these tasks, participants were told

21
that there was a final task, one that was optional but would help the CEO. The final task was to
offer suggestions for operating a successful restaurant in a college town.
Leadership Manipulation
The leadership manipulation used in this study was modeled after other studies using
trained actors (e.g., Howell & Frost, 1989; Kirkpatrick & Locke, 1996; Shea & Howell, 1999). In
contrast to prior studies, however, the leadership manipulation (transformational vs. non-
transformational) in this study was recorded on digital video and delivered via computer. A
professional actor—a white male, age approximately 40 years old—was trained to deliver two
“speeches,” one for each leadership condition. Scripts for the leadership manipulations were
developed based on transformational leadership theory (Bass, 1985) and previous experiments
where actors have been used (Howell & Frost, 1989; Kirkpatrick & Locke, 1996). Several
elements of transformational leadership were manipulated. First, the transformational leader
stated his vision, talked about his values, and told stories that illustrated both the vision and his
commitment to the vision (inspirational motivation). The transformational script also contained
stories about how the CEO challenged traditional restaurant practices (intellectual stimulation).
Finally, in the transformational script, the leader expressed high performance expectations and
confidence in participants’ ability to perform. With respect to communication style, the
transformational script used repetition of key phrases and imagery to illustrate the vision.
The non-transformational leadership manipulation duplicated all factual information
about the restaurant (e.g., number of current locations, intention to open a new location, and the
fact that the restaurant catered specifically to college students). However, in the non-
transformational condition, there was no vision statement and no reference to the CEO’s vision
for the restaurant. Rather, following procedures used by Kirkpatrick and Locke (1996), the non-
22
transformational script contained more general information regarding restaurant operations.
Thus, the non-transformational script was factual rather than inspiring, and excluded any
reference to values, vision, or intellectual stimulation. The language was direct and
straightforward, but did not include the stories or rhetorical techniques used in the
transformational condition.
Both the transformational and the non-transformational leadership manipulations were
about five minutes in length (with approximately equal word counts). They were recorded on the
same day, in the same physical setting, with the actor wearing the same clothing in each. In
addition, physical movement (between podium and desk) and camera shots (e.g., close-up shots)
were duplicated. In addition to the primary leadership manipulation, there were two short video
boosters (approximately 30 seconds) for each condition. The primary purpose of the boosters
was to remind participants of the leadership manipulation. In the transformational condition, the
leader referred to his vision for the restaurant and asked participants to do a good job. In the non-
transformational condition, the leader simply asked the participants to do a good job.
Measures
Self-esteem. As in Study 1, self-esteem was measured using Rosenberg’s (1965) 10-item
scale. Responses to the 10 items were on a five point scale, anchored by 1=Strongly disagree to
5=Strongly agree. They were averaged to form a single self-esteem score.
Cognitive ability. The Wonderlic Personnel Test, Form D (Wonderlic, 1983) was used to
measure general cognitive ability. The Wonderlic Personnel Test is a 12-minute, paper and
pencil test that consists of 50 items. This measure was scored in terms of the number right out of
50. The reliability and validity of this test are well documented (Dodrill & Warner, 1988).

23
Task satisfaction. Task satisfaction was measured with the work sub-scale of the Job
Descriptive Index (JDI; Smith, Kendall, & Hulin, 1969). The JDI is widely used in the job
satisfaction literature and has been found to be a valid and reliable measure of job satisfaction
(Balzer et al., 1997). A three-item response scale (“Yes”, “No”, or “?”) was used for task
satisfaction. These responses were recoded into a numerical format, “Y”=3, “?”=1, and “N”=0,
and averaged to form a task satisfaction score.
Satisfaction with leader. Satisfaction with the leader was with the same three-item scale
used in Study 1 and 2 with slight wording changes to reflect the laboratory setting.
Motivation. Participant motivation was measured with three items reflecting the
participants effort in completing the business simulation. The items were “I worked hard on the
business simulation,” “I did not put a great deal of effort into working on the tasks,” and “I put
my best effort into these tasks.” Responses were on a five point scale anchored by 1=Strongly
Disagree and 5=Strongly Agree. The three items were averaged to form a single motivation
score.
Extra-role performance. As noted in the task description, participants were required to
complete three tasks. Following completion of these tasks they were asked if they would be
willing to work on a fourth task, which was not required. If participants agreed to “help out” they
were asked for ideas for improving the restaurant. The number of ideas they submitted was used
as a measure of extra-role performance.
Task performance. Two measures of task performance were calculated. A creative
performance score was formed by summing the total number of responses participants made in
the first and third tasks. An accuracy performance score was formed by summing the total
number of mistakes in the menu that were found by the participant on the proofreading task.

24
RESULTS
Descriptive statistics and correlations among the study variables are presented in Table 7.
As expected, there is a significant correlation between the transformational leadership
manipulation and both affective (satisfaction with the task and the leader), and behavioral
(motivation, task performance, and extra-role performance) outcomes. Table 8 reports the mean
level of each of the outcomes by experimental condition. There was a significant difference in
the mean transformational leadership rating between conditions. In addition the effects of the
leadership manipulation on participant satisfaction and motivation were strong. There were also
significant, though weaker, effects for motivation, extra-role and creative performance, but not
for accuracy performance. Examination of the correlations in Table 7 also reveals a strong
(r=.60) correlation between cognitive ability and performance on the accuracy task.
In order to determine whether individuals with high ability or low self-esteem were less
(or more) responsive to transformational leaders, we conducted the same two-step regressions
reported in the field studies. Table 9 results indicate that no moderating effects were found for
self-esteem or cognitive ability for any of the satisfaction or performance variables. Across both
individual difference variables and all six outcomes, the average change in R2 was .005,
indicating the absence of moderation for the variables tested.
GENERAL DISCUSSION
The purpose of these studies was to determine whether transformational or charismatic
leaders are differentially effective in attaining outcomes such as job satisfaction and performance
depending on the type of follower they are leading. Stated differently, we were interested in
whether some individuals (intellectual, cynical, distrusting) are resistant to the influence attempts
of transformational leaders and whether other individuals (low self-esteem) are more responsive.
25
Although some personality interactions were found in Study 1, overall results were not consistent
with the idea that follower personalities interact with leadership behaviors in predicting
outcomes. Rather, these data tend to support Bass’ (1997) claims regarding the “universality” of
transformational leadership. Although it has been suggested that some individuals may be
resistant to the effects of transformational leadership (Bass, 1985; Holland, 1992; Conger &
Kanungo, 1998), our results tend not to support this position. In general, distrusting, and cynical,
and intellectual individuals do not appear to be resistant to transformational leaders. Nor, do
individuals with low self-esteem appear to be more responsive to these leaders.
This is an important finding as there has been some discussion about the relationship
between transformational leadership and follower personality, especially with respect to follower
self-esteem. Psycholanalytic approaches to the study of follower responses to charismatic
leadership (e.g., Kets De Vries, 1988) tend to suggest that followers of such leaders will be
helpless, have low-self esteem, and experience psychological distress. This idea has been
extended to the organizational arena. Conger (1999) suggests that such individuals seek out the
leader’s approval and may become dependent on that approval for feelings of self-worth. Shamir
and colleagues (1993) make no explicit propositions about the level of followers’ self-esteem
prior to the development of the leadership relationship. Rather, they suggest that individuals may
experience a heightened sense of self-esteem when exposed to a transformational leader. From
these data, we cannot reach a conclusion about whether individuals with low self-esteem seek
out transformational leaders. However, we can conclude that such individuals do not appear to be
more responsive to the influence attempts of such leaders in a business setting. Nonetheless,
future research aimed at assessing changes in self-esteem, self-worth, and self-efficacy as a result
of exposure to transformational leaders may be fruitful. For example, if individuals with low

26
self-efficacy or self-esteem begin to perform better when working with a transformational leader,
over time, their improved performance may lead to increased self-esteem and self-efficacy.
Beyond their theoretical relevance, these results have practical significance as well. If the
effects of transformational leadership on followers were found to vary substantially by follower,
the main practical implications of transformational leadership theory would be complex.
Specifically, at present, transformational leadership theory suggests that leaders be trained to
exhibit transformational behaviors, a developmental practice that appears to be effective
(Barling, Weber, & Kelloway, 1996). If follower personality or other individual differences
exhibited important moderating effects, however, “simply” training leaders would not be enough.
Organizations would need to first assess the context to determine whether followers’
personalities were such that they would respond positively to transformational leadership. It
would make little sense to train leaders if followers would not respond to the targeted behaviors.
Furthermore, unless follower personality was consistent across followers within a leader’s span
of control, leader behaviors would need to be tailored to each follower. Thus, the absence of
significant moderating effects for follower characteristics in response to transformational leaders
provides both theoretical and practical support for transformational leadership theory.
Whereas it was not the purpose of our study to replicate the finding of past research (e.g.,
Judge & Bono, 2000) with respect to the effects of transformational leaders on their followers, it
was comforting that the essentially null moderating effects were found in the context of
significant effects of transformational leadership on the outcomes. Followers responded
positively to transformational leaders in both their attitudes and their behaviors, across studies.
These results are especially impressive in that many of the associations we report are immune to
concerns over common method or same source bias, and some were based on data collected over

27
time. Had the effects of transformational leadership not been proven robust, the validity and
generalizability of the non-significant moderators might have been called into question.
Although we did not find evidence that individual differences in personality or intellect
predict responses to transformational leaders, this does not mean that follower personality does
not play a role in the leadership process. For example, it is possible that transformational leaders
may tend to recruit, select, or retain, individuals with certain personality traits. Furthermore,
follower personality may play a role in leadership ratings and leadership attributions. It is
possible that individuals’ personalities may affect the level of the ratings that they give (i.e., rater
leniency), as was found with respect to job performance ratings (Bernardin, Cooke, & Villanova,
2001). Since most measures of transformational leadership are based on follower ratings, this is
an important issue for future research. It is also possible that the some of the differences between
followers in leadership ratings can be explained by follower personality. Finally, our findings
also do not preclude the possibility that leaders’ behaviors are determined in part by the
characteristics of their followers. The purpose of our study was not to address these issues, but
they do represent important areas for future research.
In summary, this study is the first attempt to determine whether the validity of
transformational leadership depends on the characteristics of the followers. Overall, the results
do not support this proposition. Rather, they add to a growing body of literature documenting the
outcomes associated with transformational leadership, across organizations, countries, and
individuals. Whereas there is some evidence (e.g., Waldman Ramirez, House, & Puranam, 2001)
that environmental factors may influence the effectiveness of transformational leaders, our
results indicate that individual differences between followers do not.

28
REFERENCES
Allen, N. J., & Meyer, J. P. 1990. The measurement and antecedents of affective, continuance
and normative commitment to the organization. Journal of Occupational Psychology,
63: 1-18.
Avolio, B. J., Bass, B. M., & Jung, D. I. 1999. Re-examining the components of transformational
and transactional leadership using the Multifactor Leadership Questionnaire. Journal of
Occupational and Organizational Psychology, 72: 441-462.
Barling, J., Weber, T., & Kelloway, E. K. 1996. Effects of transformational leadership training
on attitudinal and financial outcomes: A field experiment. Journal of Applied
Psychology, 81: 827-832.
Bass, B. M. 1985. Leadership and performance beyond expectations. New York: Free Press.
Bass, B. M. 1990. Bass & Stogdill’s handbook of leadership: Theory, research, and
managerial applications (3rd ed.). New York: Free Press.
Bass, B. M. 1995. Theory of transformational leadership redux. Leadership Quarterly, 6: 463-
478.
Bass, B. M. 1997. Does the transactional-transformational leadership paradigm transcend
organizational and national boundaries? American Psychologist, 52: 130-139.
Bernardin, H., Cooke, D., & Villanova, P. 2000. Conscientiousness and agreeableness as
predictors of rating leniency. Journal of Applied Psychology, 85: 232-234.
Borman, W. C., & Motowidlo, S. J. 1993. Expanding the criterion domain to include elements of
contextual performance. In N. Schmitt & W. C. Borman (Eds.), Personnel selection in
organizations: 71-98. San Francisco: Jossey-Bass.
29
Brayfield, A. H., & Rothe, H. F. 1951. An index of job satisfaction. Journal of Applied
Psychology, 35: 307-311.
Brockner, J. 1988. Self-esteem at work: Research, theory, and practice. Lexington, MA:
Lexington Books.
Burns, J. M. 1978. Leadership. New York: Harper & Row.
Bycio, P., Hackett, R. D., & Allen, J. S. 1995. Further assessments of Bass’s (1985)
conceptualization of transactional and transformational leadership. Journal of Applied
Psychology, 80: 468-478.
Carless, S. A. 1998. Assessing the discrimanant validity of transformational leader behavior as
measured by the MLQ. Journal of Occupational and Organizational Psychology, 71:
353-358.
Conger, J. 1999. Charismatic and Transformational Leadership in Organizations: An Insider’s
Perspective on these Developing Streams of Research. Leadership Quarterly, 10: 145-
179.
Conger, J. A., & Kanungo, R. N. 1987. Toward a behavioral theory of charismatic leadership in
organizational settings. Academy of Management Review, 12: 637-647.
Conger, J. A., Kanungo, R. N. 1998. Charismatic Leadership in Organizations. Thousand Oaks,
CA: Sage Publications.
Costa, P. T., Jr., & McCrae, R. R. 1992. Revised NEO Personality Inventory (NEO-PI-R) and
NEO Five-Factor (NEO-FFI) Inventory professional manual. Odessa, FL: PAR.
Dodrill, C. B., & Carner, M. H. 1988. Further studies of the Wonderlic Personnel Test as a brief
measure of intelligence. Journal of Consulting and Clinical Psychology, 56: 145-147.

30
Frese, M., Kring, W., Soose, A., & Zempel, J. 1996. Personal initiative at work: Differences
between east and west Germany. Academy of Management Journal, 39: 37-63.
Goldberg, L. 1999. A broad-bandwidth, public-domain, personality inventory measuring the
lower-level facets of several five-factor models. In I. Mervielde, I. J. Deary, F. De Fruyt,
& F. Ostendorf (Eds.). Personality Psychology in Europe, 7: 7-28.
Hackman, J., & Oldham, G. 1980. Work redesign. Reading, MA: Addison-Wesley.
Hater, J. J., & Bass, B. M. 1988. Superiors’ evaluations and subordinates’ perceptions of
transformational and transactional leadership. Journal of Applied Psychology, 73, 695
Hollander, E. P. 1992. Leadership, followership, self, and others. Leadership Quarterly, 3: 43-
54.
House, R. J. 1977. A 1976 theory of charismatic leadership. In J. G. Hunt & L. L. Larsen (Eds.)
Leadership: The cutting edge. Southern Illinois University Press.
House, R. J., & Shamir, B. 1993. Toward the integration of transformational, charismatic, and
visionary theories. In M. M. Chemers & R. Ayman (Eds.), Leadership theory and
research: Perspectives and directions (pp. 81-107). San Diego: Academic Press.
Howell, J. M., & Avolio, B. J. 1993. Transformational leadership, transactional leadership, locus
of control, and support for innovation: Key predictors of consolidated business-unit
performance. Journal of Applied Psychology, 78: 891-902.
Howell, J. M., & Frost, P. J. 1989. A laboratory study of charismatic leadership. Organizational
Behavior and Human Decision Processes, 43: 243-269.
Howell, J. M., & Hall-Merenda, K. E. 1999. The ties that bind: The impact of leader-member
exchange, transformational and transactional leadership, and distance on predicting
follower performance. Journal of Applied Psychology, 84: 680-689.
31
Judge, T. A., & Bono, J. E. 2000. Five-factor model of personality and transformational
leadership. Journal of Applied Psychology, 85: 751-765.
Kanter, D. L., & Mirvis, P. H. 1989. The cynical Americans: Living and working in an age of
discontent and disillusion. San Francisco: Jossey-Bass.
Kets de Vries, M. F. R. 1988. The leadership mystique. Academy of Management Executive, 8: 73-
92.
Kirkpatrick, S. A., & Locke, E. A. 1996. Direct and indirect effects of three core charismatic
leadership components on performance and attitudes. Journal of Applied Psychology,
81: 36-51.
Kirnan, J. P., & Snyder, B. 1995. Review of the Multifactor Leadership Questionnaire. In J. C.
Conoley & J. C. Impara (Eds.), The twelfth mental measurements yearbook (pp. 651-
654). Lincoln, NE: Buros Institute of Mental Measurements.
Lowe, K. B., Kroeck, K. G., & Sivasubramaniam, N. 1996. Effectiveness correlates of
transformation and transactional leadership: A meta-analytic review of the MLQ
literature. Leadership Quarterly, 7: 385-425.
Mathieu, J. E. 2001. “Into the box” thinking about leadership research. In (S. Zaccaro and R.
Klimoski (Eds) The Nature of Organizational Leadership (pp. 437-463). San Francisco:
Jossey-Bass.
McNatt, D. B. 2000. Ancient Pygmalion joins contemporary management: A meta-analysis of
the result. Journal of Applied Psychology, 85: 314-322.
Pillai, J., & Meindl, J. R. 1998. Context and charisma: A “meso” level examination of the
relationship of organic structure , collectivism and crisis to charismatic leadership.
Journal of Management, 24: 643-671.

32
Podsakoff, P. M., MacKenzie, S. B., & Bommer, W. H. 1996. Transformational leader behaviors
and substitutes for leadership as determinants of employee satisfaction, commitment,
trust, and organizational citizenship behaviors. Journal of Management, 22: 259-298.
Podsakoff, P. M., MacKenzie, S. B., Moorman, R. H., & Fetter, R. 1990. Transformational
leader behaviors and their effects on followers’ trust in leader, satisfaction and
organizational citizenship behaviors. Leadership Quarterly, 1: 107-142.
Rosenberg, M. 1965. Society and the adolescent self-image. Princeton, NJ: Princeton University
Press.
Shamir, B., House, R. J., & Arthur, M. B. 1993. The motivational effects of charismatic
leadership: A self-concept based theory. Organization Science, 4: 577-594.
Shea, C. M., & Howell, J. M. 1999. Charismatic leadership and task feedback: A laboratory
study of their effects on self-efficacy and task performance. Leadership Quarterly, 10:
375-396.
Smith, P. C., Kendall, L. M., & Hulin, C. L. 1969. The measurement of satisfaction in work
and retirement. Chicago: Rand McNally.
Stewart, G. L., Carson, K. P., & Cardy, R. L. 1996. The joint effects of conscientiousness and
self-leadership training on employee self-directed behavior in a service setting.
Personnel Psychology, 49: 143-164.
Waldman, D. A., Ramirez, G. C., House, R. J., Puranam, P. 2001. Does leadership matter? CEO
leadership attributes and profitability under conditions of perceived environmental
uncertainty. Academy of Management Journal, 44: 134-143.
33
Weierter, S. J. M. 1997. Who Wants to Play “Follow the Leader?” A theory of charismatic
relationships based on routinized charisma and follower characteristics. Leadership
Quarterly, 8: 171-193.
Welbourne, T. M., Johnson, D. E., & Erez, A. 1998. The role-based performance scale: Validity
analysis of a theory-based measure. Academy of Management Journal, 41: 540-555.
Wonderlic, E. F. 1983. Wonderlic Personnel Test Manual. Northfield, IL: E. F. Wonderlic &
Assoc.
Yammarino, F. J., Dubinsky, A J., Comer, L. B., & Jolson, M. A. 1997. Women and
transformational and contingent reward leadership: a multiple level perspective. Academy
of Management Journal, 40: 205-222.
34
TABLE 1
Means (M), Standard Deviations (SD), and Intercorrelations of Study 1 Variables Variable M SD 1 2 3 4 5 6 7 8 9 10 11 1. Transformational leadership 3.95 .41 .82
2. Intellect 3.69 .65 .23 .86
3. Trust 3.82 .64 .20 .06 .90
4. Cynicism 3.04 .82 -.11 -.05 -.51 .88
5. Supervisor satisfaction 4.16 .78 .45 .01 .16 -.08 .87
6. Overall job satisfaction 4.12 .66 .29 .13 .35 -.34 .32 .86
7. Organizational commitment 3.71 .75 .30 .06 .39 -.25 .35 .53 .88
8. Motivation 4.04 .54 .39 .04 .17 -.14 .67 .30 .34 .71
9. Task performance 4.25 .75 .38 .05 .16 -.16 .19 .21 .12 .13 .88
10. Contextual performance 4.02 .76 .45 .13 .17 -.16 .24 .23 .19 .21 .71 .92
11. Overall job performance 4.20 .80 .41 .04 .11 -.14 .26 .16 .10 .20 .84 .77 .88 Notes: Variables 2-11 are for Follower #1. Reliabilities are on the diagonal in bold. Correlations greater than .19 are significant at the
.01 level. Correlations greater than .15 are significant at the .05 level. Listwise N=171.

35
TABLE 2
Moderating Effect of Personality on Affective Responses to Transformational Leadership Independent variables
Supervisor
Satisfaction
Overall Job
Satisfaction
Organizational
Commitment Intellect (A) -.07 .13 .05 Transformational leadership (B) .47** .24** .31** A!B -.05 -.13 .03 "R2 .002 .017 .001 Trust (A) .05 .30** .36** Transformational leadership (B) .43** .20** .27** A!B -.07 -.04 .11 "R2 .003 .001 .010 Cynicism (A) -.07 -.38** -.26** Transformational leadership (B) .43** .18** .26** A!B -.09 -.20** -.09 "R2 .007 .032** .007 Notes: Statistics in the first three rows for each variable are standardized regression (#) coefficients. The fourth row ("R2) for each
variable represents the change in R2 for the interaction. * p < .05. ** p < .01.

36
TABLE 3
Moderating Effect of Personality on Behavioral Responses to Transformational Leadership Independent variables
Motivation
Task
Performance
Contextual
Performance
Overall Job
Performance Intellect (A) .00 -.04 .04 -.06 Transformational leadership (B) .43** .38* .42** .42** A!B .07 -.07 -.07 -.01 "R2 .005 .005 .005 .000 Trust (A) .14* .08 .09 .02 Transformational leadership (B) .37** .35** .45** .39** A!B -.07 -.04 .06 -.05 "R2 .005 .001 .003 .002 Cynicism (A) -.11 -.10 -.13 -.10 Transformational leadership (B) .42** .38** .42** .39** A!B .04 .03 -.07 -.03 "R2 .001 .000 .005 .000 Notes: Statistics in the first three rows for each variable are standardized regression (#) coefficients. The fourth row ("R2) for each
variable represents the change in R2 for the interaction. * p < .05. ** p < .01.

37
TABLE 4
Replication with Follower #2 and Full Study Sample Follower 2 (N=150) Complete Data (N=416) ! "R2 ! "R2 Intellect Supervisor satisfaction .24** .052** .06 .003 Overall job satisfaction .16** .023** .03 .001 Organizational commitment .12 .013 .08 .006 Motivation .14** .017** .09* .008** Task performance -.02 .000 -.03 .001 Contextual performance -.03 .001 -.04 .001 Overall performance .00 .000 -.02 .000 Trust Supervisor satisfaction .22** .042** .06 .002 Overall job satisfaction .01 .000 .00 .000 Organizational commitment .05 .002 .05 .002 Motivation .16** .022** .03 .001 Task performance -.03 .000 -.02 .000 Contextual performance -.04 .001 .00 .000 Overall performance -.05 .002 -.02 .000 Cynicism Supervisor satisfaction -.07 .003 -.05 .002 Overall job satisfaction -.02 .000 -.08 .007 Organizational commitment -.09 .006 -.05 .003 Motivation .04 .002 .04 .001 Task performance -.01 .000 .02 .001 Contextual performance .07 .003 .00 .000 Overall performance .04 .000 .01 .000 Notes: ! coefficients represent standardized coefficient of interaction term when interaction was entered on second step (after main effects of transformational leadership and follower personality). "R2 represents associated incremental increase in variance explained. * p < .05. ** p < .01.
38
TABLE 5
Means (M), Standard Deviations (SD), and Intercorrelations of Study 2 Variables Variable M SD 1 2 4 5 6 7 8 1. Transformational leadership 3.66 .50 .83
2. Self-esteem 4.15 .57 .01 .84
3. Supervisor satisfaction 3.68 .98 .52 -.02 .90
4. Overall job satisfaction 3.84 .68 .17 .31 .33 .84
5. Organizational commitment 3.50 .72 .28 .25 .42 .66 .85
6. Initiative performance 0.00 1.00 .21 -.01 .40 .30 .26 .91
7. Overall job performance 0.00 1.00 .12 -.02 .40 .20 .19 .81 .89 Notes: Variables 2-8 are for “first” follower. Reliabilities are on the diagonal in bold. Correlations greater than .20 are significant at
the .01 level. Correlations greater than .16 are significant at the .05 level. Listwise N=170.

39
TABLE 6
Moderating Effect of Personality on Responses to Transformational Leadership – Full Study 2 Sample Independent variables
Supervisor
Satisfaction
Overall Job
Satisfaction
Organizational
Commitment
Initiative
Performance
Overall
Performance Self-esteem (A) .08* .32** .27** .06 .05
Transformational leadership (B) .40** .13** .22** .14* .05
A!B -.01 -.01 -.04 -.04 -.06
" R2 .000 .000 .001 .001 .003 Notes: Statistics in the first three rows for each variable are standardized regression (#) coefficients. The fourth row for each variable
represents the change in R2 for the interaction. * p < .05. ** p < .01. N=661.

40
TABLE 7
Means (M), Standard Deviations (SD), and Intercorrelations of Study 3 Variables Variable M SD 1 2 3 4 5 6 7 8 9 1. Transformational leadership --- --- ---
2. Self-esteem 4.2 .59 -.11 .84
3. General mental ability 25.4 4.70 -.11 -.00 ----
4. Leader satisfaction 3.6 .95 .29 -.05 -.07 .77
5. Task satisfaction 1.6 .37 .38 -.09 -.19 .49 .87
6. Motivation 3.6 .87 .19 -.21 .03 .31 .43 .90
7. Initiative performance .4 1.60 .19 .11 -.03 .09 .14 .18 ---
8. Creative performance 4.8 2.60 .20 -.02 .01 -.03 .08 .22 .23 .72
9. Accuracy performance 16.5 7.70 -.03 -.12 .30 .01 .06 .32 .06 -.02 ---
Notes: Reliabilities are on the diagonal in bold. Transformational leadership is coded by experimental condition (1=non-
transformational condition, 2=transformational condition). Correlations greater than .17 are significant at the .05 level. Correlations
greater than .21 are significant at the .01 level. Listwise N=144.