1 revision 2 2 american mineralogist · 1 1 revision 2 2 3 american mineralogist 4 5 characterizing...
TRANSCRIPT
1
Revision 2 1 2
American Mineralogist 3 4
Characterizing Low-Temperature Aqueous Alteration of Mars-Analog Basalts from 5 Mauna Kea at Multiple Scales 6
7 Brandon P. Rasmussen
1,*, Wendy M. Calvin
1, Bethany L. Ehlmann
2,5, Thomas 8
F. Bristow3, Nicole Lautze
4, Abigail A. Fraeman
5 , Joel W. 9
DesOrmeau1 10
11 1 Department of Geological Sciences, University of Nevada, Reno, NV 89577, USA 12
13 2 Division of Geological and Planetary Sciences, California Institute of Technology, Pasadena, CA 91125, 14
USA 15 16
3 NASA Ames Research Center, Moffett Field, CA 94035, USA 17 18
4 School of Ocean and Earth Science and Technology, University of Hawaii at Manoa, Honolulu, HI 96822, 19 USA 20
21 5 Jet Propulsion Laboratory, California Institute of Technology, Pasadena, CA 91109, USA 22
23 * E-mail: [email protected] 24
25 26
Abstract 27
28
We performed a multi-scale characterization of aqueous alteration of Mars analog 29
basaltic rock from a Mauna Kea drill core using high-resolution visible and short-wave 30
infrared (VIS-SWIR) spectral imaging, scanning electron microscopy, X-ray diffraction, 31
and point VIS-SWIR spectra. Several types of smectites, zeolites, and primary minerals 32
were identified. Mineral classes were mapped in cut sections extracted from the drill core 33
and used to represent the range of alteration products seen in field data collected over 34
1000m depth (Calvin et al., in press). Ten distinct spectral endmembers identified in the 35
cut sections were used to map the field point spectra. Trioctahedral Fe- and Mg-rich 36
smectites were present towards the top of the zone of analysis (972 m below the surface) 37
This is the peer-reviewed, final accepted version for American Mineralogist, published by the Mineralogical Society of America. The published version is subject to change. Cite as Authors (Year) Title. American Mineralogist, in press.
DOI: https://doi.org/10.2138/am-2020-7131. http://www.minsocam.org/
Always consult and cite the final, published document. See http:/www.minsocam.org or GeoscienceWorld

2
and increased in abundance towards the bottom of the drill core (1763 m depth). The 38
mineralogy demonstrates a general trend of discontinuous alteration that increases in 39
intensity with depth, with less pervasive phyllosilicate alteration at the top, several zones 40
of different mixtures of zeolites towards the center, followed by more abundant 41
phyllosilicates in the lowest sections. Distinctly absent are Fe-Mg phyllosilicates other 42
than smectites, as well as carbonates, sulfates, and Al phyllosilicates such as kaolinite or 43
illite. Furthermore, hematite was only detected in two of 24 samples. The suite of 44
assemblages points to aqueous alteration at low to moderate temperatures at neutral to 45
basic pH in low-oxygen conditions, with little evidence of extensive surface interaction, 46
presenting a possible analog for an early Mars subsurface environment. We also present a 47
library of VIS-SWIR spectra of the analyzed cut sections including both spatial averages 48
(i.e., unweighted linear mixtures) of spectral images of each cut section and single point 49
spectra of the cut sections. This will allow for consideration of nonlinear mixing effects in 50
point spectra of these assemblages from natural surfaces in future terrestrial or planetary 51
work. 52
53
Keywords: visible to short-wave infrared spectroscopy, X-ray diffraction, scanning 54
electron microscopy, Mars analog, natural zeolites, Mg/Fe smectites, aqueous 55
alteration 56
57
58
59
60
61
This is the peer-reviewed, final accepted version for American Mineralogist, published by the Mineralogical Society of America. The published version is subject to change. Cite as Authors (Year) Title. American Mineralogist, in press.
DOI: https://doi.org/10.2138/am-2020-7131. http://www.minsocam.org/
Always consult and cite the final, published document. See http:/www.minsocam.org or GeoscienceWorld

3
62 Introduction 63
VIS-SWIR spectroscopy can detect absorptions of most aqueous alteration 64
minerals and many primary minerals that result from a variety of processes and thus 65
provides valuable mineralogical information. Zeolites are identified by vibrational 66
absorptions associated with H2O near 0.97, 1.40, and 1.90 μm while smectites are 67
identified by combinations of H2O (1.40, 1.90 μm), OH (~1.40 μm), and several metal-68
OH combination bands, which vary in position from ~2.20-2.32 μm based on 69
composition and structure (e.g. Clark, 1990a). Pyroxenes, iron oxides, and olivine are 70
identified by broad absorptions related to electronic processes involving electrons in Fe 71
and their energy state transitions (e.g. Hunt, 1977). However, overlapping or similar 72
vibrational absorption features of mineral phases are common, so other methods are often 73
required to provide complete mineralogical characterization; this is especially true for 74
mineral assemblages. The absorptions discussed in this paper are well documented and 75
library spectra are available from the USGS (Clark, 1990a; Kokaly et al., 2017), though 76
modifications of these absorptions by compositional and structural differences is still an 77
active area of study. 78
With the Compact Reconnaissance Imaging Spectrometer for Mars (CRISM) 79
instrument aboard the Mars Reconnaissance Orbiter (MRO), orbital VIS-SWIR spectra 80
achieved the unprecedented resolution at Mars of 18m/pixel in targeted mode. This 81
resolution allows for interpretations of single, outcrop-sized areas and for more robust 82
inspection of lower-concentration minerals (Murchie et al., 2007). Multiple recent papers 83
by the CRISM team and their collaborators revealed that Martian secondary alteration is 84
both spatially and temporally heterogeneous (e.g., Ehlmann and Edwards, 2014). Several 85
different phases that formed from aqueous alteration have been studied in hundreds of 86
This is the peer-reviewed, final accepted version for American Mineralogist, published by the Mineralogical Society of America. The published version is subject to change. Cite as Authors (Year) Title. American Mineralogist, in press.
DOI: https://doi.org/10.2138/am-2020-7131. http://www.minsocam.org/
Always consult and cite the final, published document. See http:/www.minsocam.org or GeoscienceWorld

4
locations on Mars, and genetic alteration mechanisms have been suggested to range from 87
impact and shock generated material, to low-temperature metamorphism or hydrothermal 88
activity, to neutral or acidic ground or surface water interaction (e.g., Bishop et al., 2008; 89
Ehlmann et al., 2011a,b; Catalano, 2013; Tornabene et al., 2013; Michalski et al., 2013; 90
Carter et al., 2013; Cannon et al., 2017; Carrozzo et al., 2017). Specific phases tied to 91
these genetic origins by Mars analog work on Earth are hydrated silicates, carbonates, 92
phyllosilicates, Fe-oxides, and sulfates, all of which have been spectrally identified on 93
Mars from orbit and ground truthed by rovers (e.g., Bibring et al., 2006; Ehlmann et al., 94
2009; Morris et al., 2010; Ehlmann and Edwards, 2014; Arvidson et al., 2014; Vaniman 95
et al., 2014; Rampe et al., 2017). 96
These alteration minerals provide evidence for occurrences of specific surface 97
and subsurface processes on Mars, many of which can produce environments habitable 98
for microbial life. A challenge is deciphering what environmental conditions the mineral 99
assemblages on Mars represent, especially for common phases like Fe/Mg smectites, 100
which can form in multiple environments. Through laboratory measurements of analog 101
samples, we can observe the spectral properties of mineral assemblages, identify specific 102
constituent alteration minerals and their spectral properties, and use these data to provide 103
constraints on their environments of formation. This allows for comparison with spectra 104
from Mars with implications for better understanding alteration in Martian environments. 105
Here, we examine rock from drill core into Hawaiian basalts. These mafic flows were 106
sequentially erupted onto the surface and later altered by water and provide an analog for 107
aqueous alteration processes in the subsurface of ancient Mars. We utilize VIS-SWIR 108
spectroscopy, X-ray diffraction (XRD), and scanning electron microscopy on cut sections 109
of core and relate the spectral properties back to the field spectral data. 110
This is the peer-reviewed, final accepted version for American Mineralogist, published by the Mineralogical Society of America. The published version is subject to change. Cite as Authors (Year) Title. American Mineralogist, in press.
DOI: https://doi.org/10.2138/am-2020-7131. http://www.minsocam.org/
Always consult and cite the final, published document. See http:/www.minsocam.org or GeoscienceWorld
5
111
Previous Martian Analog Alteration Studies 112
There have been many terrestrial analog studies of natural, Mars-relevant 113
alteration phases and mineral assemblages to help identify secondary minerals and 114
interpret environments on Mars. Many studies focus on the alteration of basalt and the 115
formation of smectite because Mars is primarily basaltic and smectite is a common 116
secondary mineral. In-depth spectral and geochemical analyses of an analog Martian 117
smectite similar to one observed in situ at Gale Crater were carried out by Treiman et al. 118
(2014). This ferrian saponite exhibited a similar XRD pattern to a smectite studied in-situ 119
at Yellowknife Bay using the CheMin instrument onboard the Mars Science Laboratory, 120
suggesting that most of the octahedral Fe2+ in the Martian smectite had similarly been 121
oxidized to Fe3+. However, geological context of the studied samples is not well-defined 122
as the samples were gathered at a field location which is no longer accessible. The 123
saponite is thought to have formed diagenetically in a marine environment as a vesicle 124
fill in basalt (Treiman et al., 2014), so the formation environment is not identical to that 125
of the lacustrine mudstone at Yellowknife Bay (Grotzinger et al., 2014). 126
Many Mars analog studies have been focused on minerals at the surface or near 127
surface and have inspected surface hydrothermal systems, impact sites, or groundwater-128
facilitated alteration that has been exposed to the surface environment through erosion 129
(e.g., Bishop and Murad, 2002; Greenberger et al., 2012; Ehlmann et al., 2012; Hadnott 130
et al., 2017). Mauna Kea has been studied in the near surface environment by both 131
remote sensing and field methods (e.g., Morris et al., 2005; Guinness et al., 2007; 132
McCanta et al., 2014), and palagonitic tephra from Mauna Kea’s surface has been used 133
for decades as a Mars soil simulant since early work identified it as spectrally similar to 134
This is the peer-reviewed, final accepted version for American Mineralogist, published by the Mineralogical Society of America. The published version is subject to change. Cite as Authors (Year) Title. American Mineralogist, in press.
DOI: https://doi.org/10.2138/am-2020-7131. http://www.minsocam.org/
Always consult and cite the final, published document. See http:/www.minsocam.org or GeoscienceWorld

6
bright regions on Mars (Morris et al., 1990). We probe a less-studied part of the volcanic 135
stratigraphy and note a different suite of mineral assemblages than in surface exposures. 136
Studying synthetic Mars analog minerals is also valuable for interpreting ancient 137
aqueous environments on Mars and identifying likely formation conditions. Chemtob et 138
al. (2015) characterized synthetic trioctahedral smectites both chemically and spectrally, 139
and oxidation effects on the VIS-SWIR spectra and XRD patterns of smectites were 140
studied by Chemtob et al. (2017). Chemtob et al. (2017) demonstrated that the abundant 141
ferrian smectites observed from orbital data could be formed from oxidation of ferrous 142
smectites. The formation of synthetic Fe-Mg smectites in oxidizing conditions was 143
examined by Gainey et al. (2017); results showed that both dioctahedral and trioctahedral 144
phases could form in basic, oxygen-rich conditions, given the presence of Fe3+ and either 145
Mg2+ or Fe2+. However, Viennet et al. (2017) showed that while pH has little influence 146
on saponite formation, the presence of zeolites implies pH ~> 7.2, and increasing acidity 147
implies more trioctahedral chlorite formation versus saponite. These studies illustrate that 148
characterizing the entire secondary mineral assemblage is necessary for understanding 149
early Martian geochemical and atmospheric conditions. 150
Our methodology is derived from a combination of approaches that have worked 151
well in the past for identifying secondary minerals. Field-collected point-spectra provide 152
a rapid characterization of bulk alteration mineralogy changes and are compared with 153
more traditional, time consuming methods such as XRD, optical microscopy, and 154
geochemical analyses (Calvin and Pace, 2016). This allows for targeting areas of interest 155
for examining small scale spatial relationships through petrographic thin section work 156
(see Calvin et al., in press) and spectral imaging and directly comparing spectral data 157
with compositional information from scanning electron microscopy (Greenberger et al., 158
This is the peer-reviewed, final accepted version for American Mineralogist, published by the Mineralogical Society of America. The published version is subject to change. Cite as Authors (Year) Title. American Mineralogist, in press.
DOI: https://doi.org/10.2138/am-2020-7131. http://www.minsocam.org/
Always consult and cite the final, published document. See http:/www.minsocam.org or GeoscienceWorld

7
2015; Leask and Ehlmann, 2016). Bulk and clay-fraction XRD then allows for 159
identification of species which are spectrally and/or compositionally similar. 160
This analysis contributes a unique study of alteration of basalts in a subsurface 161
environment sheltered from direct atmospheric or seawater interaction and combines 162
multiple methods to observe small-scale and large-scale distributions, macro and 163
microscopic textural and spectral information, and mineral associations as a Mars analog. 164
We then tie the interpretations of formation conditions back to specific VIS-SWIR 165
absorption features to allow for broad applicability to other studies with the fast, non-166
destructive method of VIS-SWIR spectroscopy. 167
168
HGRP Samples and Geologic Context 169
170
The Humu’ula Groundwater Research Project (HGRP) drilled the 171
continuously-cored hole PTA-2 in the saddle region of the Big Island of Hawaii in 2013, 172
searching for groundwater resources. The core traverses much of the shield building 173
phase of Mauna Kea, intersecting variably textured basaltic lava flows, explosive units, 174
intrusive units, and sedimentary units. This study focuses on the basaltic lava portions of 175
the stratigraphy, which make up the majority (>90%) of the core. Jerram et al. (2019) 176
describe wireline logging and imaging of PTA-2. Calvin et al. (in press) further describe 177
the geologic setting and drilling history for the study samples. As described in that paper, 178
initial field measurements collected 780 VIS-SWIR point spectra over 791m, yielding 179
eight distinct spectral types representing mineral assemblages at spot sizes of 1.5cm in 180
diameter. These were used to select 25 cut sections that were subject to additional 181
analyses as described in this work (one cut section was too small for XRD analysis). The 182
This is the peer-reviewed, final accepted version for American Mineralogist, published by the Mineralogical Society of America. The published version is subject to change. Cite as Authors (Year) Title. American Mineralogist, in press.
DOI: https://doi.org/10.2138/am-2020-7131. http://www.minsocam.org/
Always consult and cite the final, published document. See http:/www.minsocam.org or GeoscienceWorld

8
eight spectral endmembers included primary mafic minerals (augite and augite with 183
olivine) and alteration minerals, which included three types of phyllosilicates and three 184
types of zeolites. 185
186
Methods 187
Spectral Data Collection 188
189
Twenty-five small (~2x3 cm) cut sections were measured with the same point 190
spectrometer used in the preliminary study (Calvin et al., in press), and eight samples 191
were selected for measurement at the Jet Propulsion Laboratory (JPL) with the Ultra 192
Compact Imaging Spectrometer (UCIS) (Van Gorp et al., 2014). These eight samples 193
were chosen as discussed by Calvin et al. based on petrographic analysis of thin sections 194
and the field spectral survey, which concluded that the breadth of aqueous alteration 195
mineralogy of the core was well represented across these eight samples. 196
Through the use of different front optics, the UCIS spectrometer can operate in 197
either a telescopic or microscopic imaging mode suitable for analyzing meter-scale 198
outcrops in the field or centimeter-scale laboratory samples, respectively. In the 199
microimaging mode utilized in this study, UCIS collects spectra from samples at 81 200
µm/pixel across 213 discrete wavelengths from 0.5 – 2.5 µm (roughly the same range as 201
the field-collected point spectra). The spectral resolution is approximately 10 nm. A 202
single scan over a ~3 cm x 3 cm area takes ~1 minute to complete. A spectralon 203
calibration target placed on the stage is used to calibrate each cut section image to 204
reflectance. The sample spectrum is divided by the calibration target spectrum and 205
multiplied by the spectral properties of spectralon to obtain an absolute reflectance. Due 206
This is the peer-reviewed, final accepted version for American Mineralogist, published by the Mineralogical Society of America. The published version is subject to change. Cite as Authors (Year) Title. American Mineralogist, in press.
DOI: https://doi.org/10.2138/am-2020-7131. http://www.minsocam.org/
Always consult and cite the final, published document. See http:/www.minsocam.org or GeoscienceWorld

9
to low signal-to-noise ratio (SNR) from generally low albedo targets at very high spatial 207
resolution, all UCIS images were averaged 3x3 spatially to improve spectral mapping 208
capabilities, resulting in an effective pixel size of ~240 µm for images used in this study. 209
210
Spectral Matching Methods 211
212
Micro-imaging spectroscopy was used to obtain a mineral map of the entire 213
surface of each of the eight samples. First, spectral variability and resulting endmember 214
minerals and mineral mixtures were identified via the three preliminary spectral data 215
products (spectral angle, decorrelation stretch, feature fitting) discussed in the following 216
paragraphs. These in-scene endmembers (Figure 1) were then used to produce the final 217
mineral maps (true color images in Figure 2, final maps in Figure 3), and multiple depth 218
profile “images” of the core from the 780 field spectra (Figure 4). 219
Initial spectral matching and all following mapping methods were performed 220
using the ENVI software package on both the micro-imaging spectroscopy dataset, and 221
the 780 field-collected point spectra. The eight, spatially downsampled UCIS cut sections 222
were mosaicked together into a single image, and the endmembers identified from the 223
field data (Calvin et al., in press) were used as an initial set of spectra to classify the 224
UCIS images. Spectral angle mapping (SAM) of the 1.70-2.45 μm region, and 225
decorrelation stretching (DCS) of channels at 1.70, 1.91, and 2.15 μm were performed to 226
observe spectral variability and extract initial spectral endmembers from the cut sections. 227
SAM is a commonly used method in imaging spectroscopy in which each pixel is 228
represented as a vector and the angle between reference spectra and each pixel is 229
calculated as a measure of similarity. DCS removes inter-band correlation between 230
This is the peer-reviewed, final accepted version for American Mineralogist, published by the Mineralogical Society of America. The published version is subject to change. Cite as Authors (Year) Title. American Mineralogist, in press.
DOI: https://doi.org/10.2138/am-2020-7131. http://www.minsocam.org/
Always consult and cite the final, published document. See http:/www.minsocam.org or GeoscienceWorld
10
selected channels by stretching principal component values before an inverse transform, 231
and emphasizes spatial variability (Campbell, 1996). Endmember spectra from the 232
samples were compared to spectra from the USGS spectral library (Kokaly et al., 2017) 233
that had been resampled to UCIS wavelengths. The one phyllosilicate endmember 234
without a good match in the USGS library was identified via decorrelation stretching and 235
extracted from UCIS data. After resampling the USGS spectra to the same wavelengths 236
as the UCIS spectra, spectral feature fitting (SFF) was performed using the USGS spectra 237
and the one unique UCIS spectrum as reference data. SFF fits continuum-removed target 238
spectra to continuum-removed pixels in the image, using a least squares optimization 239
(Clark 1990b). The algorithm was originally designed for fitting single, complex features 240
but has been shown to be effective across multiple features (Clark et al., 1991). The 241
RMSE between the best-fit reference spectrum and the pixel is then thresholded to 242
produce a classified image. 243
Final mapping was guided using a combination of these three data products 244
(SAM, DCS, and USGS-spectra SFF), and compositional information gained from 245
scanning electron microscopy (SEM). Mineral identification of the spectral endmembers 246
was guided by comparison to USGS library spectra, EDS-derived data, and other 247
published spectral data. 248
249
Spectral Mapping 250
251
Final mapping of the cut sections was accomplished using SFF and in-scene 252
pixels from UCIS data as targets. This was because the USGS library spectra lacked 253
representative secondary absorption features. These features included broad absorptions 254
This is the peer-reviewed, final accepted version for American Mineralogist, published by the Mineralogical Society of America. The published version is subject to change. Cite as Authors (Year) Title. American Mineralogist, in press.
DOI: https://doi.org/10.2138/am-2020-7131. http://www.minsocam.org/
Always consult and cite the final, published document. See http:/www.minsocam.org or GeoscienceWorld
11
in the visible and near-infrared (VNIR) for phyllosilicates due to Fe absorptions and 255
compositionally dependent SWIR features not represented in the library (i.e., the 2.245 256
μm absorption in one endmember discussed later) (Figure 1). Two specific endmembers 257
are also identified as mixtures (Figure 1) and thus have no representative match in the 258
USGS library. 259
Unlike in the initial SAM, where a single angle tolerance was applied to all 260
images, different RMSE tolerances and wavelength-mapping ranges were used to 261
specifically target wavelength ranges most characteristic of specific minerals for SFF. 262
The zeolites were mapped using features within the 0.9-2.15 μm range, the 263
phyllosilicates within the 1.30-2.45 μm range, and the primary mafic minerals within the 264
0.5-1.70 μm range. In the case of a fibrous zeolite identified with the SEM in the SR-618 265
cut section, pixels were hand-selected for the class as the UCIS signal was too low to 266
result in a good automated match. Spectral imaging also reported unclassified pixels, 267
without the diagnostic absorptions, which were typically empty vesicles, plagioclase, or 268
certain primary iron oxides. 269
Finally, a profile of relative mineral abundance vs. depth was obtained for the 270
field data through linear unmixing of the 780 point spectra using averaged endmember 271
pixels from UCIS. A singular value decomposition-based approach was used as 272
described by Boardman (1989) with a unity constraint on endmember abundance, i.e. the 273
constraint that the sum of the abundances of all the endmembers must equal 1. 274
Endmembers are shown in Figure 1, and the results are shown in Figure 4 as “core-stack 275
images”, which are further described below. While it is understood that non-linear 276
mixing effects occur in VIS-SWIR spectra of mineral assemblages (Hapke, 1981), we 277
provide these data only as rough abundances for the sake of visualization. 278
This is the peer-reviewed, final accepted version for American Mineralogist, published by the Mineralogical Society of America. The published version is subject to change. Cite as Authors (Year) Title. American Mineralogist, in press.
DOI: https://doi.org/10.2138/am-2020-7131. http://www.minsocam.org/
Always consult and cite the final, published document. See http:/www.minsocam.org or GeoscienceWorld

12
279
Scanning Electron Microscopy Data Collection 280
281
Preparation of the previously analyzed cut sections for SEM-EDS analysis 282
presented many challenges due to the vesicular nature of basalt and its pervasive 283
alteration in some portions of the core. The cut sections were trimmed parallel to a thin-284
section (dimensions of ~27 x 46 mm) before polishing all eight samples. The samples 285
were polished through a series of grit sizes (from 30μm to 1 μm) with silicon carbide 286
followed by a final polish with diamond paste to ensure a flat surface for sufficient and 287
uniform X-ray count rates for EDS mapping of elemental composition. 288
Carbon-coated cut sections (~1-2 mm thickness) were examined on a JEOL 289
6010LA W-filament SEM at the University of Nevada, Reno for textures and 290
morphology at a range of magnifications (~40–7000x). Select areas of samples were 291
mapped by EDS for local elemental composition mapping. Areas were selected to 292
capture the entire range of alteration mineral diversity characterized from the UCIS data. 293
EDS analyses were generally performed at a lower magnification (50x to 190x) and 294
focused on identifying elemental abundances to a few percent relative accuracy within 295
alteration products in order to aid in mineral identification. 296
297
X-Ray Diffraction Data Collection 298
299
Bulk XRD analyses of 24 samples distributed throughout the core (Table 1) were 300
performed on a Rigaku Smartlab diffractometer at NASA Ames Research 301
Center. Samples were ground with a pestle and mortar to less than 120 μm, before being 302
This is the peer-reviewed, final accepted version for American Mineralogist, published by the Mineralogical Society of America. The published version is subject to change. Cite as Authors (Year) Title. American Mineralogist, in press.
DOI: https://doi.org/10.2138/am-2020-7131. http://www.minsocam.org/
Always consult and cite the final, published document. See http:/www.minsocam.org or GeoscienceWorld

13
milled for 5 minutes with ethanol in a McCrone XRD-mill, equipped with zirconium 303
grinding elements. Milled slurries were dried before side-packing the resulting powders 304
into holders. XRD patterns were collected using a scintillation detector with Cu Kα 305
radiation. Patterns were collected between 2º<2θ<65º 2θ in 0.02º steps, counting for 2 306
seconds per step. Minerals were identified using Jade MDI software. Relative mineral 307
abundances of clay minerals were estimated from patterns by Rietveld refinement using 308
BGMN software (Bergmann et al., 1998) (Table 1). UCIS-imaged samples were 309
examined on a later date using the same methods. Randomly oriented, and both air dried 310
as well as glycolated oriented preparations of the <0.5 μm fraction (separated by 311
centrifugation) of a subset of sample powders were also measured by the Rigaku 312
Smartlab instrument to characterize phyllosilicate structures (Appendix Figure 4). 313
314
Results 315
316
Ten spectral endmembers were identified in the UCIS data via the microimaging 317
spectroscopy methods discussed above and cross-checked with SEM and bulk XRD. 318
Four different primary endmembers and six alteration endmembers were found across the 319
eight cut-sections. These endmembers are shown as averages of classified UCIS pixels in 320
Figure 1. 321
The primary endmembers included two spectrally distinct pyroxenes, olivine, and 322
a mixture of fine-grained primary minerals with iron oxides. The two pyroxenes showed 323
strong, characteristic absorptions near 1 μm, one centered at ~0.99μm and the other at 324
1.02μm, a 3-channel difference. The endmember with the shorter wavelength absorption 325
(“fine-grained augite”) ((Ca,Na)(Mg,Fe,Al,Ti)(Si,Al)2O6) was more dispersed throughout 326
This is the peer-reviewed, final accepted version for American Mineralogist, published by the Mineralogical Society of America. The published version is subject to change. Cite as Authors (Year) Title. American Mineralogist, in press.
DOI: https://doi.org/10.2138/am-2020-7131. http://www.minsocam.org/
Always consult and cite the final, published document. See http:/www.minsocam.org or GeoscienceWorld
14
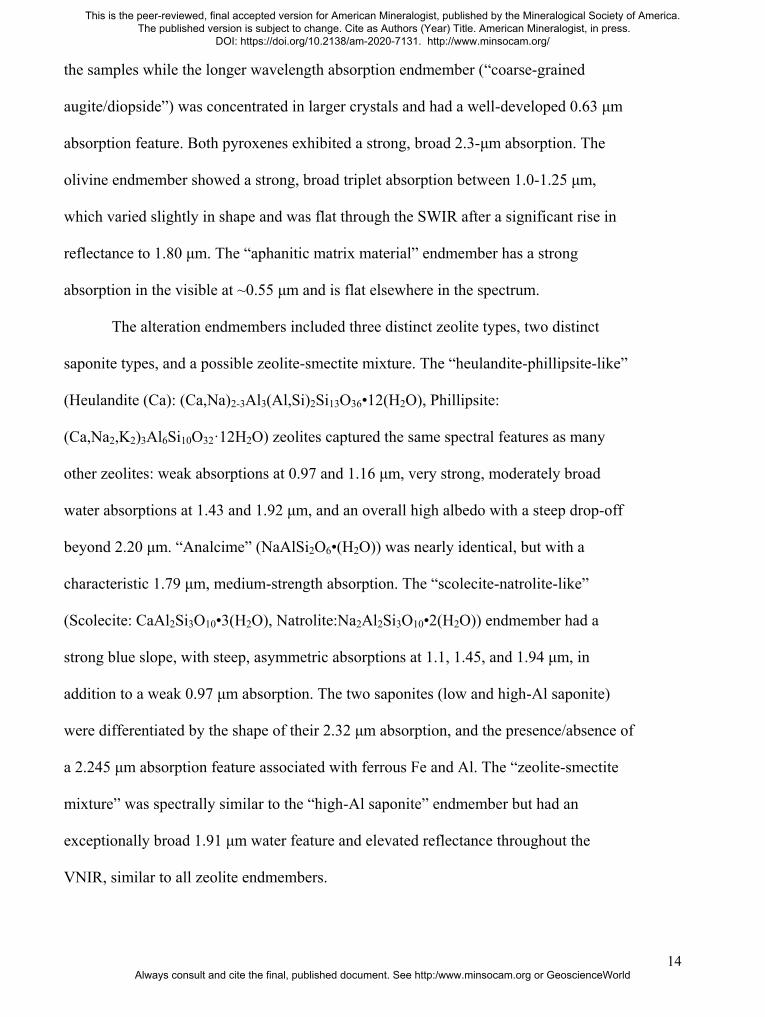
the samples while the longer wavelength absorption endmember (“coarse-grained 327
augite/diopside”) was concentrated in larger crystals and had a well-developed 0.63 μm 328
absorption feature. Both pyroxenes exhibited a strong, broad 2.3-μm absorption. The 329
olivine endmember showed a strong, broad triplet absorption between 1.0-1.25 μm, 330
which varied slightly in shape and was flat through the SWIR after a significant rise in 331
reflectance to 1.80 μm. The “aphanitic matrix material” endmember has a strong 332
absorption in the visible at ~0.55 μm and is flat elsewhere in the spectrum. 333
The alteration endmembers included three distinct zeolite types, two distinct 334
saponite types, and a possible zeolite-smectite mixture. The “heulandite-phillipsite-like” 335
(Heulandite (Ca): (Ca,Na)2-3Al3(Al,Si)2Si13O36•12(H2O), Phillipsite: 336
(Ca,Na2,K2)3Al6Si10O32·12H2O) zeolites captured the same spectral features as many 337
other zeolites: weak absorptions at 0.97 and 1.16 μm, very strong, moderately broad 338
water absorptions at 1.43 and 1.92 μm, and an overall high albedo with a steep drop-off 339
beyond 2.20 μm. “Analcime” (NaAlSi2O6•(H2O)) was nearly identical, but with a 340
characteristic 1.79 μm, medium-strength absorption. The “scolecite-natrolite-like” 341
(Scolecite: CaAl2Si3O10•3(H2O), Natrolite:Na2Al2Si3O10•2(H2O)) endmember had a 342
strong blue slope, with steep, asymmetric absorptions at 1.1, 1.45, and 1.94 μm, in 343
addition to a weak 0.97 μm absorption. The two saponites (low and high-Al saponite) 344
were differentiated by the shape of their 2.32 μm absorption, and the presence/absence of 345
a 2.245 μm absorption feature associated with ferrous Fe and Al. The “zeolite-smectite 346
mixture” was spectrally similar to the “high-Al saponite” endmember but had an 347
exceptionally broad 1.91 μm water feature and elevated reflectance throughout the 348
VNIR, similar to all zeolite endmembers. 349
This is the peer-reviewed, final accepted version for American Mineralogist, published by the Mineralogical Society of America. The published version is subject to change. Cite as Authors (Year) Title. American Mineralogist, in press.
DOI: https://doi.org/10.2138/am-2020-7131. http://www.minsocam.org/
Always consult and cite the final, published document. See http:/www.minsocam.org or GeoscienceWorld
15
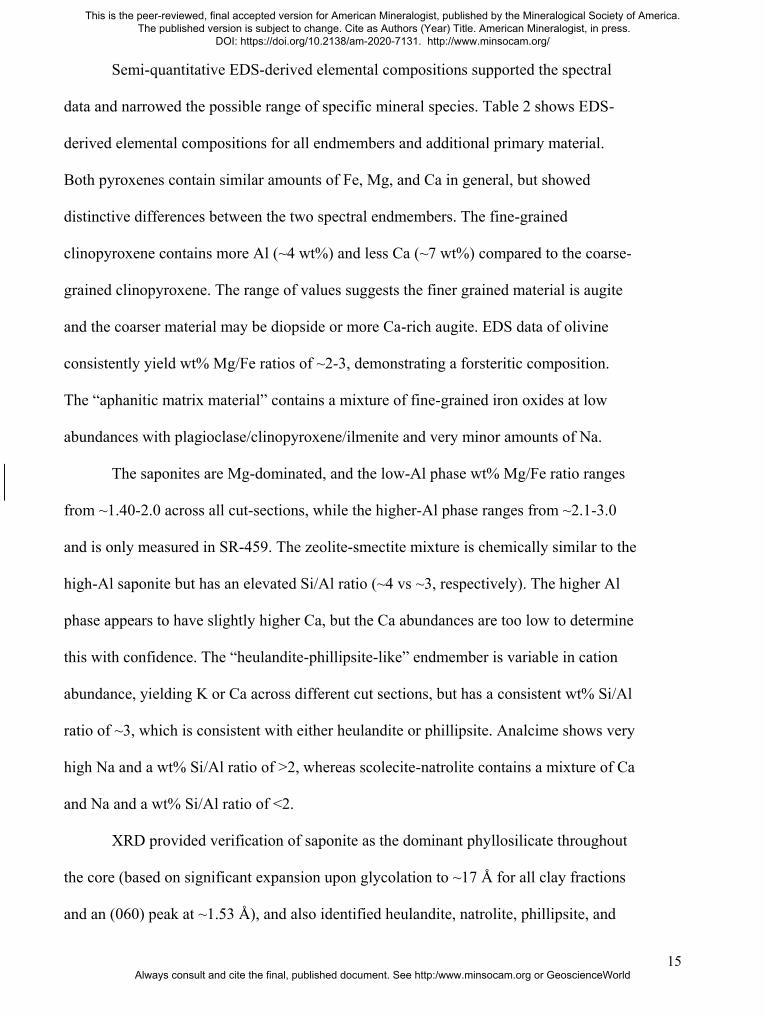
Semi-quantitative EDS-derived elemental compositions supported the spectral 350
data and narrowed the possible range of specific mineral species. Table 2 shows EDS-351
derived elemental compositions for all endmembers and additional primary material. 352
Both pyroxenes contain similar amounts of Fe, Mg, and Ca in general, but showed 353
distinctive differences between the two spectral endmembers. The fine-grained 354
clinopyroxene contains more Al (~4 wt%) and less Ca (~7 wt%) compared to the coarse-355
grained clinopyroxene. The range of values suggests the finer grained material is augite 356
and the coarser material may be diopside or more Ca-rich augite. EDS data of olivine 357
consistently yield wt% Mg/Fe ratios of ~2-3, demonstrating a forsteritic composition. 358
The “aphanitic matrix material” contains a mixture of fine-grained iron oxides at low 359
abundances with plagioclase/clinopyroxene/ilmenite and very minor amounts of Na. 360
The saponites are Mg-dominated, and the low-Al phase wt% Mg/Fe ratio ranges 361
from ~1.40-2.0 across all cut-sections, while the higher-Al phase ranges from ~2.1-3.0 362
and is only measured in SR-459. The zeolite-smectite mixture is chemically similar to the 363
high-Al saponite but has an elevated Si/Al ratio (~4 vs ~3, respectively). The higher Al 364
phase appears to have slightly higher Ca, but the Ca abundances are too low to determine 365
this with confidence. The “heulandite-phillipsite-like” endmember is variable in cation 366
abundance, yielding K or Ca across different cut sections, but has a consistent wt% Si/Al 367
ratio of ~3, which is consistent with either heulandite or phillipsite. Analcime shows very 368
high Na and a wt% Si/Al ratio of >2, whereas scolecite-natrolite contains a mixture of Ca 369
and Na and a wt% Si/Al ratio of <2. 370
XRD provided verification of saponite as the dominant phyllosilicate throughout 371
the core (based on significant expansion upon glycolation to ~17 Å for all clay fractions 372
and an (060) peak at ~1.53 Å), and also identified heulandite, natrolite, phillipsite, and 373
This is the peer-reviewed, final accepted version for American Mineralogist, published by the Mineralogical Society of America. The published version is subject to change. Cite as Authors (Year) Title. American Mineralogist, in press.
DOI: https://doi.org/10.2138/am-2020-7131. http://www.minsocam.org/
Always consult and cite the final, published document. See http:/www.minsocam.org or GeoscienceWorld

16
analcime in several of the cut sections. Hematite was only detected in two samples (SR-374
537 and -631), while ilmenite was noted in nearly all samples. Olivine was only found at 375
depths shallower than about 1360 m, while plagioclase and pyroxene were noted to 376
persist through the bottom of the zone of analysis. Sparse quartz is noted in two samples 377
towards the bottom of the hole, while sparse orthoclase is identified in only one sample. 378
Table 1 shows XRD identifications and estimated saponite abundances. Figure 5 shows 379
bulk XRD patterns from samples SR-425, -503, -513, and -537. Despite bulk XRD being 380
performed on different pieces of the same samples, the only major discrepancies in 381
identifications are that SR-513 contains weak analcime peaks in XRD, and zeolites noted 382
in SR-618 by UCIS are not seen in XRD. A weak 1.79 μm absorption is present in the 383
interior of pixels classified as natrolite by SFF in sample SR-513 and is also noticeable in 384
the point spectrum of the cut face. The lack of identification of heulandite-phillipsite in 385
SR-618 is likely due to loss during sample preparation, or heterogeneity of the sample. 386
Additional XRD patterns (both bulk and clay fraction) for a subset of samples not 387
examined with UCIS are included in the supplement. 388
Spatially mapped spectral endmembers can be seen in Figure 3 with a 389
corresponding true-color image in Figure 2. Depths of each of the cut sections discussed 390
below are noted in Table 1. 391
392
Mineralogical Variation within Core Samples 393
394
SR-392 (1032 m depth), collected closer to the top of the core hole, was devoid of 395
alteration minerals. SR-425 (1125 m depth) represented a transitional zone where fresh 396
olivine was still present, but smectites had formed from olivine crystals preferentially in 397
This is the peer-reviewed, final accepted version for American Mineralogist, published by the Mineralogical Society of America. The published version is subject to change. Cite as Authors (Year) Title. American Mineralogist, in press.
DOI: https://doi.org/10.2138/am-2020-7131. http://www.minsocam.org/
Always consult and cite the final, published document. See http:/www.minsocam.org or GeoscienceWorld

17
fractures, as seen in Figure 6. Though both SR-392 and SR-425 are vesicular, empty 398
vesicles are devoid of alteration minerals. This can be observed in Figure 2 in the true 399
color images. All saponite in SR-425 is spatially associated with large crystals of olivine 400
and is low in Al. 401
SR-459 (1216 m depth) is also representative of phyllosilicate formation and 402
shows the only presence of the zeolite-smectite mixture and the high-Al saponite in the 403
UCIS imaged cut sections. Also co-occurring are coarse-grained augite/diopside and low-404
Al saponite, but no unmixed zeolites are present. 405
Both SR-503 (1346 m depth) and SR-513 (1379 m depth) were zeolite dominated, 406
though SR-513 also contained low-Al saponite. In addition to zeolites, pure-silica 407
veinlets were identified via SEM in SR-503. There was a clear replacement process 408
occurring in SR-513 (see Figure 6), with scolecite-natrolite-like endmembers being 409
replaced by a heulandite-phillipsite-like zeolite. SR-537 (1452 m) was dominated by 410
saponite, but had small occurrences of a heulandite-phillipsite-like zeolite. In both SR-411
503 and SR-537, Fe-rich aphanitic matrix material dominated, and clinopyroxene 412
features were weak. 413
Alteration in SR-560 (1522 m depth) produced low-Al saponite material. This cut 414
section lacked zeolites, and many of the phyllosilicate occurrences were nearly perfectly 415
spherical (see Figures 2 and 3). In SR-618 (1699 m depth) alteration mineralogy was 416
primarily composed of a fibrous, radiating zeolite with a higher Si/Al ratio. This zeolite 417
may be clinoptilolite or mordenite, but the spectral and EDS data are poor quality due to 418
the sample morphology, making specific identification difficult. Coatings of saponite on 419
vesicles were also present, though not pervasive. XRD identified only saponite on 420
another piece of the same sample. 421
This is the peer-reviewed, final accepted version for American Mineralogist, published by the Mineralogical Society of America. The published version is subject to change. Cite as Authors (Year) Title. American Mineralogist, in press.
DOI: https://doi.org/10.2138/am-2020-7131. http://www.minsocam.org/
Always consult and cite the final, published document. See http:/www.minsocam.org or GeoscienceWorld

18
Alteration in Point Spectra 422
423
Through linear unmixing, relative mineral abundances were determined for all 424
781 field spectra collected from the drill core to determine changes in mineralogy with 425
depth. Zones of zeolite or phyllosilicate dominance were clear, but most of the core 426
contains mixtures as observed in the UCIS imagery. The 2.245-μm, 2.32-μm high-Al 427
saponite was more abundant higher in the stratigraphy. The low-Al saponite was 428
stratigraphically pervasive starting at depths of about 1200 m, generally increasing in 429
abundance with depth. Analcime was present in a few small zones higher in the hole, but 430
was more abundant at intermediate depths through the bottom of the hole. Zeolites were 431
generally present as mixtures at spatial scales below the ~1.5 cm footprint of the point 432
spectrometer (as seen in most of the UCIS images at 240 μm/pixel). 433
Linear unmixing was accomplished with UCIS scene endmembers. Final RMSE 434
values for the field spectra were a maximum, mean, and standard deviation 0.038, 435
0.0037, and 0.0028, respectively. It is noted that the higher RMSE values using UCIS 436
endmembers were concentrated in areas of exceptionally sharp featured zeolites. This is 437
likely due to weakened feature strength of the “heulandite-phillipsite-like” target 438
endmember produced from UCIS pixel averaging, where mixing with primary minerals 439
occurs due to its fibrous crystal habit in SR-618. 440
A three-band composite was formed into an RGB image using summed linear 441
unmixing results to show relative mineral abundances correlated with depth. The three 442
bands chosen were primary (olivine+clinopyroxene+aphanitic matrix material) in red, 443
zeolites (scolecite-natrolite-like + heulandite-like + analcime) in blue, and smectite 444
(high-Al saponite+low-Al saponite) in green. The RGB composite allows for observation 445
This is the peer-reviewed, final accepted version for American Mineralogist, published by the Mineralogical Society of America. The published version is subject to change. Cite as Authors (Year) Title. American Mineralogist, in press.
DOI: https://doi.org/10.2138/am-2020-7131. http://www.minsocam.org/
Always consult and cite the final, published document. See http:/www.minsocam.org or GeoscienceWorld
19
of mixtures between the three distinctly different spectral types and demonstrates 446
stratigraphic control of the mineral assemblages better than single matches. Point spectra 447
of the cut face for each slab analyzed with UCIS are shown in Figure 4, color-coded to 448
approximate what the spectrum would look like in the adjacent RGB composite. Figure 4 449
also shows an alteration “exaggerated” form of the RGB composite, where primary 450
mineral abundances have been artificially reduced by 50% in order to emphasize the 451
alteration colors and distinct zones. 452
453
454
Interpretation 455
456
The bulk matrix chemistry and primary mineralogy show a tholeiitic composition, 457
based on the SEM-EDS. This means that all cut sections are likely from shield-stage lava 458
flows, rather than younger alkali-rich post-shield phase lavas. These shield phase lavas 459
are not presently exposed on the surface (Wolfe, Wise, and Dalrymple, 1997) and have 460
not been extensively studied in the past with a focus on alteration. As members of the 461
upper portions of the shield phase, their age is likely ~350-500 ka (Wolfe, Wise, and 462
Dalrymple, 1997). The samples used in this study were collected below the level at 463
which continuous groundwater was encountered during drilling (Jerram et al., 2019), but 464
the discontinuous alteration likely indicates complex lateral and vertical migration of 465
groundwater controlled by physical rock properties and closing of pathways by 466
secondary mineralization. 467
Sulfates and carbonates are distinctly absent in the cut sections and all field 468
spectra. The lack of Fe3+ oxide formation (with the exception of hematite in the matrix 469
This is the peer-reviewed, final accepted version for American Mineralogist, published by the Mineralogical Society of America. The published version is subject to change. Cite as Authors (Year) Title. American Mineralogist, in press.
DOI: https://doi.org/10.2138/am-2020-7131. http://www.minsocam.org/
Always consult and cite the final, published document. See http:/www.minsocam.org or GeoscienceWorld

20
material of SR-537, and detection by XRD in SR-631), jarosite-family minerals, 470
kaolinite/illite, and palagonite indicate that alteration occurred at depth in a low-oxygen 471
environment. The saponite clay occurred in vesicles, but primarily as a replacement of 472
olivine. Augite appeared to stay intact and spectrally pristine at depth, though the higher-473
Ca, coarse-grained pyroxene that was present at shallow depths did not appear at depths 474
and may not have initially been present or may have been replaced. Glass was not 475
identified by any of the analytical methods and is likely completely replaced by saponite 476
or zeolites below the largely unaltered portion of the hole. Primary oxides (ilmenite) 477
remain unaltered through the bottom of the core. 478
No high-temperature minerals were identified, and the mineralogy is all 479
consistent with the modern geothermal gradient. Heulandite is generally a higher-480
temperature zeolite but can still form at temperatures as low as 84 °C (Wohletz and 481
Heiken, 1992). Epidote and prehnite, indicative of temperatures of ~250-300 °C (e.g. 482
Freedman et al., 2009) were absent. Viennet et al. (2017) described the preferential 483
formation conditions of phyllosilicates, zeolites, and carbonates in detail. They note that 484
Ca‐zeolite formation implies a lack of dioctahedral clay formation, and that under mildly 485
acidic conditions, dioctahedral clay minerals and carbonate minerals are preferentially 486
formed. Trioctahedral clay minerals preferentially formed in conditions with near neutral 487
pH values but can form across a wide range, and zeolites are favored at pH > 7.2. Ca-488
zeolites are present here as both phillipsite and heulandite, which are abundant and 489
present throughout much of the stratigraphy. Because saponite and zeolites often co-490
occur in this core, it is likely that any stratigraphic control on abundance of zeolites 491
versus smectites is probably caused by availability of olivine or basaltic glass as a source 492
of Mg2+ and small pH fluctuations from near neutral to basic. 493
This is the peer-reviewed, final accepted version for American Mineralogist, published by the Mineralogical Society of America. The published version is subject to change. Cite as Authors (Year) Title. American Mineralogist, in press.
DOI: https://doi.org/10.2138/am-2020-7131. http://www.minsocam.org/
Always consult and cite the final, published document. See http:/www.minsocam.org or GeoscienceWorld

21
The scolecite-natrolite-like zeolites were replaced by heulandite-phillipsite-like 494
zeolites at depth in at least one case (see SR-513 in Figure 3 and Figure 6). This could be 495
due to rising temperatures and pressures, or an earlier Na+ rich fluid being overprinted by 496
a more recent Ca2+ rich fluid. Stratigraphic, temperature-controlled zonation like that 497
described by Weisenberger et al. (2009) is not clear in the spectral data for this analyzed 498
section of the core, with all three spectral types persisting from intermediate depths 499
through the bottom of the hole in multiple discontinuous zones. However, bulk XRD 500
results (Table 1) could imply a transition from phillipsite to heulandite at roughly 1460 501
m, a transition that could be temperature dependent. 502
EDS values of all smectites analyzed from the cut sections record a wt% Mg/Fe 503
ratio of ~1.5 to slightly over 3, showing magnesium dominance. Trioctahedral Fe/Mg 504
smectites of this composition have a Mg-OH absorption between 2.309 and 2.317 μm 505
(e.g. Michalski et al., 2015), consistent with all distinct smectites observed in all the 506
UCIS cut sections. This feature shifts to shorter wavelengths as oxidation progresses, 507
thus indicating only weak oxidation of these samples (Chemtob et al., 2017). Results 508
show only two samples (537 and 631) with detectable hematite using bulk XRD. 509
Combined with the exclusively trioctahedral phyllosilicate structure observed with both 510
bulk XRD and clay-fraction XRD, most evidence points to Fe2+-rich, trioctahedral 511
smectites with minimal dioctahedral mixing or oxidation. However, variable strength of 512
0.70, 0.91, and 1.11 μm Fe2+ and Fe3+ electronic transitions and Fe2+‐Fe
3+ charge‐transfer 513
transition features (Chemtob et al., 2017), varying shape of the 2.32 μm feature, 514
particularly on the short-wavelength side (Appendix Figure 3), and iddingsite formation 515
(Calvin et al., in press) hint towards possible dioctahedral mixing and incipient oxidation 516
This is the peer-reviewed, final accepted version for American Mineralogist, published by the Mineralogical Society of America. The published version is subject to change. Cite as Authors (Year) Title. American Mineralogist, in press.
DOI: https://doi.org/10.2138/am-2020-7131. http://www.minsocam.org/
Always consult and cite the final, published document. See http:/www.minsocam.org or GeoscienceWorld
22
in some samples. Mӧssbauer spectroscopy would need to be performed to confirm 517
oxidation states and verify octahedral composition and occupancy. 518
Interlayering of smectite and chlorite or other phyllosilicates, a process seen 519
elsewhere on Earth and on Mars (Ehlmann and Edwards, 2014), is possible in the case of 520
the high-Al saponite, and the “zeolite-smectite mixture” (which may simply be a more 521
water-saturated form of the high-Al saponite). The abundant Mg2+ availability from 522
olivine, the heightened Al levels (Beaufort et al., 1997), and the 2.245 μm absorption 523
feature point to this as a possibility. However, trioctahedral smectites often have an 524
absorption at 2.245 μm from the AlAl(Fe2+,Mg)-OH combination band (Chemtob, 2015) 525
as well. Increasing Al levels from Al3+ substitution in the octahedral layer are noted to 526
increase the depth of the 2.245 μm feature (Chemtob et al., 2015). Glycolated clay 527
fraction XRD patterns (Appendix Figure 4) show full expansion of (001) spacings to 528
~17-17.7 Å across the range of spectral variability of the M-OH features seen, with no 529
(002) reflection near 7-7.5 Å indicative of chlorite, and no remnant ~14 Å (001) peak 530
after glycolation. Thus, the heightened Al is likely from a combination of both tetrahedral 531
and octahedral Al3+, and not enough Mg2+/Fe2+ substitution by Fe3+ or Al3+ to lead to a 532
significant dioctahedral character in the XRD patterns. The 2.245 μm feature is more 533
abundant and stronger shallower in the hole, but persists through the bottom. While the 534
spatial segregation of the low-Al and high-Al phases in SR-459 might point to different 535
fluid sources and alteration events, more data are needed to verify whether the 2.245 μm 536
absorption present throughout the hole is only from the high-Al saponite. 537
Nearly all of the collected data are representative of low to moderate temperature 538
aqueous alteration from moderate to basic pH fluid in low oxygen conditions. 539
This is the peer-reviewed, final accepted version for American Mineralogist, published by the Mineralogical Society of America. The published version is subject to change. Cite as Authors (Year) Title. American Mineralogist, in press.
DOI: https://doi.org/10.2138/am-2020-7131. http://www.minsocam.org/
Always consult and cite the final, published document. See http:/www.minsocam.org or GeoscienceWorld

23
Hydrothermal brines or acidic fluids derived from sulfide weathering likely did not affect 540
these samples. 541
Implications for Mars Exploration 542
543
Smectites and Zeolites on Mars 544
545
Fe- and Mg-rich phyllosilicates make up the bulk of aqueous alteration 546
mineralogy that has been identified on the Martian surface via orbital VIS-SWIR 547
spectroscopy (e.g., Carter et al., 2013; Ehlmann and Edwards, 2014). However, the 548
distribution of hydrous phyllosilicate phases raises many questions. Both dioctahedral 549
and trioctahedral smectites have been observed on Mars from orbit and in-situ (e.g., 550
Ehlmann and Edwards, 2014; Vaniman et al., 2014; Bristow et al., 2018), and current 551
oxidation states of Fe provide a snapshot of the outcome of several environmental 552
possibilities during their formation and post-formation history. Trioctahedral, Fe2+-553
bearing smectites are present on Mars in the lower units of stratigraphic sections exposed 554
by erosion, in materials exhumed by impact, and in diagenetically altered sediments in 555
Gale crater (Bishop et al., 2008; Ehlmann et al., 2011a; Bridges, 2014; Treiman et al., 556
2014; Vaniman et al., 2014). Trioctahedral, Fe-Mg smectites are the thermodynamically-557
favored product of lower-temperature, anoxic aqueous alteration of basaltic material 558
(Catalano, 2013). Smectites with an absorption closer to 2.30 μm, which are 559
predominately interpreted as dioctahedral, Fe3+-rich smectites (i.e. nontronite) are the 560
most abundant smectite identified in CRISM pixels (> 70% of smectite identifications) 561
(Michalski et al., 2015). These smectites may have formed from prolonged oxidation of 562
trioctahedral smectites which formed under low-oxygen conditions, or they may have 563
This is the peer-reviewed, final accepted version for American Mineralogist, published by the Mineralogical Society of America. The published version is subject to change. Cite as Authors (Year) Title. American Mineralogist, in press.
DOI: https://doi.org/10.2138/am-2020-7131. http://www.minsocam.org/
Always consult and cite the final, published document. See http:/www.minsocam.org or GeoscienceWorld

24
formed directly under oxic aqueous conditions (Chemtob et al., 2015, 2017; Gainey et 564
al., 2017). These varying formation conditions place very different constraints on Mars’ 565
atmospheric transitions and regional phenomena. The samples from this study of Mauna 566
Kea drill cores provide an example of trioctahedral smectites formed under low-oxygen 567
conditions, which are generally difficult to study due to their instability on Earth’s 568
surface where they are rapidly weathered or oxidized (Chemtob et al., 2017). The co-569
occurrence of smectite with either primary or associated alteration minerals affects the 570
shape and band position of the Mg-OH feature, which is generally used to identify 571
dioctahedral versus trioctahedral smectite phases. The spectra provided in the supplement 572
here exhibit a range of shapes for trioctahedral smectites of very similar composition 573
(Appendix Figure 2), but mixed with different mineralogy based on their stratigraphic 574
occurrence. Additionally, the ~2.25 μm feature commonly used in remote sensing studies 575
to identify chlorite is shown here to be present and strong in naturally occurring saponite 576
with likely no chlorite component in Mars-like lithology. 577
Zeolites are both a possible component of the widespread dust on Mars and an 578
aqueous alteration product, much like on Earth where they replace glassy material and 579
infill amygdaloidal cavities of volcanic rocks and volcaniclastic sediment (Ruff, 2004; 580
Ehlmann et al., 2009; Ehlmann and Edwards, 2014; Viennet et al., 2017). Though many 581
of the zeolite species are spectrally similar, their presence alone in low to moderate 582
temperature aqueous alteration of basalt and basaltic glass provides limits on pH 583
(Viennet et al., 2017). Analcime, a Na zeolite, has been observed in theorized impact 584
excavated or hydrothermal-generated material on Mars in multiple locations (Ehlmann et 585
al., 2009; Carrozzo et al., 2017). Here we identify analcime and other zeolites and 586
observe how they spectrally mix with smectites and primary mafic minerals. While 587
This is the peer-reviewed, final accepted version for American Mineralogist, published by the Mineralogical Society of America. The published version is subject to change. Cite as Authors (Year) Title. American Mineralogist, in press.
DOI: https://doi.org/10.2138/am-2020-7131. http://www.minsocam.org/
Always consult and cite the final, published document. See http:/www.minsocam.org or GeoscienceWorld

25
identifying zeolites in mixtures with hydrated smectites is difficult, mapping of zeolites 588
on Mars has great implications for understanding pH in the early surface and subsurface 589
environment. 590
Wordsworth et al. (2018) suggest that the characterization of “climatically 591
important mineral deposits” is an important goal for future missions. Spectral 592
characterization of geologically realistic mixtures of Mars-relevant primary and zeolite 593
mineralogy with trioctahedral smectites presents a pathway for identifying this 594
subsurface environment of formation on Mars. In addition, we identify specific features 595
to help differentiate these materials. Further work to better constrain alteration conditions 596
and stratigraphic constraints in these samples, including complete core VIS-SWIR 597
scanning, will provide additional insight into similar environments that were likely 598
present on early Mars. 599
600
Acknowledgements 601
602
This project was funded in part by the Honors Undergraduate Research Program at the 603
University of Nevada, Reno and by the NASA Solar Systems Workings program Award 604
#80NSSC19K0031 to W.M. Calvin. A portion of this research was carried out at the Jet 605
Propulsion Laboratory, California Institute of Technology, under a contract with the 606
National Aeronautics and Space Administration. We appreciate detailed reviews by 607
Elizabeth Rampe and one anonymous reviewer who helped clarify and strengthen the 608
manuscript. 609
610
611
612
This is the peer-reviewed, final accepted version for American Mineralogist, published by the Mineralogical Society of America. The published version is subject to change. Cite as Authors (Year) Title. American Mineralogist, in press.
DOI: https://doi.org/10.2138/am-2020-7131. http://www.minsocam.org/
Always consult and cite the final, published document. See http:/www.minsocam.org or GeoscienceWorld

26
613
References Cited 614 615
Arvidson, R.E., Bellutta, P., Calef, F., Fraeman, A.A., Garvin, J.B., Gasnault, O., . . . Wiens, R.C. (2014). 616
Terrain physical properties derived from orbital data and the first 360 sols of Mars science 617
laboratory curiosity rover observations in gale crater. Journal of Geophysical Research: Planets, 618
119(6), 1322-1344.doi:10.1002/2013JE004605 619
Beaufort, D., Baronnet, A., Lanson, B., & Meunier, A. (1997). Corrensite; a single phase or a mixed-layer 620
phyllosilicate in saponite-to-chlorite conversion series? A case study of Sancerre-Couy deep drill 621
hole (France). American Mineralogist, 82(1-2), 109-124. 622
Bergmann, J., Friedel, P. & Kleeberg, R. (1998). BGMN — a new fundamental parameters based 623
Rietveld program for laboratory X-ray sources, it's use in quantitative analysis and structure 624
investigations. Commission of Powder Diffraction Newsletter, 20, 5–8 625
Bibring, J.P., Langevin, Y., Mustard, J.F., Poulet, F., Arvidson, R., Gendrin, A., … Neukum, G. (2006). 626
Global mineralogical and aqueous Mars history derived from OMEGA/Mars Express data. 627
Science, 312(5772), 400–404. 628
Bishop J.L. and Murad E. (2002) Spectroscopic and Geochemical Analyses of Ferrihydrite from 629
Hydrothermal Springs in Iceland and Applications to Mars. In Volcano-Ice Interactions on Earth 630
and Mars. Geological Society, Special Pub. (202), 357-370. 631
Bishop, J.L., Dobrea, E. Z.N., McKeown, N.K., Parente, M., Ehlmann, B.L., Michalski, J.R., … Bibring, 632
J.P. (2008). Phyllosilicate diversity and past aqueous activity revealed at Mawrth Vallis, Mars. 633
Science, 321(5890), 830–833. 634
Bridges, J. (2014). Comparing clays from Mars and Earth: Implications for martian habitability. 635
American Mineralogist. https://doi.org/10.2138/am-2014-5089 636
Bristow, T.F., Rampe, E.B., Achilles, C.N., Blake, D.F., Chipera, S.J., Craig, P., … Yen, A.S. (2018). 637
Clay mineral diversity and abundance in sedimentary rocks of Gale crater, Mars. Science 638
Advances, 4(6). 639
Boardman, J.W. (1989). Inversion of imaging spectrometry data using singular value decomposition. 640
This is the peer-reviewed, final accepted version for American Mineralogist, published by the Mineralogical Society of America. The published version is subject to change. Cite as Authors (Year) Title. American Mineralogist, in press.
DOI: https://doi.org/10.2138/am-2020-7131. http://www.minsocam.org/
Always consult and cite the final, published document. See http:/www.minsocam.org or GeoscienceWorld
27
Proceedings, IGARSS’89, 12th Canadian Symposium on Remote Sensing, 4, 2069-2072. 641
10.1109/IGARSS.1989.577779 642
Calvin, W.M., and Pace, E.L. (2016). Mapping alteration in geothermal drill core using a field portable 643
spectroradiometer. Geothermics. https://doi.org/10.1016/j.geothermics.2016.01.005 644
Calvin, W.M., Lautze, N., Moore, J., Thomas, D., Haskins, E., Rasmussen, B.P. (2020). Petrographic and 645
Spectral Study of Hydrothermal Mineralization in Drill Core from Hawaii: A potential analogue 646
to alteration in the Martian subsurface. American Mineralogist, in press. 647
Campbell, N.A. (1996). The decorrelation stretch transformation. International Journal of Remote 648
Sensing. 17(10), 1939-1949. https://doi.org/10.1080/01431169608948749 649
Cannon, K.M., Parman, S.W., Mustard, J.F. (2017) Primordial clays on Mars formed beneath a steam or 650
supercritical atmosphere. Nature, doi:10.1038/nature24657 651
Carrozzo, F.G., Di Achille, G., Salese, F., Altieri, F., and Bellucci, G. (2017). Geology and mineralogy of 652
the Auki Crater, Tyrrhena Terra, Mars: A possible post impact-induced hydrothermal system. 653
Icarus. https://doi.org/10.1016/j.icarus.2016.09.001 654
Carter, J.,F. Poulet, J.P. Bibring, N. Mangold, and S. Murchie (2013), Hydrous minerals on Mars as seen 655
by the CRISM and OMEGA imaging spectrometers: Updated global view, J. Geophys. Res. 656
Planets, 118, doi: 10.1029/2012JE004145. 657
Catalano, J. G. (2013). Thermodynamic and mass balance constraints on iron-bearing phyllosilicate 658
formation and alteration pathways on early Mars. Journal of Geophysical Research: Planets. 659
https://doi.org/10.1002/jgre.20161 660
Clark, R.N., King, T.V., Klejwa, M., Swayze, G.A., & Vergo, N. (1990). High spectral resolution 661
reflectance spectroscopy of minerals. Journal of Geophysical Research: Solid Earth, 95(B8), 662
12653-12680. 663
Clark, R.N., Swayze, G.A., Gallagher, A., Gorelick, N., & Kruse, F.A. (1991). Mapping with imaging 664
spectrometer data using the complete band shape least-squares algorithm simultaneously fit to 665
multiple spectral features from multiple materials. Proceedings of the third airborne 666
visible/infrared imaging spectrometer (AVIRIS) workshop 42, 2-3 667
This is the peer-reviewed, final accepted version for American Mineralogist, published by the Mineralogical Society of America. The published version is subject to change. Cite as Authors (Year) Title. American Mineralogist, in press.
DOI: https://doi.org/10.2138/am-2020-7131. http://www.minsocam.org/
Always consult and cite the final, published document. See http:/www.minsocam.org or GeoscienceWorld

28
Chemtob, S.M., Nickerson, R.D., Morris, R.V., Agresti, D.G., and Catalano, J.G. (2015). Synthesis and 668
structural characterization of ferrous trioctahedral smectites: Implications for clay mineral genesis 669
and detectability on Mars. Journal of Geophysical Research: Planets. 670
https://doi.org/10.1002/2014je004763 671
Chemtob, S.M., Nickerson, R.D., Morris, R.V., Agresti, D.G., and Catalano, J.G. (2017). Oxidative 672
Alteration of Ferrous Smectites and Implications for the Redox Evolution of Early Mars. Journal 673
of Geophysical Research: Planets. https://doi.org/10.1002/2017je005331 674
Ehlmann, B.L., and Edwards, C.S. (2014). Mineralogy of the Martian Surface. Annual Review of Earth 675
and Planetary Sciences. https://doi.org/10.1146/annurev-earth-060313-055024 676
Ehlmann, B.L., Bish, D.L., Ruff, S.W., and Mustard, J.F. (2012). Mineralogy and chemistry of altered 677
Icelandic basalts: Application to clay mineral detection and understanding aqueous environments 678
on Mars. Journal of Geophysical Research: Planets. https://doi.org/10.1029/2012je004156 679
Ehlmann, B.L., J.F. Mustard, S.L. Murchie, J.P. Bibring, A. Meunier, A.A. Fraeman, and Y. Langevin 680
(2011a), Subsurface water and clay mineral formation during the early history of Mars, Nature, 681
479, 53–60, doi:10.1038/nature10582. 682
Ehlmann, B.L., J.F. Mustard, R.N. Clark, G.A. Swayze, and S.L. Murchie (2011b), Evidence of low-683
grade metamorphism, hydrothermal alteration, and diagenesis on Mars from phyllosilicate 684
mineral assemblages, Clays and Clay Minerals., 59(4), 359–377. 685
Ehlmann, B.L., Mustard, J.F., Swayze, G.A., Clark, R.N., Bishop, J.L., Poulet, F., … Murchie, S. L. 686
(2009). Identification of hydrated silicate minerals on Mars using MRO-CRISM: Geologic 687
context near Nili Fossae and implications for aqueous alteration. Journal of Geophysical 688
Research. https://doi.org/10.1029/2009je003339 689
Freedman, A.J., Bird, D. K., Arnórsson, S., Fridriksson, T., Elders, W.A., & Fridleifsson, G.Ó. (2009). 690
Hydrothermal minerals record CO2 partial pressures in the Reykjanes geothermal system, 691
Iceland. American Journal of Science, 309(9), 788-833. 692
Gainey, S.R., Hausrath, E.M., Adcock, C.T., Tschauner, O., Hurowitz, J.A., Ehlmann, B.L., . . . (2017). 693
Clay mineral formation under oxidized conditions and implications for paleoenvironments and 694
This is the peer-reviewed, final accepted version for American Mineralogist, published by the Mineralogical Society of America. The published version is subject to change. Cite as Authors (Year) Title. American Mineralogist, in press.
DOI: https://doi.org/10.2138/am-2020-7131. http://www.minsocam.org/
Always consult and cite the final, published document. See http:/www.minsocam.org or GeoscienceWorld

29
organic preservation on mars. Nature Communications, 8(1), 1230-7. doi:10.1038/s41467-017-695
01235-7 696
Greenberger, R.N., Mustard, J.F., Ehlmann, B.L., Blaney, D.L., Cloutis, E.A., Wilson, J.H., … Fraeman, 697
A.A. (2015). Imaging spectroscopy of geological samples and outcrops: Novel insights from 698
microns to meters. GSA Today. https://doi.org/10.1130/gsatg252a.1 699
Grotzinger, J.P.,Sumner, D.Y., Kah, L. C., Stack, K.,Gupta, S., Edgar, L., ... & Milliken, R. (2014). A 700
habitable fluvio-lacustrine environment at Yellowknife Bay, Gale Crater, Mars. Science, 701
343(6169),1242777. 702
Greenberger, R.N., Mustard, J.F., Kumar, P.S., Dyar, M.D., Breves, E.A., and Sklute, E.C. (2012). Low 703
temperature aqueous alteration of basalt: Mineral assemblages of Deccan basalts and implications 704
for Mars. Journal of Geophysical Research: Planets. https://doi.org/10.1029/2012je004127 705
Guinness, E.A., Arvidson, R.E., Jolliff, B.L., Seelos, K.D., Seelos, F. P., Ming, D.W., … Graff, T.G. 706
(2007). Hyperspectral reflectance mapping of cinder cones at the summit of Mauna Kea and 707
implications for equivalent observations on Mars. Journal of Geophysical Research: Planets. 708
https://doi.org/10.1029/2006je002822 709
Hadnott, B.A., Ehlmann, B.L., and Jolliff, B.L. (2017). Mineralogy and chemistry of San Carlos High-710
Alkali basalts: Analyses of alteration with application for Mars exploration. American 711
Mineralogist. https://doi.org/10.2138/am-2017-5608 712
Hapke, B (1981). Bidirectional reflectance spectroscopy: 1. Theory. Journal of Geophysical Research: 713
Solid Earth 86, 3039-3054. 714
Hunt, G.R. (1977). Spectral signatures of particulate minerals in the visible and near infrared. Geophysics, 715
42, 501-513.https://doi.org/10.1190/1.1440721 716
Jerram, D.A., Millett, J.M., Kück, J., Thomas, D., Planke, S., Haskins, E., Lautze, N., and Pierdominici, 717
S. (2019) Understanding volcanic facies in the subsurface: a combined core, wireline logging and 718
image log data set from the PTA2 and KMA1 boreholes, Big Island, Hawai`i. Scientific Drilling, 719
25, 15-33. 720
King, T.V.V., and Clark, R.N. (1989). Spectral characteristics of chlorites and Mg-serpentines using high-721
This is the peer-reviewed, final accepted version for American Mineralogist, published by the Mineralogical Society of America. The published version is subject to change. Cite as Authors (Year) Title. American Mineralogist, in press.
DOI: https://doi.org/10.2138/am-2020-7131. http://www.minsocam.org/
Always consult and cite the final, published document. See http:/www.minsocam.org or GeoscienceWorld
30
resolution reflectance spectroscopy. Journal of Geophysical Research: Solid Earth. 722
https://doi.org/10.1029/jb094ib10p13997 723
Kokaly, R.F., Clark, R.N., Swayze, G.A., Eric Livo, K., Hoefen, T.M., Pearson, N. C., … Klein, A.J. 724
(2017). USGS Spectral Library Version 7. Data Series. https://doi.org/10.3133/ds1035 725
Leask, E.K., and Ehlmann, B.L. (2016). Identifying and quantifying mineral abundance through VSWIR 726
microimaging spectroscopy: A comparison to XRD and SEM. 2016 8th Workshop on 727
Hyperspectral Image and Signal Processing: Evolution in Remote Sensing (WHISPERS). 728
https://doi.org/10.1109/whispers.2016.8071774 729
McCanta, M.C., Dyar, M.D., and Treiman, A.H. (2014). Alteration of Hawaiian basalts under sulfur-rich 730
conditions: Applications to understanding surface-atmosphere interactions on Mars and Venus. 731
American Mineralogist. https://doi.org/10.2138/am.2014.4584 732
Michalski, J.R., Cuadros, J., Bishop, J.L., Darby Dyar, M., Dekov, V., and Fiore, S. (2015). Constraints 733
on the crystal-chemistry of Fe/Mg-rich smectitic clays on Mars and links to global alteration 734
trends. Earth and Planetary Science Letters. https://doi.org/10.1016/j.epsl.2015.06.020 735
Michalski, J.R., Cuadros, J., Niles, P.B., Parnell, J., Deanne Rogers, A., and Wright, S.P. (2013). 736
Groundwater activity on Mars and implications for a deep biosphere. Nature Geoscience. 737
https://doi.org/10.1038/ngeo1706 738
Morris, R.V., Gooding, J.L., Lauer, H.V., & Singer, R.B. (1990). Origins of Marslike spectral and 739
magnetic properties of a Hawaiian palagonitic soil. Journal of Geophysical Research: Solid Earth, 740
95(B9), 14427-14434. 741
Morris, R.V., Ming, D.W., Graff, T.G., Arvidson, R.E., Bell, J.F., Squyres, S.W., … Robinson, G.A. 742
(2005). Hematite spherules in basaltic tephra altered under aqueous, acid-sulfate conditions on 743
Mauna Kea volcano, Hawaii: Possible clues for the occurrence of hematite-rich spherules in the 744
Burns formation at Meridiani Planum, Mars. Earth and Planetary Science Letters. 745
https://doi.org/10.1016/j.epsl.2005.09.044 746
Morris, R.V., Ruff, S.W., Gellert, R., Ming, D.W., Arvidson, R.E., Clark, B.C., . . . Squyres, S.W. (2010). 747
Identification of carbonate-rich outcrops on Mars by the spirit rover. Science, 329(5990), 421-748
This is the peer-reviewed, final accepted version for American Mineralogist, published by the Mineralogical Society of America. The published version is subject to change. Cite as Authors (Year) Title. American Mineralogist, in press.
DOI: https://doi.org/10.2138/am-2020-7131. http://www.minsocam.org/
Always consult and cite the final, published document. See http:/www.minsocam.org or GeoscienceWorld
31
424. doi:10.1126/science.1189667 749
Murchie, S., Arvidson, R., Bedini, P., Beisser, K., Bibring, J. P., Bishop, J., ... & Darlington, E. 750
H. (2007). Compact reconnaissance imaging spectrometer for Mars (CRISM) on Mars 751
reconnaissance orbiter (MRO). Journal of Geophysical Research: Planets, 112(E5). 752
Pan, L., and Ehlmann, B.L. (2014). Phyllosilicate and hydrated silica detections in the knobby 753
terrains of Acidalia Planitia, northern plains, Mars. Geophysical Research Letters. 754
https://doi.org/10.1002/2014gl059423 755
Rampe, E. B., Ming, D. W., Blake, D. F., Bristow, T. F., Chipera, S. J., Grotzinger, J. P., Morris, R. V., 756
Morrison, S. M., Vaniman, D. T., Yen, A. S., Achilles, C. N., Craig, P. I., Des Marais, D. J., 757
Downs, R. T., Farmer, J. D., Fendrich, K. V., Gellert, R., Morookian, J. M., Peretyazhko, T. S., 758
Sarrazin, P., Treiman, A. H., Berger, J. A., Eigenbrode, J. L., Fairén, A. G., Forni, O., Gupta, S., 759
Hurowitz, J. A., Kah, L. C., Lanza, N. L., Schmidt, M. E., Siebach, K., Sutter, B., and Thompson, 760
L. M. (2017) Mineralogy of an ancient lacustrine mudstone succession from the Murray 761
formation, Gale crater, Mars. Earth and Planetary Science Letters, 471, 172-185. 762
Ruff, S.W. (2004). Spectral evidence for zeolite in the dust on Mars. Icarus. 763
https://doi.org/10.1016/j.icarus.2003.11.003 764
Tornabene, L.L., Osinski, G.R., McEwen, A.S., Wray, J.J., Craig, M.A., Sapers, H.M., and Christensen, 765
P.R. (2013). An impact origin for hydrated silicates on Mars: A synthesis. Journal of Geophysical 766
Research: Planets. https://doi.org/10.1002/jgre.20082 767
Treiman, A.H., Morris, R.V., Agresti, D.G., Graff, T.G., Achilles, C.N., Rampe, E.B., … Downs, R.T. 768
(2014). Ferrian saponite from the Santa Monica Mountains (California, U.S.A., Earth): 769
Characterization as an analog for clay minerals on Mars with application to Yellowknife Bay in 770
Gale Crater. American Mineralogist. https://doi.org/10.2138/am-2014-4763 771
Vaniman, D.T., D.L. Bish, D.W. Ming, T.F. Bristow, R.V. Morris, D.F. Blake, S.J. Chipera, S.M. 772
Morrison, A.H. Treiman, E.B. Rampe, M. Rice, C.N. Achilles, J. Grotzinger, S.M. McLennan, J. 773
Williams, J. Bell III, H. Newsom, R.T. Downs, S. Maurice, P. Sarrazin, A.S. Yen, J.M. 774
This is the peer-reviewed, final accepted version for American Mineralogist, published by the Mineralogical Society of America. The published version is subject to change. Cite as Authors (Year) Title. American Mineralogist, in press.
DOI: https://doi.org/10.2138/am-2020-7131. http://www.minsocam.org/
Always consult and cite the final, published document. See http:/www.minsocam.org or GeoscienceWorld
32
Morookian, J.D. Farmer, K. Stack, R.E. Milliken, B.L. Ehlmann, D.Y. Sumner, G. Berger, J.A. 775
Crisp, J.A. Hurowitz, R. Anderson, D. DesMarais, E.M. Stolper, K S. Edgett, S. Gupta, N. 776
Spanovich, MSL Science Team. (2014). Mineralogy of a mudstone at Yellowknife Bay, Gale 777
crater, Mars. Science 343, 1243480. doi:10.1126/science.1243480 778
Van Gorp, B., Mouroulis, P., Blaney, D., Green, R.O., Ehlmann, B.L., and Rodriguez, J.I. (2014). Ultra-779
compact imaging spectrometer for remote,in situ, and microscopic planetary mineralogy. Journal 780
of Applied Remote Sensing. https://doi.org/10.1117/1.jrs.8.084988 781
Viennet, J.C., Bultel, B., Riu, L., and Werner, S.C. (2017). Dioctahedral Phyllosilicates Versus Zeolites 782
and Carbonates Versus Zeolites Competitions as Constraints to Understanding Early Mars 783
Alteration Conditions. Journal of Geophysical Research: Planets. 784
https://doi.org/10.1002/2017je005343 785
Viviano‐Beck, C. E., Seelos, F. P., Murchie, S. L., Kahn, E. G., Seelos, K. D., Taylor, H. W., Taylor, K. 786
Ehlmann, B. L., Wiseman, S. M., Mustard J. F., M. F. Morgan (2014). Revised CRISM spectral 787
parameters and summary products based on the currently detected mineral diversity on 788
Mars, Journal of Geophysical Research: Planets, 119, 1403–1431. 789
Weisenberger, T and Selbekk, R.S. (2009). Multi-stage zeolite facies mineralization in the Hvalfjördur 790
area. Iceland. International Journal of Earth Science 98. 985-999. 10.1007/s00531-007-0296-6. 791
Wohletz, K., & Heiken, G. (1992). Volcanology and geothermal energy. Berkeley: University of 792
California Press. 793
Wolfe, E.W., Wise, W.S., and Brent Dalrymple, G. (1997). The geology and petrology of Mauna Kea 794
Volcano, Hawaii;a study of postshield volcanism. Professional Paper. 795
https://doi.org/10.3133/pp1557 796
Wordsworth, R., Ehlmann, B.L., Forget, F., Haberle, R., Head, J., and Kerber, L. (2018). Healthy debate 797
on early Mars. Nature Geoscience. https://doi.org/10.1038/s41561-018-0267-5 798
799
800
This is the peer-reviewed, final accepted version for American Mineralogist, published by the Mineralogical Society of America. The published version is subject to change. Cite as Authors (Year) Title. American Mineralogist, in press.
DOI: https://doi.org/10.2138/am-2020-7131. http://www.minsocam.org/
Always consult and cite the final, published document. See http:/www.minsocam.org or GeoscienceWorld
33
801
802 803
804
805
806
807
808
809
810
811
812
813
814
815
816
Figure and Table Captions 817
818
Table 1: Phases identified by XRD of all cut sections analyzed in this study. Abundances 819
of trioctahedral clay minerals (saponite) were determined by XRD analyses with the 820
BGMN software (2:1 clay row). UCIS imaged cut-sections have their rows highlighted. 821
822
Table 2: Normalized, non-standardized EDS-derived compositions (in mass %) of all 823
spectral endmembers in addition to a bulk average of both distinct matrix materials. All 824
This is the peer-reviewed, final accepted version for American Mineralogist, published by the Mineralogical Society of America. The published version is subject to change. Cite as Authors (Year) Title. American Mineralogist, in press.
DOI: https://doi.org/10.2138/am-2020-7131. http://www.minsocam.org/
Always consult and cite the final, published document. See http:/www.minsocam.org or GeoscienceWorld

34
reported compositions are means of multiple mapped areas, and should be interpreted 825
only in a semi-quantitative sense. 826
827
Figure 1: Spectral endmembers produced from in-scene averages of UCIS reflectance 828
pixels. Vertical lines highlight features at 1, 1.2, 1.4, 1.79, 1.91, 2.245, 2.29, 2.32, and 2.4 829
μm.USGS spectral library standards are included for comparison to UCIS spectra. 830
831
Figure 2: True color mosaic of the individual cut section images produced from UCIS 832
images. 833
834
Figure 3: Classified image results from spectral feature fitting of in-scene endmembers. 835
Unclassified pixels are generally vesicles, plagioclase grains, or very low signal, low 836
albedo areas. See Appendix Figure 1 for quantification of pixel classes for each sample. 837
838
Figure 4: The left spectral stack plot illustrates the point spectra of the cut face of UCIS 839
imaged sections. Vertical lines highlight features at 1, 1.2, 1.4, 1.79, 1.91, 2.245, 2.29, 840
2.32, and 2.4 μm (also denoted in Figure 1). Line colors in the spectra plots represent 841
approximate colors of spectra in the corresponding “core stack” image to the right. In the 842
vertical color images, the color of a particular location is based on UCIS endmember 843
abundance. Here, relative abundances produced from linear spectral unmixing form red 844
“primary endmembers,” green “saponite endmembers,” and blue “zeolite endmembers” 845
channels in the “raw” image. The second image represents an “alteration exaggerated” 846
form of the RGB composite to the left, where primary mineral abundances have been 847
artificially reduced by 50% in order to emphasize the alteration colors. This better 848
This is the peer-reviewed, final accepted version for American Mineralogist, published by the Mineralogical Society of America. The published version is subject to change. Cite as Authors (Year) Title. American Mineralogist, in press.
DOI: https://doi.org/10.2138/am-2020-7131. http://www.minsocam.org/
Always consult and cite the final, published document. See http:/www.minsocam.org or GeoscienceWorld
35
illustrates to the human eye the stratigraphic pervasiveness of the saponite, and the zeolite 849
zonation. Horizontal black bars represent local zeolite enrichments. 850
851
Figure 5: XRD patterns for samples SR-425, -503, -513, and -537, with characteristic 852
peaks annotated. 853
854
Figure 6: SEM images demonstrate textural relationships of primary and secondary 855
phases in cut sections. In A, exposed heulandite-phillipsite crystals radiate towards 856
matrix material (SR-503). In B, scolecite-natrolite (interior) is being replaced by 857
heulandite-phillipsite (SR-513). In C, well-organized saponite platelets are exposed by a 858
scratch, and smectite swelling is observed within the high-Al saponite endmember (SR-859
459). In D, a different texture of heulandite-phillipsite in more tabular crystals is 860
exhibited (SR-503). In E, euhedral olivine crystals are replaced by the low-Al saponite 861
endmember, which is preferentially forming in fractures (SR-425). In F, a radiating 862
zeolite shows a distinctly different texture from the other heulandite-phillipsite 863
occurrences, possibly hinting at a different zeolite phase (SR-618). 864
865
866
Appendix Figure Captions 867
868
Appendix Figure 1: Spectral endmember classified pixel abundances from UCIS image 869
mosaic. Unclassified pixels are generally plagioclase and primary oxide grains, though 870
voids in the interior of samples are included in this case. 871
This is the peer-reviewed, final accepted version for American Mineralogist, published by the Mineralogical Society of America. The published version is subject to change. Cite as Authors (Year) Title. American Mineralogist, in press.
DOI: https://doi.org/10.2138/am-2020-7131. http://www.minsocam.org/
Always consult and cite the final, published document. See http:/www.minsocam.org or GeoscienceWorld

36
Appendix Figure 2: Ratioed CRISM Minerals Identified through CRISM Analysis 872
(MICA) spectra (Viviano-beck et al., 2014) of relevant mineralogy compared to both 873
mean UCIS pixels of each sample, and bulk point spectra of each sample. 874
Appendix Figure 3: Feature shape variation of all UCIS pixels classified as saponite-875
containing. The ratio values on each axis are of continuum-removed spectra. 876
Appendix Figure 4: Clay fraction and bulk XRD results for samples SR-446, -541, -544, 877
and -639 and their cut face point spectra for comparison. Each panel shows the 0-35 2θ 878
range both glycolated and air dried, with a zoomed in view of the 59-65 °2θ range. All 879
samples, despite varying VIS-SWIR spectral shapes, are characteristic of saponite. 880
881 882
883 884
885
886
887
888
889
890
891
892
Tables 893 894
895 Table 1 896
Plag
iocl
ase
x x x x x x x x x x x x x x x x x x x x x x x
Pyro
xene
x x x x x x x x x x x x x x x x x x x x x x x x
This is the peer-reviewed, final accepted version for American Mineralogist, published by the Mineralogical Society of America. The published version is subject to change. Cite as Authors (Year) Title. American Mineralogist, in press.
DOI: https://doi.org/10.2138/am-2020-7131. http://www.minsocam.org/
Always consult and cite the final, published document. See http:/www.minsocam.org or GeoscienceWorld

37
Oliv
ine
x x x x x
2:1
clay
(%
) 30
5 10
30
30
10
40
5-10
30
35
15
50 10
10
30
10
5
5-10
25
10
50
Phill
ipsi
te
x x x
Heu
land
ite
x
Ana
lcim
e
x x x
Nat
rolit
e
x
Hem
atite
o o o x x
Ilmen
ite
x x x x x x x x x x x x x x x x x x x x
Qua
rtz
x x
Sam
ple
373
392
422
425
437
446
459
465
479
503
505
513
537
541
544
560
573
575
612
614
618
626
631
639
Dep
th
(m)
977
1032
1119
1125
1153
1177
1216
1235
1274
1346
1354
1379
1452
1463
1472
1521
1562
1567
1680
1685
1699
1721
1736
1761
897 898
Table 2 899 900
Endmember Fe Mg Al Ca K Na Ti Si O Si/Al Mg/Fe
Coarse Matrix 6 8.8 4 9.5 0 0 0.8 24.2 46.6 6 1.5
Aphanitic Matrix 16.1 7.4 3.6 8.1 0 0 1.6 19.9 43.4 5.5 0.5
Olivine 10.2 28.5 0 0 0 0 0 18.8 42.85 N/A 2.8
This is the peer-reviewed, final accepted version for American Mineralogist, published by the Mineralogical Society of America. The published version is subject to change. Cite as Authors (Year) Title. American Mineralogist, in press.
DOI: https://doi.org/10.2138/am-2020-7131. http://www.minsocam.org/
Always consult and cite the final, published document. See http:/www.minsocam.org or GeoscienceWorld

38
Fine-Grained Clinopyroxene 7.7 7.9 6.5 5.7 0 0.7 0 23.6 47.9 3.9 1
Coarse-Grained Clinopyroxene 6.2 9.4 2.5 13.4 0 0 0 24.9 43.1 12.1 1.5
High-Al Saponite 5 13.4 7.9 2.2 0 0 0 23 48.5 2.9 2.7
Low-Al Saponite 8.7 14.4 3 0.6 0 0 0 25.8 47.5 8.5 1.7
Saponite-Zeolite Mix 5.1 14.2 6.3 2.7 0 0 0 22.8 48.9 3.8 2.8
Heulandite-Phillipsite-Like 0 0.6 10.2 4.6 1.7 1.5 0 26.6 54.8 2.6 N/A
Analcime 0 0 10.8 0 0 11.5 0 26 51.8 2.4 N/A
Scolecite-Natrolite-Like 0 0 14.2 8 0 4.6 0 21.5 51.8 1.51 N/A 901 902 903 904 905
906 907
908 909 910 911 912 913 914 915 916 917 918 919 920 921 922 923 924 925 926 927 928 929 930
This is the peer-reviewed, final accepted version for American Mineralogist, published by the Mineralogical Society of America. The published version is subject to change. Cite as Authors (Year) Title. American Mineralogist, in press.
DOI: https://doi.org/10.2138/am-2020-7131. http://www.minsocam.org/
Always consult and cite the final, published document. See http:/www.minsocam.org or GeoscienceWorld

39
Figures 931
932 933 934 935
936 937
This is the peer-reviewed, final accepted version for American Mineralogist, published by the Mineralogical Society of America. The published version is subject to change. Cite as Authors (Year) Title. American Mineralogist, in press.
DOI: https://doi.org/10.2138/am-2020-7131. http://www.minsocam.org/
Always consult and cite the final, published document. See http:/www.minsocam.org or GeoscienceWorld

40
938
939 940 941
942
This is the peer-reviewed, final accepted version for American Mineralogist, published by the Mineralogical Society of America. The published version is subject to change. Cite as Authors (Year) Title. American Mineralogist, in press.
DOI: https://doi.org/10.2138/am-2020-7131. http://www.minsocam.org/
Always consult and cite the final, published document. See http:/www.minsocam.org or GeoscienceWorld

41
943 944
This is the peer-reviewed, final accepted version for American Mineralogist, published by the Mineralogical Society of America. The published version is subject to change. Cite as Authors (Year) Title. American Mineralogist, in press.
DOI: https://doi.org/10.2138/am-2020-7131. http://www.minsocam.org/
Always consult and cite the final, published document. See http:/www.minsocam.org or GeoscienceWorld

42
945 946 947 948 949 950 951 952 953 954 955
This is the peer-reviewed, final accepted version for American Mineralogist, published by the Mineralogical Society of America. The published version is subject to change. Cite as Authors (Year) Title. American Mineralogist, in press.
DOI: https://doi.org/10.2138/am-2020-7131. http://www.minsocam.org/
Always consult and cite the final, published document. See http:/www.minsocam.org or GeoscienceWorld
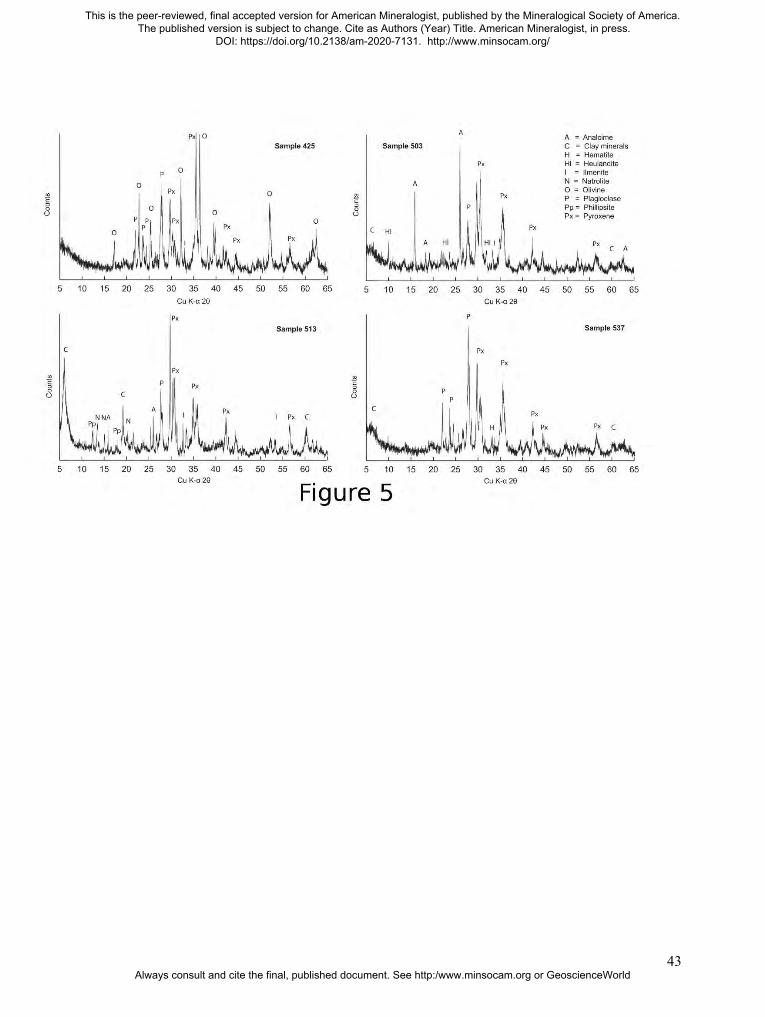
43
956 957 958
959 960 961
This is the peer-reviewed, final accepted version for American Mineralogist, published by the Mineralogical Society of America. The published version is subject to change. Cite as Authors (Year) Title. American Mineralogist, in press.
DOI: https://doi.org/10.2138/am-2020-7131. http://www.minsocam.org/
Always consult and cite the final, published document. See http:/www.minsocam.org or GeoscienceWorld

44
962
963 964 965 966
This is the peer-reviewed, final accepted version for American Mineralogist, published by the Mineralogical Society of America. The published version is subject to change. Cite as Authors (Year) Title. American Mineralogist, in press.
DOI: https://doi.org/10.2138/am-2020-7131. http://www.minsocam.org/
Always consult and cite the final, published document. See http:/www.minsocam.org or GeoscienceWorld

45
967 968
Appendix Figures 969 970
971 972 973
974
Appendix Figure 1
Appendix Figure 2
This is the peer-reviewed, final accepted version for American Mineralogist, published by the Mineralogical Society of America. The published version is subject to change. Cite as Authors (Year) Title. American Mineralogist, in press.
DOI: https://doi.org/10.2138/am-2020-7131. http://www.minsocam.org/
Always consult and cite the final, published document. See http:/www.minsocam.org or GeoscienceWorld
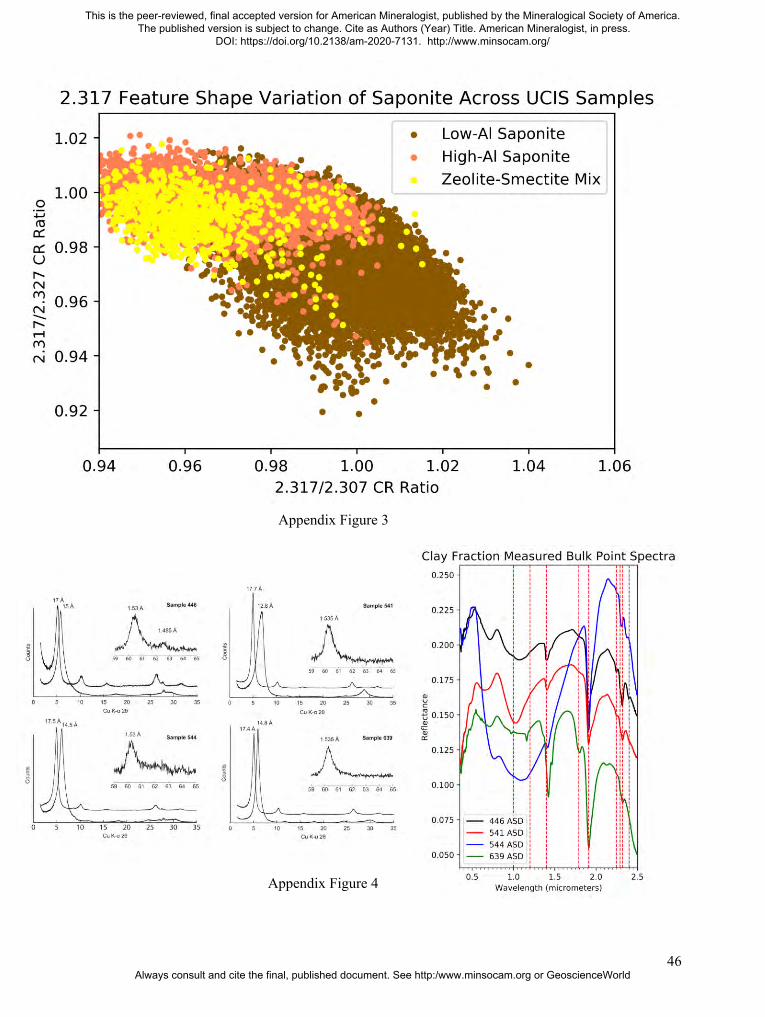
46
975 976 977
978 979
Appendix Figure 3
Appendix Figure 4
This is the peer-reviewed, final accepted version for American Mineralogist, published by the Mineralogical Society of America. The published version is subject to change. Cite as Authors (Year) Title. American Mineralogist, in press.
DOI: https://doi.org/10.2138/am-2020-7131. http://www.minsocam.org/
Always consult and cite the final, published document. See http:/www.minsocam.org or GeoscienceWorld