1 risk factor analysis - a new qualitative risk management tool pmi connections 2000 project...
TRANSCRIPT

1
Risk Factor Analysis - A New Qualitative Risk Management Tool
Risk Factor Analysis - A New Qualitative Risk Management Tool
PMI Connections 2000
Project Management Institute Seminar & Symposium
September 12, 2000 - Houston, TX
John KindingerProbabilistic Risk and Hazard Analysis Group (TSA-11)
Los Alamos National Laboratory
LA-UR 00-3444 Approved for public release; distribution is unlimited

2
Presentation TopicsPresentation Topics
• Background and Objectives for Risk Factor Analysis (RFA)
• General Approach for Performing RFA
• Example RFA Results
• Integration of RFA with Quantitative Risk Analysis

3
Objectives for the Development of RFA
Objectives for the Development of RFA
• Capable of evaluating technical risks in conceptual design, before schedule & cost baselines are available
• Easy to perform and adaptable to different projects & programs
• Systematic, objective and sufficiently comprehensive to produce meaningful specific insights
• Useable to support quantitative risk analysis

4
General Approach for Performing Risk Factor Analysis
General Approach for Performing Risk Factor Analysis
5
Tasks for Risk Factor Analysis
Tasks for Risk Factor Analysis
• List activities, tasks or other elements that make up the project
• Identify the applicable risk factors
• Develop risk-ranking criteria for each risk factor
• Evaluate each activity and rank risk for each risk factor
• Sum results across risk factors for each activity
6
Activity IdentificationActivity Identification
• Follow the logical progression of tasks or process steps being used by the project team
• Define tasks at the level of detail needed to reveal unique risk issues and important dependencies between tasks
• Document results with a simple flow chart

7
Identifying Risk FactorsIdentifying Risk Factors
• Risk factors are the drivers that will ultimately determine performance measure results
• Risk factors need to be relevant to the specific activities to be examined
• For LANL facility projects, we have developed a generic set of risk factors and grouped them into four categories
Performance Required for
Project Success
Performance Measures
Risk Factors

8
Example Qualitative Risk Factors
Example Qualitative Risk Factors
FUNDINGRISK
SCHEDULERISK
COSTRISK
TECHNICALRISK
Rework potential
Infrastructure Needs
Design & construction methods maturity
Technology maturity
Design data availability
Performance requirements severity
Productivity uncertainty
Personnel availability
Area/Facility availability
Equipment/material availability
Adverse environmental conditions
Funding constraints
Prioritization uncertainty
Under funding potential
Escalation sensitivity
Equip & material $ uncertainty
Labor rate uncertainty
Estimate completeness

9
Risk Ranking CriteriaRisk Ranking Criteria
• The assessments of risk for a given risk factor need to be made consistently across differing types of activities
• Therefore, for each risk factor, qualitative criteria are needed that define risk in each category (low, medium, high)

10
Example Qualitative Risk Ranking CriteriaExample Qualitative Risk Ranking Criteria
TECHNICAL RISK CATEGORYRISK FACTOR NONE/LOW (0/1) MEDIUM (2) HIGH (3)
TechnologyMaturity
Facilities & equipment involve onlyproven technology or newtechnology for a non-critical activity.
Facilities or equipment require theadaptation of new technology fromother applications to criticalconstruction or operating functionsfor this project.
Facilities & equipment require thedevelopment of new technology forcritical construction or operatingfunctions for this project.
Design/AnalysisData Availability
Data, specifications, andperformance requirements foranalysis or design are readilyavailable from previous work.
Data, specifications, andperformance requirements foranalysis or design have to bedeveloped, but the neededinformation is available withouttests, experiments or analysis
Data, specifications, andperformance requirements foranalysis or design have to bedeveloped, and needed informationmust come from tests, experimentsor analysis
Methods Maturity Design, analysis or constructioninvolves only proven methods ornew methods for a non-criticalactivity.
Design, analysis or constructioninvolves the adaptation of newmethods from other applications tocritical activities.
Design, analysis or constructioninvolves the development of newmethods for critical activities.
Licensing/Approval Severity
Licensing or other approvalrequirements are not severe and havebeen achieved at LANL on similarprojects.
Licensing or other approvalrequirements are severe but havebeen accomplished previously atLANL or other facilities.
Licensing or other approvalrequirements are severe and have notbeen accomplished previously atLANL or other facilities.
11
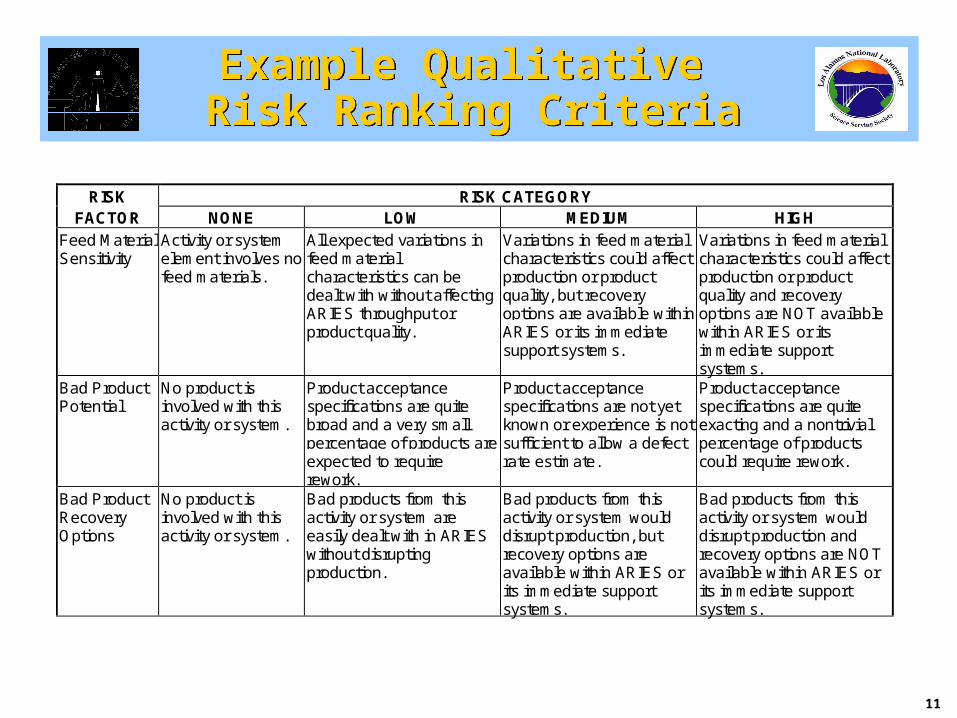
Example Qualitative Risk Ranking CriteriaExample Qualitative Risk Ranking Criteria
RISK RISK CATEGORYFACTOR NONE LOW MEDIUM HIGH
Feed MaterialSensitivity
Activity or systemelement involves nofeed materials.
All expected variations infeed materialcharacteristics can bedealt with without affectingARIES throughput orproduct quality.
Variations in feed materialcharacteristics could affectproduction or productquality, but recoveryoptions are available withinARIES or its immediatesupport systems.
Variations in feed materialcharacteristics could affectproduction or productquality and recoveryoptions are NOT availablewithin ARIES or itsimmediate supportsystems.
Bad ProductPotential
No product isinvolved with thisactivity or system.
Product acceptancespecifications are quitebroad and a very smallpercentage of products areexpected to requirerework.
Product acceptancespecifications are not yetknown or experience is notsufficient to allow a defectrate estimate.
Product acceptancespecifications are quiteexacting and a nontrivialpercentage of productscould require rework.
Bad ProductRecoveryOptions
No product isinvolved with thisactivity or system.
Bad products from thisactivity or system areeasily dealt with in ARIESwithout disruptingproduction.
Bad products from thisactivity or system woulddisrupt production, butrecovery options areavailable within ARIES orits immediate supportsystems.
Bad products from thisactivity or system woulddisrupt production andrecovery options are NOTavailable within ARIES orits immediate supportsystems.
12
Risk EvaluationRisk Evaluation
• Evaluate each task or activity against each risk factor using the ranking criteria and assess the risk level appropriately
• All risk factors may not be applicable for any specific activity
• Record the results on a worksheet, including justification for the assessment

13
1.1 I. TASK INFORMATIONTask ID: AT1Task Description: Set-up and Test System at LLNL1.3.1.2.02.05.01 Acceptance Test Procedure, 1.3.1.2.02.05.03 Software Installation andCheckout, and 1.3.1.2.02.05.03 Factory Acceptance TestEvaluation Date: 3/22/2000, 4/11/00Evaluators: KH
II. Qualitative Risk RatingTechnical Risk Factors Rating Schedule Risk Factors Rating Cost Risk Factors Rating
T1. Technology Maturity 2 S1. Area/Facility Availability 2 C1. Labor Rate Uncertainty 1T2. Rework Potential 2 S2. Personnel Availability 1 C2. Equipment/ Material Cost
Uncertainty0
T3. Infrastructure Needs 0 S3. Productivity Uncertainty 2 C3. Escalation Sensitivity 2T4. Analysis/Design DataAvailability
2 S4. Adverse EnvironmentalConditions
0 C4. Estimate Completeness 1
T5. Methods Maturity 1 S5. Equipment / MaterialsAvailability
2 C5. Other -
T6. Licensing/ ApprovalRequirements Severity
1 S6. Other -
T7. Other - 0Technical Risk Total 8 Schedule Risk Total 7 Cost Risk Total 4
III. Risk Factor CommentsTechnical Risk:LLNL has written test plans for other Argus systems and the test specification is documented prior totesting.There will be testing during the entire cycle of the software development however, if an item must bedebugged at this juncture there could be major impact on the remaining schedule. MOU2 3.13 test plan willbe submitted to LANL at least 120 days prior to test, and LANL will approve by at least 60 days prior totest. Data for debugging the systems may be generated during the test, until the test this information is notavailable.Schedule Risk:The scheduling of the test is dependent on the completion of the other activities. The LLNL testing systemis shared with LLNL safeguards and security and must be scheduled in advance to avoid schedulingconflicts.Personnel for performing the test should be available and additional personnel should not be required forthis task.The amount of time to perform the test is uncertain and may change depending on the test resultsWhenever there is the integration of many diverse products there is an uncertainty concerning theavailability of each item.Cost Risk:Personnel costs are known.No new equipment is required.
Example Task WorksheetExample Task Worksheet

14
Risk SummationRisk Summation
• Also, record the risk rankings in a table format using numbers (0-3) to represent the risk rankings
• Then sum across the risk factors for each task to get risk category and the total task score
• All risk factors are weighted equally in this process

15
Example Risk Factor Ranking & SummationExample Risk Factor
Ranking & Summation
Element A
Element B
Element C
System
A B CRisk Factor
Total
Low (1) Low (1) High (3) 5
Medium (2) High (3) Medium (2) 7
Low (1) Low (1) High (3) 5
4 5 8
Risk Factor
I
II
III
Activity Total

16
Example Results from Risk Factor Analyses
Example Results from Risk Factor Analyses

17
Example Risk Factor Analysis Results
Example Risk Factor Analysis Results
WBS #TASK
IDTASK TYPE ACTIVITY DESCRIPTION
Technical Risk
Schedule Risk Cost Risk Total Risk
ID P Install new conduit & inner duct 11 8 8 27BMD P Brass Concentrator mods design 10 6 6 22CAS2 P CAS systems install 8 9 5 22
G P Brass Gateway SW Dev 8 7 6 21CUTs3 P System Cutover 7 10 4 21
EIS P EIS Gateway SW Dev 8 7 5 201.3.1.2.2.5 AT1 P Argus & video hardware & software test at LLNL 8 7 4 19
TR3b P Operator training at LANL 5 9 5 19FM P Facility contractor mobilization 8 7 4 19
SAS2 P SAS systems install 8 6 5 191.3.1.2.3.2 AT2 P Site Acceptance Tests 6 8 4 18
CAS1 P CAS structure construction 6 8 4 18SAS1 P SAS structure construction 7 7 4 18VSI P Video SW Integration 6 5 6 17AE P Argus LANL enhancements, HGU & Chem Sensor 6 5 6 17
TR3a Prep for LANL training 6 5 6 171.3.1.2.3.3 CUT P System Cutover support 4 8 4 161.4.2.1 CD P Comm system design 10 2 4 16
BO Badge office & misc mods 7 4 5 16AEFS P Argus LANL Enhancements SW spec 9 2 4 15EISFS P EIS SW design & spec 8 2 4 14
1.3.1.2.8 AI P Install Argus & Video at LANL 6 3 5 14FOC P Install & test fiber optic cable 4 7 3 14
MAPs3 P Mapping & Station Design 4 5 4 13FP P FOC procurement 2 6 5 13CP P Facility contractor procurement 7 5 1 13
GFS P Gateway SW design & spec 8 2 2 12

18
Example Risk Factor Analysis Results
Example Risk Factor Analysis Results
0 5 10 15 20 25 30
Install new conduit & inner duct
CAS systems install
System Cutover
Argus & video hardware & software test at LLNL
Facility contractor mobilization
Site Acceptance Tests
SAS structure construction
Argus LANL enhancements, HGU & Chem Sensor
System Cutover support
Badge office & misc mods
EIS SW design & spec
Install & test fiber optic cable
FOC procurement
Gateway SW design & spec
OK for installation start
Title 3 support
LANL Startup Mgt
A/E Title 3 sup, CAS & SAS
LANL Startup Mgt
LANL PM & CM
Total Risk Score
19
Integration of RFA with Quantitative Risk Analysis
Integration of RFA with Quantitative Risk Analysis

20
Integrated Qualitative and Quantitative Risk Analysis Tasks
Integrated Qualitative and Quantitative Risk Analysis Tasks
Project Technical Baseline
Identify Risk Factors
Develop Risk Ranking Criteria
Perform Qualitative
Risk Evaluation
Qualitative Risk Factor Analysis Tasks
Identify Project
Activities
Document Risk Results
& Recom- mendations
Develop Input Data
Distributions
Build Quantitative
Model
Quantify Risk Model
Project Schedule &
Cost Baselines
Quantitative Risk Analysis Tasks

21
Input Distribution DevelopmentInput Distribution Development
• Risk Factor Analysis results provide a basis for the development of distributions used in the quantitative risk model.
Total Risk FactorAnalysis Score
0 to 8, with noHIGH Risk
Factors
9 to 12, with noHIGH Risk
Factors
> 12 or HIGHRisk Factors
PresentOverall Risk Rank LOW MEDIUM HIGH
AdjustmentFactor Guidelines
+/- 0% to 10% +/- 10% to 20% > 20%per specific
assessment by therisk analyst
Generally UsedDistributions
Triangular,Normal, Uniform,Discrete
Triangular,Normal, Uniform,Custom
Triangular,Lognormal,Custom
Confidence Level(Low/High)AssignmentGuidelines
Low Value - 10%High Value - 90%
Low Value - 20%High Value - 80%
Per specificassessment by therisk analyst

22
Format of Quantitative Risk Assessment Results
Format of Quantitative Risk Assessment Results
0%
20%
40%
60%
80%
100%
120%
12,500 13,500 14,500 15,500 16,500 17,500 18,500
$ x 1000
Pro
babi
lity
Cumulative TEC
50th Percentile Target Estimate
Target + Contingency
• Cumulative probability distributions provide a complete picture of uncertainty, it is not ignored or assumed to take on extreme values.
• Results provide a basis for setting risk-based performance targets and contingencies.
• Sensitivity analyses identify contributors to risk

23
Example Risk Reduction Recommendations
Example Risk Reduction Recommendations
RISK ISSUE RISK LEVEL RISK RESPONSEID Description Initial Current Strategy Action Assigned to Due Date Status/Comments
Control SystemCS1 Specification & development
of new software to allow the generic Argus system to function effectively at LANL are the key tasks controlling project technical, schedule & cost performance.
High High Control In order to capture the Argus software technology and successfully transfer it to LANL, 1 to 2 LANL system engineers should be placed at LLNL during this project.
The project engineer for the Pantex Argus conversion will spend half time on this project, split between LLNL and LANL.
CS2 Poor integration of various software modules (both Argus and LANL) may result in rework that impacts the cost and schedule
High Medium Control Software specifications and functional requirements will be documented and approved before development.
CS3 A software emulation "gateway" is needed to allow the Argus system to communicate with existing Brass concentrators. Gateway problems during cutover would have devastating schedule impacts.
High Medium Control A test Brass concentrator has been sent to LLNL to be used in the development of the Argus interface and to be tested with Argus before shipment to LANL.
LLNL 7/15/02 It may not be practical to test all sensor types before cutover.
CS4 If the Mapping information is not current, there could be a large impact on the schedule at cutover
Medium Low Control Implement a configuration control system to insure the system mapping is valid at cutover in 2003 and 2004
Risk Level Legend: HIGH MEDIUM LOW

24
ConclusionsConclusions
• Risk factor analysis is a qualitative risk analysis technique aimed at identifying and assessing the drivers that will determine overall project performance
• RFA has been used at Los Alamos for the early assessment of technical risks in conceptual design and later as part of integrated qualitative and quantitative risk analyses