1 - ris.org.inris.org.in/images/ris_images/pdf/thirdibsa-nassif.pdf · 2 india, brazil and south...
TRANSCRIPT

www.bndes.gov.br 1

www.bndes.gov.br 2
INDIA, BRAZIL AND SOUTH AFRICA: STRATEGIC ECONOMIC OPPORTUNITIES IN THE MAP OF
INTERNATIONAL SPECIALIZATION
André NassifBrazilian Development Bank (BNDES)*
Av. República do Chile, 100 – Sala 1401Rio de Janeiro (RJ) - [email protected]
Third India, Brazil and South Africa Summit. The Academic Forum: IBSA Partnership for Shared Prosperity and Inclusive Globalization
13-14 October 2008New Dehli - India

www.bndes.gov.br 3
The theoretical approach:
The sources of international specialization in a static framework:
Comparative advantage (Ricardo, 1817; Helpman and Krugman, 1985)
Imperfect competition (scale economies and/or product differentiation)
(Krugman, 1987; Helpman and Krugman, 1985)

www.bndes.gov.br 4
Trade according to comparative advantage and imperfect competition among developed and
developing countries
U n ite d S ta te s
E u ro p e a nU n io n
B ra z il
In tra – in d u s tr ia l tra d e
D iffe re n t ia te d g o o dsa n d s c a le -in te ns iv em a n u fa c tu rin gp ro d u c ts
A g ric u ltu ra l g o od s a n d re s o u rc e -b a s e d m a n u fa c tu r in g
D iffe re n t ia te d g o o dsa n d s c a le -in te ns iv em a n u fa c tu rin gp ro d u c ts
In tra – in d u s tr ia l tra d e
In tra – in d u s tria l tra d e
A g ric u ltu ra l g o od s a n d re s o u rc e -b a s e d m a n ufa c tu r in g
S o u rc e : F re e ly a d a p te d fro m K ru g m a n (1 9 8 7 )

www.bndes.gov.br 5
The sources of international specialization in a dynamic framework:
Technological change (dynamic comparative advantage) Dosi, Pavitt and Soete (1990)
Coordinated investments (big push)(Murphy, Shleifer and Vishny, 1989; Fujita, Krugman and Venables, 1999)
Both are driven by industrial and technological policies

www.bndes.gov.br 6
Export composition of goods of Brazil and India according to technological intensity
1989 1994 1999 2004 1989 1994 1999 2004Primary Products 11.14 10.76 11.05 13.75 6.7 5.19 5.04 4.42Manufactured Products 87.89 88.08 88.73 85.31 93.14 94.66 94.78 95.37 Resource-based 32.78 34.61 36.05 34.65 19.54 17.82 13.93 21.72 Low Technology 28.05 25.22 20.84 19.29 57.41 59.33 61.77 49.71 Medium Technology 21.61 23.72 22.81 24.07 11.68 13.83 14.24 18.61 High Tecnnology 5.44 4.52 9.01 7.29 4.5 3.66 4.82 5.31Other transactions 0.95 1.14 0.2 0.92 0.14 0.14 0.17 0.2Total Exports 100 100 100 100 100 100 100 100
Note: Elaborated according to the original classification proposed by Lall (2000). For more details, see the Appendix of Lall (2000). Source: Nassif (2007, based on Comtrade data, Unctad - United Nations (http://www.unctad.org)
Brazil IndiaDescription

www.bndes.gov.br 7
However, in the case of India, if we add the export of commercial services in the total export:
Note: Exports of goods refer to 2003 and exports of commercial services refer to 2002Source: Nassif (2007, based on Comtrade data - Unctad (http://www.unctad.org)
Textile products8,6%
Apparel7,8%
Food and beverage
6,5%
Other commercial services
9,8%
Software, communication and IT services
20,6%Chemistry
9,1%
Furniture, toys and jewels
12,9%Other goods
24,8%

www.bndes.gov.br 8
India, Brazil and South Africa in the map of international specialization

www.bndes.gov.br 9
• The data: degree of specialization of 159 countries according to Balassa Index (BI) of comparative advantage
BI > 1 (industry has comparative advantage)
BI < 1 (industry has no comparative advantage)
www.bndes.gov.br 10
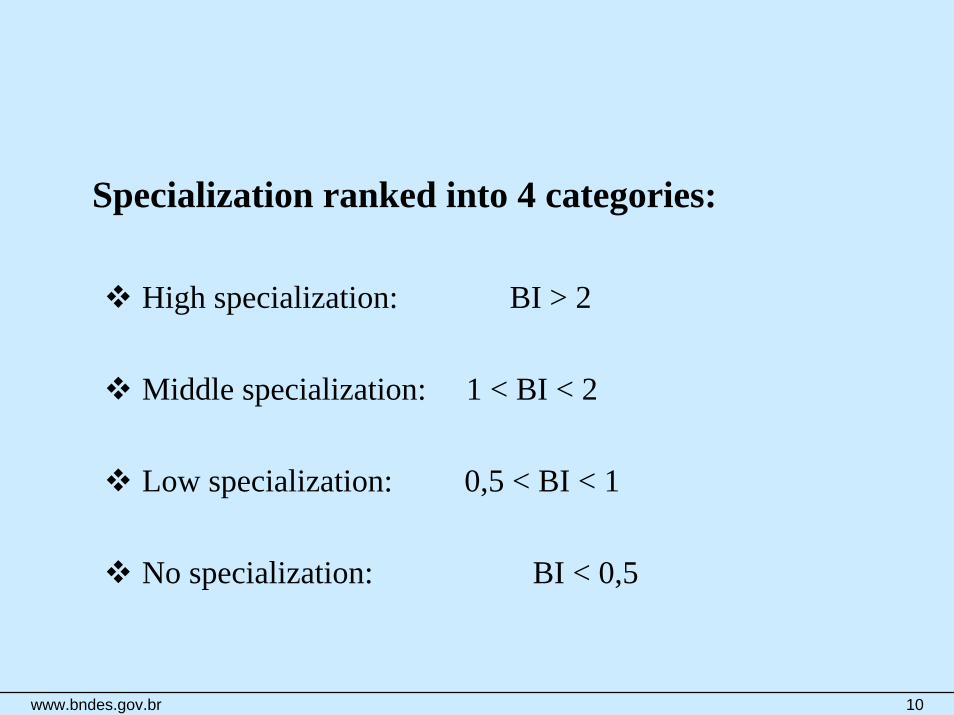
Specialization ranked into 4 categories:
High specialization: BI > 2
Middle specialization: 1 < BI < 2
Low specialization: 0,5 < BI < 1
No specialization: BI < 0,5

www.bndes.gov.br 11
Industries classified into 4 categories according to OECD taxonomy by technological intensity
Natural resource-based industries
Labor intensive industries
Capital intensive industries
High tech and science-based industries
“What you export matters for development”, Hausmann, Hwang and Rodrik, 2007:

www.bndes.gov.br 12
Map 1: Specialization in Natural Resource-Based Sectors – 2005*
* This year may differ for some countries. Source: UNComtrade (Puga and Nassif, 2008 ).

www.bndes.gov.br 13
Graph 2: Share of Natural Resource Based- Industries in Exports of SelectedCountries – 2005* (%)
0
10
20
30
40
50
60
70
80
Chi
na
US
A
Mex
ico
Tota
l
Indi
a
Can
ada
Braz
il
Chi
le
Aust
ralia
Arg
entin
a
Rus
sia
Farm Products Minning FuelsFood and Beverages Wood Pulp and PaperNon-Metal Mineral Manfct
9,3%15%
68%62%
56%
48%42%
29%26%
23%
71%
* This year may differ for some countries.
Source: UNComtrade (Puga and Nassif, 2008).

www.bndes.gov.br 14
Map 2: Specialization in Labor Intensive Sectors – 2005*
* This year may differ for some countries.
Source: UNComtrade (Puga and Nassif, 2008).

www.bndes.gov.br 15
Graph 3: Share of Labor Intensive Industries in Exports of Selected Countries –2005* (%)
0
5
10
15
20
25
30
35
40
Sout
h Af
rica
Braz
il
US
A
Ger
man
y
Mex
ico
Tota
l
Pol
and
Italy
Chi
na
Turk
ey
Indi
a
Textile Apparel Leather and Footwear Metal Products Furniture, Jewels, ...
6,4%
29%
23%
17%
8,5%7,5%
11%
6,7%10%
38%
32%
* This year may differ for some countries. Source: UNComtrade (Puga and Nassif, 2008) .

www.bndes.gov.br 16
Map 3: Specialization in Capital Intensive Sectors – 2005*
* This year may differ for some countries. Source: UNComtrade (Puga and Nassif, 2008).

www.bndes.gov.br 17
Graph 4: Share of Capital Intensive Industries in Exports of Selected Countries –2005* (%)
0
5
10
15
20
25
30
35
40
45
50
Chi
na
Rus
sia
Indi
a
Mex
ico
Bra
zil
Tota
l
USA
Hun
gry
Pol
and
Chi
le
Japa
n
Ger
man
y
Sou
th A
frica
Chemicals Rubber and Plastics Steel Industry Motor vehicles
14%
30%
24%
28% 29%
24%24%
42%
49%
41% 42%
32%35%
* This year may differ for some countries. Source: UNComtrade (Puga and Nassif, 2008).

www.bndes.gov.br 18
Map 4: Specialization in High Tech and Science-Based Sectors – 2005*
* This year may differ for some countries. Source: UNComtrade (Puga and Nassif, 2008).

www.bndes.gov.br 19
Graph 5: Share of High Tech and Science-Based Industries in Exports of SelectedCountries – 2005* (%)
0
10
20
30
40
50
Arge
ntin
a
Rus
sia
Aust
ralia
Indi
a
S. A
frica
Braz
il
Tota
l
Ger
man
y
Mex
ico
USA
Chi
na
Japa
n
Machinery and Equipments Office and Computing Machinery Electrical EquipmentComunications Equipments Precision and Optical Instrum. Aircraft, Ships, Raiways
48%47%
43%
38%
33%
11%
17%
8,5%8,3%3,9%3,9%
51%
* This year may differ for some countries. Source: UNComtrade (Puga and Nassif, 2008).
www.bndes.gov.br 20
Are there opportunities for strategic trade among IBSA?
If so, where?

www.bndes.gov.br 21
There are opportunities in industries with potential of intra-industrial trade and technological cooperation among India, Brazil and South Africa, mainly where the technological gaps are narrow.

www.bndes.gov.br 22
Brazil: “Política de Desenvolvimento Produtivo”(Policy for Industrial Development - 2008)
Brazilian Government targeted 35 industries for restructuring and/or industrial & technological policy
3 selected Areas:
Policies directed to strategic Areas: ICT Industries, Pharmaceuticals, Nuclear Energy, Biotechnology, among others
Policies directed to consolidate leadership: Aircraft, Oil, Ethanol, Metallurgy and Food Industries, among others
Policies to boost industrial competitiveness: Machinery and Equipment, Motor Vehicles, among others
www.bndes.gov.br 23
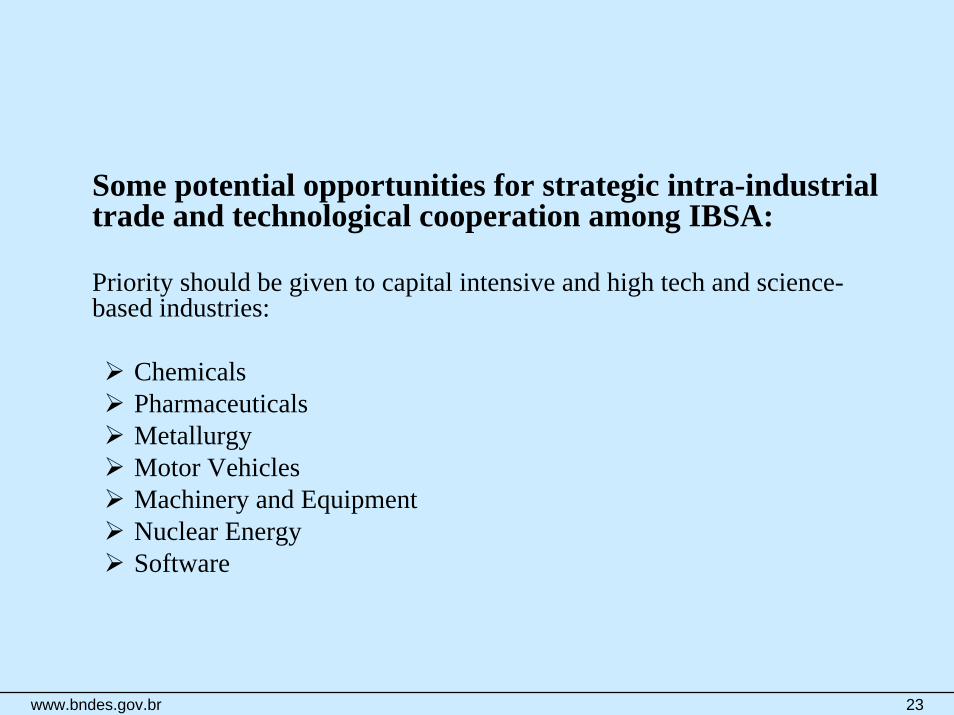
Some potential opportunities for strategic intra-industrial trade and technological cooperation among IBSA:
Priority should be given to capital intensive and high tech and science-based industries:
Chemicals PharmaceuticalsMetallurgyMotor VehiclesMachinery and EquipmentNuclear EnergySoftware

www.bndes.gov.br 24
THANK YOU VERY MUCH