1-s2.0-s0019850105000052-main impo
TRANSCRIPT
Industrial Marketing Managem
Cultural vs. operational market orientation and objective vs. subjective
performance: Perspective of production and operations
Oscar Gonzalez-BenitoT, Javier Gonzalez-Benito1
Departamento de.Administracion y Economıa de la Empresa, Universidad de Salamanca, Campus Miguel de Unamuno, 37007-Salamanca, Spain
Received 30 April 2004; received in revised form 15 November 2004; accepted 10 January 2005
Available online 2 March 2005
Abstract
The relationship between market orientation and organizational performance has been the focus of many studies for the last few years. The
conclusions reported are very diverse and even contradictory. This ambiguity is reinforced to some extent by the high degree of
methodological heterogeneity in the definition and measure of market orientation and organizational performance and the empirical
formalization of the relationship between both concepts. This study tackles this question by comparing different methodological approaches.
Three key aspects are considered: (1) cultural and operational approaches for measuring market orientation; (2) objective and subjective
measures of performance; and (3) the source of information in the organization, specifically the perspective of production and operations. The
results obtained from a sample of Spanish industrial firms show a stronger positive relationship for operational market orientation and
subjective performance. Moreover, the adoption of doperational recipesT of market orientation by the production and operations function
seems to improve organizational performance regardless of the existence of any cultural support for market orientation.
D 2005 Elsevier Inc. All rights reserved.
Keywords: Cultural/attitudinal market orientation; Operational/behavioural market orientation; Objective performance; Subjective performance; Production and
operations perspective
1. Introduction
Recent literature in business management has devoted
special attention to the growing implantation of different
practices and approaches such as organizational culture ma-
nagement, strategic human resource management, quality
management, or environmental management. These trends
have even been referred to as fashions and fads rather than as
organizational necessities (Ogbonna & Harris, 2002). Their
adoption is usually justified by the positive consequences
they have on performance. A specially relevant management
approach is market orientation, broadly defined as the adop-
tion of the marketing concept as the business philosophy
guiding the competitive strategies of the organization. Al-
0019-8501/$ - see front matter D 2005 Elsevier Inc. All rights reserved.
doi:10.1016/j.indmarman.2005.01.002
T Corresponding author. Tel.: +34 923 294 500x3508; fax: +34 923
294 715.
E-mail addresses: [email protected] (O. Gonzalez-Benito)8
[email protected] (J. Gonzalez-Benito).1 Tel.: +34 923 294 500x3502; fax: +34 923 294 715.
though a positive relationship betweenmarket orientation and
performance has been claimed for several decades now, the
interest in providing empirical evidence is relatively recent.
During the last fifteen years, a plethora of studies has
empirically analysed the effects of market orientation on
organizational performance. Nevertheless, the reported
results are not conclusive. Although many studies argue
and find a positive relationship, some others find a non-
significant or negative relationship. While the meta-analysis
reported by Rodriguez-Cano, Carrillat, and y Jaramillo
(2004) supports a positive relationship between market
orientation and performance, the reviews of Langerak
(2003a), Sin et al. (2000) or Tse, Sin, Yau, Lee, and Chow
(2003) point out that the existence of such a relationship and
the circumstances in which it takes place are still open
questions without unequivocal response. In this respect,
Slater and Narver (2000) point out the importance of
replicating studies with substantive modifications of the
conceptual and methodological methods for increasing the
confidence in previous findings. However, this methodolog-
ent 34 (2005) 797–829
O. Gonzalez-Benito, J. Gonzalez-Benito / Industrial Marketing Management 34 (2005) 797–829798
ical heterogeneity implies an additional challenge to provide
conclusive answers (Noble, Sinha, & Kumar, 2002). The
variety of approaches to the empirical formalization of the
relationship between marketing orientation and performance
constitutes a possible cause of the diversity, and inconsis-
tency, in the conclusions reported.
This paper focuses on the different approaches to
defining and measuring market orientation and organiza-
tional performance. The underlying argument is that differ-
ent definitions and measures capture different nuances of
these constructs and, as a consequence, the relationship
between them might vary across the approaches. In other
words, market orientation and performance are broad
concepts whose relationship depends on the specific way
in which they are interpreted and empirically studied. In
particular, the focus is on three key aspects:
(1) The distinction between cultural and operational ap-
proaches to market orientation—the definition and
measurement of market orientation can focus on the
attitudes, values and beliefs of managers (Slater &
Narver, 1994), or on the processes, activities and
behaviours within the organization (Kohli & Jaworski,
1990). In this respect, Griffiths andGrover (1998) point
out that both approaches to market orientation are
compatible and complementary because behaviour is
the basis for the formation of beliefs and values, and
culture provides the rules of behaviour. However, the
duality between culture and behaviour within the
concept of market orientation also implies that both
approaches can be separately implemented in the sense
that organizations can emphasize market-oriented cul-
ture while neglecting its conversion into market-orien-
ted activities, or vice versa. This possibility leads us to
wonder whether cultural and operational market ori-
entations have different consequences on performance.
(2) The distinction between objective and subjective
measures of organizational performance—the meas-
urement of organizational performance can focus on
objectively quantifiable accounting or operative indi-
cators or on the subjective assessment of performance
in comparison to objectives and competitors (Dawes,
1999). Some studies have reported different conclu-
sions about the relationship betweenmarket orientation
and organizational performance depending on the
objective or subjective measurement of the latter
variable. For example, the seminal study of Jaworski
and Kohli (1993) only found a positive relationship for
subjective performance. This circumstance leads us to
wonder whether there are differences in the potential of
objective or subjective measurement of performance to
capture the consequences of market orientation.
(3) The role of the source of information within the
organization—although market orientation should
underlie the whole organization, the cultural and
operational adoption of market orientation might differ
across functional areas, presumably being less intense
for those functional areas most removed from custom-
ers. Some studies have found modest congruence
between market orientation reported by different
managers within the same organization. For example,
the study of Jaworski and Kohli (1993) found modest
correlations between marketing and non-marketing
informants. This kind of result leads us to wonder
whether the relationship between market orientation
and performance prevails when the former is measured
in the production and operations functional area.
The aim of this paper is to provide additional evidence of
the relationship between market orientation and organiza-
tional performance by the explicit comparison of these
different approaches to the empirical formalization of the
constructs. Two key questions synthesise the main contribu-
tion of the paper. On the one hand, the paper analyses whether
the benefits derived from market orientation require the
cultural conversion of the organization or simply the imple-
mentation of some processes and activities. In other words,
the question is to what extent organizations can learn fruitful
market orientation behaviours without prioritizing their
essential values. On the other hand, the paper analyses
whether the benefits derived from market orientation are
reflected by objective indicators of performance, or whether
they imply more complex and long-term consequences only
captured by subjective performance measurement. In addi-
tion, contrary to most of the previous studies, all these ques-
tions are analysed from the perspective of production and
operations managers. Therefore, the paper deals with themar-
ket orientation that goes beyond the marketing function or top
management and is perceived from internal functional areas.
The subsequent contents are divided into four more
sections. First, a theoretical framework is developed through
a review of the literature. That leads to the enunciation of
the research hypotheses. Next, the methodology for testing
the empirical hypotheses is described. After that, the results
are presented, interpreted and discussed. Finally, the main
conclusions and implications are summarised.
2. Literature review and working hypotheses
As mentioned above, many empirical studies have
provided empirical evidence of the relationship between
market orientation and performance over the last few years.
This growing research interest has been inspired in some
pioneering studies such as Deshpande, Farley, and Webster
(1993), Jaworski and Kohli (1993), Lusch and Laczniak
(1987), Narver and Slater (1990), or Ruekert (1992).
Appendix 1 presents an extensive sample of published
papers in this research field. Although most of them use the
term dmarket orientationT, others use terms such as
dmarketing orientationT, dcustomer orientationT, dmarket
drivenT, or simply dimplementation of the marketing

O. Gonzalez-Benito, J. Gonzalez-Benito / Industrial Marketing Management 34 (2005) 797–829 799
conceptT with almost similar meanings. Sometimes the
relationship between market orientation and performance
constitutes the main objective, while other times it is a
complementary result of the achievement of other objec-
tives. In any case, as reflected in the section of Appendix 1
devoted to the population analysed, a broad spectrum of
contexts has been studied. Different geographical scenarios
characterised by different economic and political situations
have been analysed; industrial markets, consumer markets,
and export markets have been distinguished; different
activities such as products, services and specific sectors
(machinery, biotechnology, textile, distribution, hotel indus-
try, health, financial and insurance services, etc.) have been
considered, and even different sizes, competitive strategies
or competitive environment situations. The relationship has
also been assessed in the field of not for profit organizations,
such as public administrations, educational centres or
charity institutions.
Any study dealing with the relationship between market
orientation and performance requires the empirical formal-
ization of (1) the measure of market orientation, (2) the
measure of organizational performance, and (3) the nature of
the relationship between both measures. Appendix 1 also
describes the revised studies according to these three
questions. The section devoted to market orientation
measures describes the scales used, their cultural or opera-
tional emphasis, and the source of information. The section
devoted to performance measures describes the kind of
variables used, their objective or subjective character, and
the source of information. Finally, the section devoted to
results describes the reported conclusions with respect to the
market orientation–performance relationship and the mod-
erating circumstances. The observed differences in measure-
ment approaches and results motivate the hypotheses of this
study.
2.1. Cultural vs. operative market orientation
The notion of market orientation is related to the
adoption of the marketing concept as a business philoso-
phy. In this respect, market orientation can be defined as an
organizational culture (Slater & Narver, 1994). Specifically,
it comprises the set of beliefs that puts the customer’s
interest first in order to develop a long-term profitable
organization (Deshpande et al., 1993). Alternatively,
market orientation can be defined as the set of activities,
processes and behaviours derived from the implementation
of the marketing concept (Kohli & Jaworski, 1990). Some
authors only recognize this latter operative/behavioural
meaning and use the term dmarketing orientationT, or
simply dadoption of the marketing conceptT, to refer to the
cultural / attitudinal approach (e.g. Deng & Dart, 1994;
Diamantopoulos & Hart, 1993; Gray, Matear, Boshoff, &
Mathesonet, 1998).
From a methodological point of view, the operational
approach predominates over the cultural approach when the
effect on organizational performance is analysed. Almost
95% of the studies described in Appendix 1 used market
orientation scales with operative emphasis, while only 9%
analysed the relationship between some kind of cultural
scale and performance. Two circumstances should be borne
in mind in this respect. First, the operational conceptualisa-
tion proposed by Kohli and Jaworski (1990)—empirically
formalised in the MARKOR scale (Kohli, Jaworski, &
Kumar, 1993)—has been widely accepted. Second, other
scales developed from the cultural perspective and also
widely accepted in the literature—such as the MKTOR of
Narver and Slater (1990) and the DFW of Deshpande et al.
(1993)—have focused on the measurement of operational
aspects [see the discussion in this respect in Deshpande and
Farley (1998a,b) and Narver and Slater (1998)]. About 40%
and 35% of the studies described in Appendix 1 used or
adapted the MARKOR and MKTOR scales, respectively.
Less than 5% of the studies revised in Appendix 1 have
simultaneously considered cultural and operational meas-
ures and their relationship to performance (Alvarez, Santos,
& Vazquez, 2000; Avlonitis & Gounaris, 1997; Diamanto-
poulos & Hart, 1993; Gray et al., 1998; Homburg &
Pflesser, 2000). All of them have found congruence between
both approaches. In fact, the congruence between both
measures has been used as proof of convergent validity in
the assessment of several operational scales of market
orientation (e.g. Deng & Dart, 1994; Deshpande & Farley,
1998a; Kohli et al., 1993). This evidence suggests that the
cultural adoption and the operational implementation of
market orientation are closely related.
Cultural market orientation has been interpreted as an
antecedent of operational market orientation (e.g. Alvarez et
al., 2000; Gray, Greenley, Matear, & Matheson, 1999;
Homburg & Pflesser, 2000). Narver and Slater (1998)
indicate that when market orientation is measured through
certain specific activities and manifestations, the underlying
belief system is being measured. In other words, the belief
that customer satisfaction is the best way to achieve a long-
term positional advantage enhances the implementation of
activities and processes for reaching this objective. Another
argument in this respect is the fact that the top management
emphasis constitutes a determinant of operational market
orientation (e.g. Bhuian, 1998; Cervera, Mola, & Sanchez,
2001; Horng & Chen, 1998; Jaworski & Kohli, 1993;
Puledran, Speed, & Widing, 2000; Selnes, Jaworski, &
Kohli, 1996; Shoham & Rose, 2001). These arguments lead
us to think that organizations adopt first a cultural orientation
and then develop consistent behaviours.
However, the opposite line of reasoning has also been
contemplated in the literature. As pointed out by Griffiths
and Grover (1998), behaviour constitutes the basis for the
progressive development of the beliefs, values and attitudes
that make up the organizational culture. That is, operational
market orientation might be an antecedent of cultural market
orientation. Moreover, the research emphasis on demarcat-
ing the activities that characterise a market-oriented firm has
O. Gonzalez-Benito, J. Gonzalez-Benito / Industrial Marketing Management 34 (2005) 797–829800
facilitated the adoption of doperational recipesT that are not
based on a cultural transformation. These arguments lead us
to think that there might be firms which have implemented
market-oriented behaviour without having embraced market
orientation beliefs and values.
The incongruence between cultural and operational
market orientation may become stronger when functional
areas other than sales or marketing are considered. Although
market orientation should involve the whole organization
(Webster, 1992), some studies that have measured market
orientation using multiple respondents with different man-
aging roles within the organization have reported some kind
of disagreement between them. About 20% of the studies
revised in Appendix 1 used more than one informant within
each organization in the sample. Some of these studies
report moderate correlations across respondents (e.g. Jawor-
ski & Kohli, 1993; Jones, Busch, & Dacin, 2003; Raju,
Lonial, & Gupta, 1995; Ruekert, 1992). For example,
Jaworski and Kohli (1993) interviewed marketing and
non-marketing managers and, in their own words,
balthough the two reports were positively correlated, the
correlations were not perfect, which suggests that the two
informants were keying in on different perspectives in
providing their responsesQ. In particular, it seems reason-
able to assume that in functional areas such as production
and operations, which are dless close to customersT and
immersed in the achievement of specific effectiveness and
efficiency objectives, the implementation of market orien-
tation is weaker, specially in the cultural sense. The adop-
tion of market-oriented activities and practices might be a
consequence of the development of corporate policies or a
consequence of an interest in following management
trends, instead of the conviction of production and opera-
tions managers. In short, the perspective of the production
and operations function stresses the claim that the adop-
tion of the cultural dimension is not a necessary condition
for the implementation of the operational dimension.
These arguments are summarised in the following two
hypotheses:
H1. There is a positive relationship between the cultural and
operational market orientation of the production and
operations function.
1
2
3
Market orientation
CULTURAL CAPABILITIES STRATEGIC A
Entrepreneurship orientation
Learningorientation
Differentiationstrategy
Adaptative andproactive innovation
Organizational competence
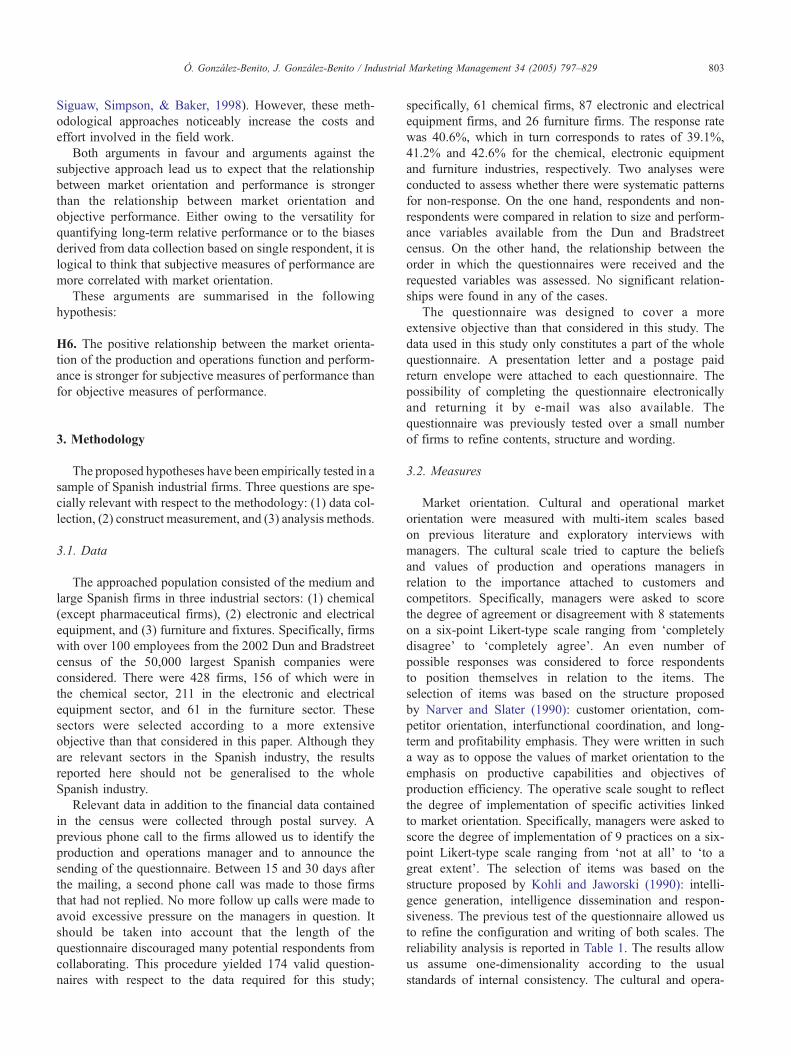
Fig. 1. Market orientation–pe
H2. Cultural market orientation is not necessarily an
antecedent of operational market orientation in the produc-
tion and operations function.
2.2. Relationship between market orientation and
performance
The interest in market orientation is based on how it
affects organizational performance. Narver and Slater (1990)
consider profitability as a decision criteria in market-oriented
firms. In general, a positive effect on market position, long-
term viability and performance has been claimed. The effect
has even been used to argue criterion-related validity in
several measurement scales of market orientation (e.g. Deng
& Dart, 1994; Deshpande & Farley, 1998a,b; Gray et al.,
1998; Kohli et al., 1993; Lado, Maydeu-Olivares, & Rivera,
1998; Soehadi, Hart, & Tagg, 2001).
A theoretical justification of the relationship is proposed
in Fig. 1. At least three kinds of positive consequences of
market orientation have been identified in the literature
review summarised in Appendix 1:
(1) Effectiveness (1 in Fig. 1). Market orientation is an
organizational resource that might lead to competitive
advantage through the understanding of consumer
needs and what competitors offer and the development
of coordinated and adapted competing strategies (Hunt
&Morgan, 1995). The source of competitive advantage
is the creation of superior value for consumers. Its
achievement is primarily based on a differentiation
strategy (Kumar, Submaranian, & Strandholm, 2002;
Langerak, 2003b;Narver&Slater, 1990, 1998; Pelham,
1997a, 1999, 2000; Pelham &Wilson, 1996; Hooley et
al., 1999a,b; Vazquez, Santos, & Alvarez, 2001).
(2) Sustainability (2 in Fig. 1). The sustainability of
superior value has been criticised because the emphasis
on consumer needs obviates the role of innovation, at
least in relation to proactive innovation as compared to
adaptive innovation (e.g. Christensen & Bower, 1996;
Connor, 1999; Hamel & Prahalad, 1994; Hayes &
Weelwright, 1984). However, such a dtyranny of the
market servedT has been rejected because it implies a
quite simple conception of market orientation. Market
Efficiency
CTIONS
Effectiveness
PERFORMANCE
Sustainability
Effective, efficient and sustainablesuperior value for / satisfaction
of consumers
Competitiveadvantage
rformance relationship.

O. Gonzalez-Benito, J. Gonzalez-Benito / Industrial Marketing Management 34 (2005) 797–829 801
orientation is not only about the understanding of
current customersT needs, but also about anticipating
their latent needs (Slater &Narver, 1998, 1999). In fact,
many studies have found a close relationship between
market orientation and innovation (e.g. Agarwal, Er-
ramilli, & Dev, 2003; Appiah-Adu & Singh, 1998;
Han, Kim, & Srivastava, 1998; Matear, Osborne, Gar-
rett, & Gray, 2002; Maydeu-Olivares & Lado, 2003;
Slater & Narver, 1996; Vazquez et al., 2001). In any
case, market orientation has been related to learning
orientation (e.g. Baker & Sinkula, 1999a,b; Farrell,
2000; Hurley & Hule, 1998; Noble et al., 2002; Santos,
Sanzo, Alvarez, & Vazquez, 2001) and entrepreneur-
ship orientation (e.g. Atuahene-Gima & Ko, 2001;
Barret & Weinstein, 1998; Becherer & Maurer, 1997;
Matsuno, Mentzer, & Ozsomer, 2002; Wood, Bhuian,
& Kiecker, 2000). They are thought of as complemen-
tary concepts underlying the achievement of innova-
tion orientation. Hult and Ketchen (2001), Hult, Snow,
and Kandemir (2003), Liu, Luo, and Shi (2003) or
Slater and Narver (1995) state that the combination of
market, learning, entrepreneurship and innovation
orientation leads organizations to positional advantage,
and consequently, sustainable superior performance.
(3) Efficiency (3 in Fig. 1). Previous arguments imply
greater and sustainable effectiveness and better market
position in terms of image, reputation, sales, market
share, etc. However, greater efficiency also requires
some control over the costs involved in the achieve-
ment of effectiveness. In this respect, market orienta-
tion has been associated with a more efficient resource
allocation (Chang&Chen, 1998). It not only affects the
formulation of the strategy but also its implementation
(Dobni & Luffman, 2003), by providing discipline,
cohesion and internal coordination (Pelham & Wilson,
1996). In particular, market orientation has been related
to greater emphasis on employee recruitment, training
and compensation (e.g. Horng & Chen, 1998; Jaworski
& Kohli, 1993; Puledran et al., 2000; Ruekert, 1992;
Selnes et al., 1996; Shoham & Rose, 2001), and
positive effects on employee commitment and satis-
faction have been found (e.g. Caruana, Ramaseshan, &
Ewing, 1999; Horng & Chen, 1998; Jaworski & Kohli,
1993; Jones et al., 2003; Selnes et al., 1996; Shoham &
Rose, 2001; Siguaw, Brown, & Widing, 1994).
Empirical evidence to a great extent supports the relation-
ship between market orientation and performance, although
sometimes subject to specific circumstances of the compet-
itive environment. Nearly 88% of the studies revised in
Appendix 1 found a positive relationship between measures
of market orientation and measures of performance. Another
6% only found positive relationships under specific circum-
stances determined by moderating variables. However,
many of these studies did not find positive relationships
for all performance measures, circumstances and situations
considered. Moreover, there are empirical contributions that
did not find any relationship or reported the opposite
conclusions concerning the situations in which the relation-
ship takes place. In particular, Kahn (2001) found different
conclusions depending on the role of the respondent within
the organization, the relationship for marketing managers
being stronger than for production or R and D managers.
This impedes an unequivocal conclusion about the existence
and nature of the relationship (Langerak, 2003a; Sin et al.,
2000; Tse et al., 2003). Therefore, it is necessary to provide
more empirical evidence while monitoring the influence of
different methodological approaches.
In particular, it is relevant to study the role of cultural and
operational approaches in measuring market orientation,
especially because some degree of incongruence between
both approaches has been argued above, mainly in functional
areas more removed from customers, such as production and
operations. If the sequence culture–strategy–performance is
assumed, the practices and processes should constitute the
trigger for superior performance. Narver and Slater (1990)
point out that market orientation is the organizational culture
that most effectively and efficiently creates the necessary
behaviour for the creation of superior value for customers
and, thus, continuous superior performance for the organ-
ization. More specifically, Homburg and Pflesser (2000)
suggest that market-oriented values lead to market-oriented
norms, and market-oriented norms lead to market-oriented
behaviours. Therefore, a competitive advantage is reached by
transforming market orientation culture into specific actions.
Moreover, the adoption of market-oriented practices might
have similar effects, even though it is not based on a cultural
market orientation. In sum, it is reasonable to expect that the
relationship between market orientation and performance is
stronger for the operational approach than for the cultural
approach.
However, the measurement of an operational market
orientation quantifies the degree of implementation and
development of a set of practices and activities, but not the
quality and rigour of this implementation. The inconsisten-
cies found between market orientation perceived within the
organization and market orientation perceived externally by
customers or other agents of the environment supports this
argument (e.g. Deshpande & Farley, 1999; Deshpande et al.,
1993; Farrelly & Quester, 2003; Krepapa, Bherthon, Webb,
& Pitt, 2003). Therefore, it is reasonable to assume that the
effectiveness and efficiency of an operational market
orientation is related to the managing team’s belief in the
importance of the marketing concept. As pointed out by
Narver and Slater (1998), only a strong culture can produce
such consistent behaviour and performance.
These arguments are summarised in the following three
hypotheses:
H3. There is a positive relationship between the market
orientation of the production and operations function and
performance.

O. Gonzalez-Benito, J. Gonzalez-Benito / Industrial Marketing Management 34 (2005) 797–829802
H4. The positive relationship between the market orienta-
tion of the production and operations function and perform-
ance is stronger for operational market orientation than for
cultural market orientation.
H5. The cultural and operational market orientations of the
production and operations function have a synergic effect on
organizational performance.
2.3. Objective vs. subjective performance
Another relevant question in the analysis of the
relationship between market orientation and performance
is the definition and measurement of the latter concept.
The diversity of performance measures used in the litera-
ture constitutes an additional source of methodological
heterogeneity.
In general, the measurement of organizational perform-
ance has been a traditional research field in strategic
management (Connolly, Conlon, & Deutsch, 1980; Marr
& Schiuma, 2003; Venkatraman & Ramanujam, 1986).
Several classification criteria have been proposed. In order
to shed light on this matter, it is possible to distinguish
between effectiveness and efficiency measures. The former
refer to the consolidation of a strong market position—for
example, customer satisfaction, image and reputation,
sales, market share, or new product success. The latter
refer to optimal resource allocation—for example, benefit,
profitability or ROI. A distinction between situation
measures—related to current performance—and trend
measures—related to the change in performance—can
also be made. In this line, Baker and Sinkula (1999a,b)
distinguish between the effectiveness dimension of per-
formance—related to success in comparison to compet-
itors—and adaptability measures—related to the success in
responding over time to changing conditions and oppor-
tunities in the environment. Venkatraman and Ramanujam
(1986) suggest a two-dimensional classification scheme.
On the one hand, they differentiate between financial and
operational indicators, and on the other hand, they
distinguish between primary and secondary sources of
information. Financial measures are related to accounting
measures and economic performance—for example, profit
or sales. Operational measures refer to the operational
success factors that might lead to financial performance—
for example, customer satisfaction, quality, market share
or new product development. Data for primary measures
is collected directly from the organization, while informa-
tion for secondary measures is collected from external
databases.
An additional interesting classification distinguishes
between objective and subjective measures. The former
refer to performance indicators impartially quantified. They
are generally financial indicators obtained directly from
organizations or through secondary sources. The latter refer
to the judgmental assessment of internal or external
respondents. They usually cover both financial and opera-
tional/commercial indicators. Some studies have found
consistency between objective and subjective measures
(e.g. Covin, Slevin, & Schultz, 1994; Dawes, 1999; Dess
& Robinson, 1984; Han et al., 1998; Hart & Banbury, 1994;
Pearce, Robbins, & Robinson, 1987; Venkatraman &
Ramanujam, 1987). Nevertheless, they also recognize the
existence of some divergences and the convenience of both
approaches. In particular, several studies centred on the
relationship between market orientation and performance
have reached different conclusions depending on the
consideration of objective or subjective measures of
performance. Nearly 12% of the studies revised in Appendix
1 used both approaches to measure performance. Almost
50% of these studies reported a stronger relationship for
subjective performance than for objective performance
(Agarwal et al., 2003; Balabanis, Stables, & Phillips,
1997; Gray et al., 1998, 1999; Jaworski & Kohli, 1993;
Martin & Grbac, 2003; Schlegelmilch & Ram, 2000; Selnes
et al., 1996). On the contrary, only 20% reported a stronger
relationship for objective than for subjective performance
(Atuahene-Gima & Ko, 2001; Hooley, Lynch, & Shepherd,
1990; Voss & Voss, 2000).
Objective measures of performance are difficult to obtain
or insufficiently reliable. Some authors have pointed out the
poor reliability of secondary sources, and the difficulty of
obtaining such data directly from organizations because of
both the refusal to divulge such information or the lack of
interest and time on the part of managers (e.g. Caruana,
Ramaseshan, & Ewing, 1998a,b, 1999; Pitt, Caruana, &
Berthon, 1996). Moreover, the subjective approach facili-
tates the measurement of complex dimensions of perform-
ance, such as brand equity or customer satisfaction.
Subjective measurement also facilitates cross-sectional
analysis through sectors and markets because performance
can be quantified in comparison to objectives or competitors
(Hooley et al., 1999a,b). Judgmental assessments also make
it easier to take into account lagged effects and the particular
strategy of the organization (Jaworski & Kohli, 1993). This
leads us to think that subjective performance is more
adequate for capturing the consequences of market orienta-
tion than objective performance.
On the contrary, the analysis of the relationship between
market orientation and subjective performance might be
biased by the dhalo effectT. The response style or the interestin communicating a positive image can lead to a false
correlation between both concepts when a single respondent
is used. This circumstance would falsely reinforce the
estimated relationship between market orientation and
subjective performance. Some studies have solved this
limitation by considering different respondents for measur-
ing market orientation and performance, both within the
organization (Pelham, 1997a; Salomo, Steinhoff, &
Trommsdorffet, 2003; Slater & Narver, 2000) and outside
the organization (Deshpande & Farley, 1999; Deshpande et
al., 1993; Farrelly & Quester, 2003; Jones et al., 2003;
O. Gonzalez-Benito, J. Gonzalez-Benito / Industrial Marketing Management 34 (2005) 797–829 803
Siguaw, Simpson, & Baker, 1998). However, these meth-
odological approaches noticeably increase the costs and
effort involved in the field work.
Both arguments in favour and arguments against the
subjective approach lead us to expect that the relationship
between market orientation and performance is stronger
than the relationship between market orientation and
objective performance. Either owing to the versatility for
quantifying long-term relative performance or to the biases
derived from data collection based on single respondent, it is
logical to think that subjective measures of performance are
more correlated with market orientation.
These arguments are summarised in the following
hypothesis:
H6. The positive relationship between the market orienta-
tion of the production and operations function and perform-
ance is stronger for subjective measures of performance than
for objective measures of performance.
3. Methodology
The proposed hypotheses have been empirically tested in a
sample of Spanish industrial firms. Three questions are spe-
cially relevant with respect to the methodology: (1) data col-
lection, (2) construct measurement, and (3) analysis methods.
3.1. Data
The approached population consisted of the medium and
large Spanish firms in three industrial sectors: (1) chemical
(except pharmaceutical firms), (2) electronic and electrical
equipment, and (3) furniture and fixtures. Specifically, firms
with over 100 employees from the 2002 Dun and Bradstreet
census of the 50,000 largest Spanish companies were
considered. There were 428 firms, 156 of which were in
the chemical sector, 211 in the electronic and electrical
equipment sector, and 61 in the furniture sector. These
sectors were selected according to a more extensive
objective than that considered in this paper. Although they
are relevant sectors in the Spanish industry, the results
reported here should not be generalised to the whole
Spanish industry.
Relevant data in addition to the financial data contained
in the census were collected through postal survey. A
previous phone call to the firms allowed us to identify the
production and operations manager and to announce the
sending of the questionnaire. Between 15 and 30 days after
the mailing, a second phone call was made to those firms
that had not replied. No more follow up calls were made to
avoid excessive pressure on the managers in question. It
should be taken into account that the length of the
questionnaire discouraged many potential respondents from
collaborating. This procedure yielded 174 valid question-
naires with respect to the data required for this study;
specifically, 61 chemical firms, 87 electronic and electrical
equipment firms, and 26 furniture firms. The response rate
was 40.6%, which in turn corresponds to rates of 39.1%,
41.2% and 42.6% for the chemical, electronic equipment
and furniture industries, respectively. Two analyses were
conducted to assess whether there were systematic patterns
for non-response. On the one hand, respondents and non-
respondents were compared in relation to size and perform-
ance variables available from the Dun and Bradstreet
census. On the other hand, the relationship between the
order in which the questionnaires were received and the
requested variables was assessed. No significant relation-
ships were found in any of the cases.
The questionnaire was designed to cover a more
extensive objective than that considered in this study. The
data used in this study only constitutes a part of the whole
questionnaire. A presentation letter and a postage paid
return envelope were attached to each questionnaire. The
possibility of completing the questionnaire electronically
and returning it by e-mail was also available. The
questionnaire was previously tested over a small number
of firms to refine contents, structure and wording.
3.2. Measures
Market orientation. Cultural and operational market
orientation were measured with multi-item scales based
on previous literature and exploratory interviews with
managers. The cultural scale tried to capture the beliefs
and values of production and operations managers in
relation to the importance attached to customers and
competitors. Specifically, managers were asked to score
the degree of agreement or disagreement with 8 statements
on a six-point Likert-type scale ranging from dcompletely
disagreeT to dcompletely agreeT. An even number of
possible responses was considered to force respondents
to position themselves in relation to the items. The
selection of items was based on the structure proposed
by Narver and Slater (1990): customer orientation, com-
petitor orientation, interfunctional coordination, and long-
term and profitability emphasis. They were written in such
a way as to oppose the values of market orientation to the
emphasis on productive capabilities and objectives of
production efficiency. The operative scale sought to reflect
the degree of implementation of specific activities linked
to market orientation. Specifically, managers were asked to
score the degree of implementation of 9 practices on a six-
point Likert-type scale ranging from dnot at allT to dto a
great extentT. The selection of items was based on the
structure proposed by Kohli and Jaworski (1990): intelli-
gence generation, intelligence dissemination and respon-
siveness. The previous test of the questionnaire allowed us
to refine the configuration and writing of both scales. The
reliability analysis is reported in Table 1. The results allow
us assume one-dimensionality according to the usual
standards of internal consistency. The cultural and opera-
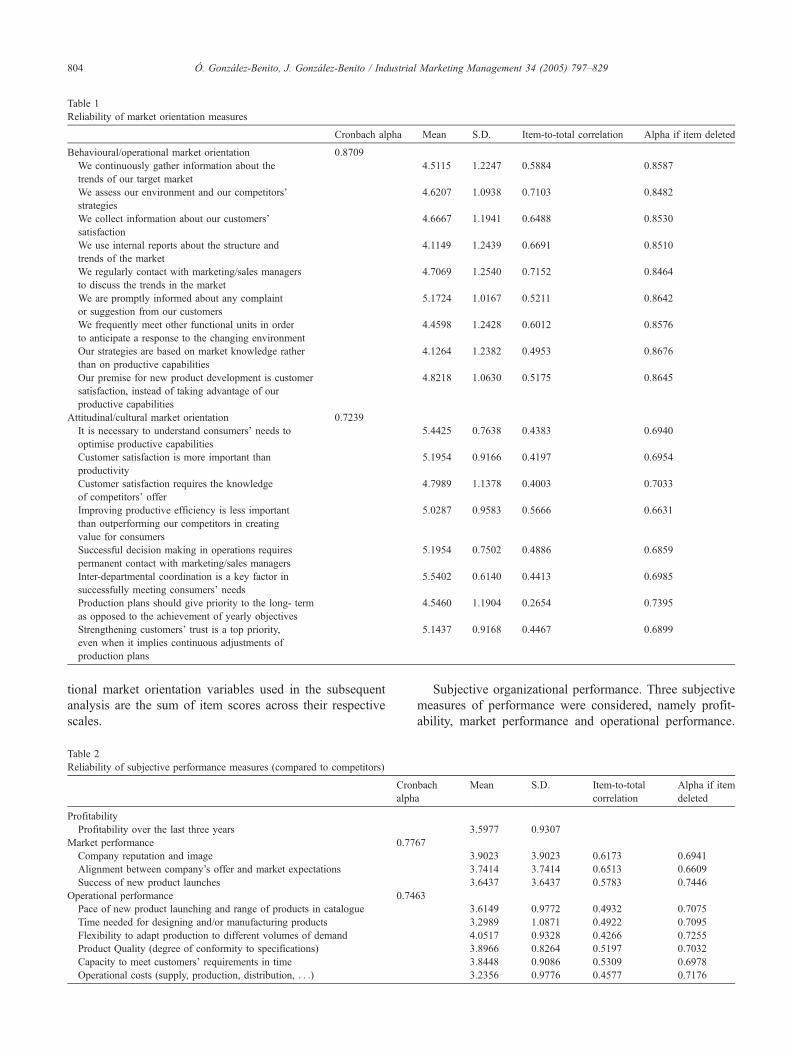
Table 1
Reliability of market orientation measures
Cronbach alpha Mean S.D. Item-to-total correlation Alpha if item deleted
Behavioural/operational market orientation 0.8709
We continuously gather information about the
trends of our target market
4.5115 1.2247 0.5884 0.8587
We assess our environment and our competitors’
strategies
4.6207 1.0938 0.7103 0.8482
We collect information about our customers’
satisfaction
4.6667 1.1941 0.6488 0.8530
We use internal reports about the structure and
trends of the market
4.1149 1.2439 0.6691 0.8510
We regularly contact with marketing/sales managers
to discuss the trends in the market
4.7069 1.2540 0.7152 0.8464
We are promptly informed about any complaint
or suggestion from our customers
5.1724 1.0167 0.5211 0.8642
We frequently meet other functional units in order
to anticipate a response to the changing environment
4.4598 1.2428 0.6012 0.8576
Our strategies are based on market knowledge rather
than on productive capabilities
4.1264 1.2382 0.4953 0.8676
Our premise for new product development is customer
satisfaction, instead of taking advantage of our
productive capabilities
4.8218 1.0630 0.5175 0.8645
Attitudinal/cultural market orientation 0.7239
It is necessary to understand consumers’ needs to
optimise productive capabilities
5.4425 0.7638 0.4383 0.6940
Customer satisfaction is more important than
productivity
5.1954 0.9166 0.4197 0.6954
Customer satisfaction requires the knowledge
of competitors’ offer
4.7989 1.1378 0.4003 0.7033
Improving productive efficiency is less important
than outperforming our competitors in creating
value for consumers
5.0287 0.9583 0.5666 0.6631
Successful decision making in operations requires
permanent contact with marketing/sales managers
5.1954 0.7502 0.4886 0.6859
Inter-departmental coordination is a key factor in
successfully meeting consumers’ needs
5.5402 0.6140 0.4413 0.6985
Production plans should give priority to the long- term
as opposed to the achievement of yearly objectives
4.5460 1.1904 0.2654 0.7395
Strengthening customers’ trust is a top priority,
even when it implies continuous adjustments of
production plans
5.1437 0.9168 0.4467 0.6899
O. Gonzalez-Benito, J. Gonzalez-Benito / Industrial Marketing Management 34 (2005) 797–829804
tional market orientation variables used in the subsequent
analysis are the sum of item scores across their respective
scales.
Table 2
Reliability of subjective performance measures (compared to competitors)
Cron
alph
Profitability
Profitability over the last three years
Market performance 0.77
Company reputation and image
Alignment between company’s offer and market expectations
Success of new product launches
Operational performance 0.74
Pace of new product launching and range of products in catalogue
Time needed for designing and/or manufacturing products
Flexibility to adapt production to different volumes of demand
Product Quality (degree of conformity to specifications)
Capacity to meet customers’ requirements in time
Operational costs (supply, production, distribution, . . .)
Subjective organizational performance. Three subjective
measures of performance were considered, namely profit-
ability, market performance and operational performance.
bach
a
Mean S.D. Item-to-total
correlation
Alpha if item
deleted
3.5977 0.9307
67
3.9023 3.9023 0.6173 0.6941
3.7414 3.7414 0.6513 0.6609
3.6437 3.6437 0.5783 0.7446
63
3.6149 0.9772 0.4932 0.7075
3.2989 1.0871 0.4922 0.7095
4.0517 0.9328 0.4266 0.7255
3.8966 0.8264 0.5197 0.7032
3.8448 0.9086 0.5309 0.6978
3.2356 0.9776 0.4577 0.7176
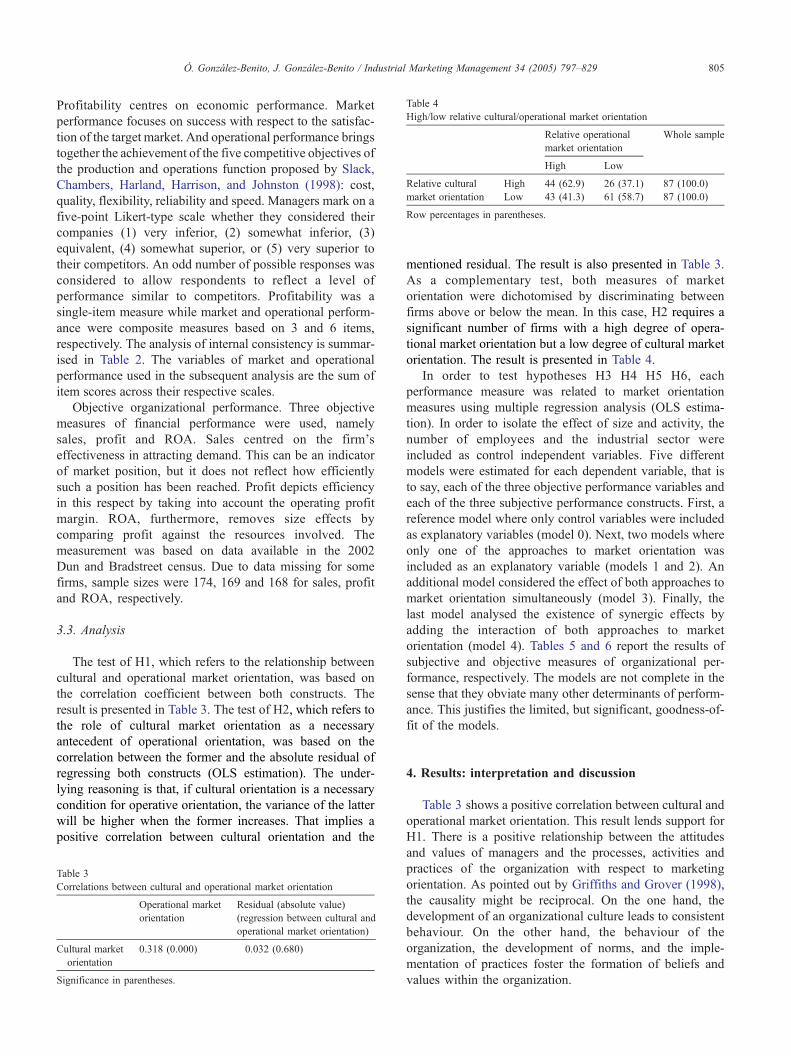
Table 4
High/low relative cultural/operational market orientation
Relative operational
market orientation
Whole sample
High Low
Relative cultural High 44 (62.9) 26 (37.1) 87 (100.0)
market orientation Low 43 (41.3) 61 (58.7) 87 (100.0)
Row percentages in parentheses.
O. Gonzalez-Benito, J. Gonzalez-Benito / Industrial Marketing Management 34 (2005) 797–829 805
Profitability centres on economic performance. Market
performance focuses on success with respect to the satisfac-
tion of the target market. And operational performance brings
together the achievement of the five competitive objectives of
the production and operations function proposed by Slack,
Chambers, Harland, Harrison, and Johnston (1998): cost,
quality, flexibility, reliability and speed. Managers mark on a
five-point Likert-type scale whether they considered their
companies (1) very inferior, (2) somewhat inferior, (3)
equivalent, (4) somewhat superior, or (5) very superior to
their competitors. An odd number of possible responses was
considered to allow respondents to reflect a level of
performance similar to competitors. Profitability was a
single-item measure while market and operational perform-
ance were composite measures based on 3 and 6 items,
respectively. The analysis of internal consistency is summar-
ised in Table 2. The variables of market and operational
performance used in the subsequent analysis are the sum of
item scores across their respective scales.
Objective organizational performance. Three objective
measures of financial performance were used, namely
sales, profit and ROA. Sales centred on the firmTseffectiveness in attracting demand. This can be an indicator
of market position, but it does not reflect how efficiently
such a position has been reached. Profit depicts efficiency
in this respect by taking into account the operating profit
margin. ROA, furthermore, removes size effects by
comparing profit against the resources involved. The
measurement was based on data available in the 2002
Dun and Bradstreet census. Due to data missing for some
firms, sample sizes were 174, 169 and 168 for sales, profit
and ROA, respectively.
3.3. Analysis
The test of H1, which refers to the relationship between
cultural and operational market orientation, was based on
the correlation coefficient between both constructs. The
result is presented in Table 3. The test of H2, which refers to
the role of cultural market orientation as a necessary
antecedent of operational orientation, was based on the
correlation between the former and the absolute residual of
regressing both constructs (OLS estimation). The under-
lying reasoning is that, if cultural orientation is a necessary
condition for operative orientation, the variance of the latter
will be higher when the former increases. That implies a
positive correlation between cultural orientation and the
Table 3
Correlations between cultural and operational market orientation
Operational market
orientation
Residual (absolute value)
(regression between cultural and
operational market orientation)
Cultural market
orientation
0.318 (0.000) �0.032 (0.680)
Significance in parentheses.
mentioned residual. The result is also presented in Table 3.
As a complementary test, both measures of market
orientation were dichotomised by discriminating between
firms above or below the mean. In this case, H2 requires a
significant number of firms with a high degree of opera-
tional market orientation but a low degree of cultural market
orientation. The result is presented in Table 4.
In order to test hypotheses H3 H4 H5 H6, each
performance measure was related to market orientation
measures using multiple regression analysis (OLS estima-
tion). In order to isolate the effect of size and activity, the
number of employees and the industrial sector were
included as control independent variables. Five different
models were estimated for each dependent variable, that is
to say, each of the three objective performance variables and
each of the three subjective performance constructs. First, a
reference model where only control variables were included
as explanatory variables (model 0). Next, two models where
only one of the approaches to market orientation was
included as an explanatory variable (models 1 and 2). An
additional model considered the effect of both approaches to
market orientation simultaneously (model 3). Finally, the
last model analysed the existence of synergic effects by
adding the interaction of both approaches to market
orientation (model 4). Tables 5 and 6 report the results of
subjective and objective measures of organizational per-
formance, respectively. The models are not complete in the
sense that they obviate many other determinants of perform-
ance. This justifies the limited, but significant, goodness-of-
fit of the models.
4. Results: interpretation and discussion
Table 3 shows a positive correlation between cultural and
operational market orientation. This result lends support for
H1. There is a positive relationship between the attitudes
and values of managers and the processes, activities and
practices of the organization with respect to marketing
orientation. As pointed out by Griffiths and Grover (1998),
the causality might be reciprocal. On the one hand, the
development of an organizational culture leads to consistent
behaviour. On the other hand, the behaviour of the
organization, the development of norms, and the imple-
mentation of practices foster the formation of beliefs and
values within the organization.
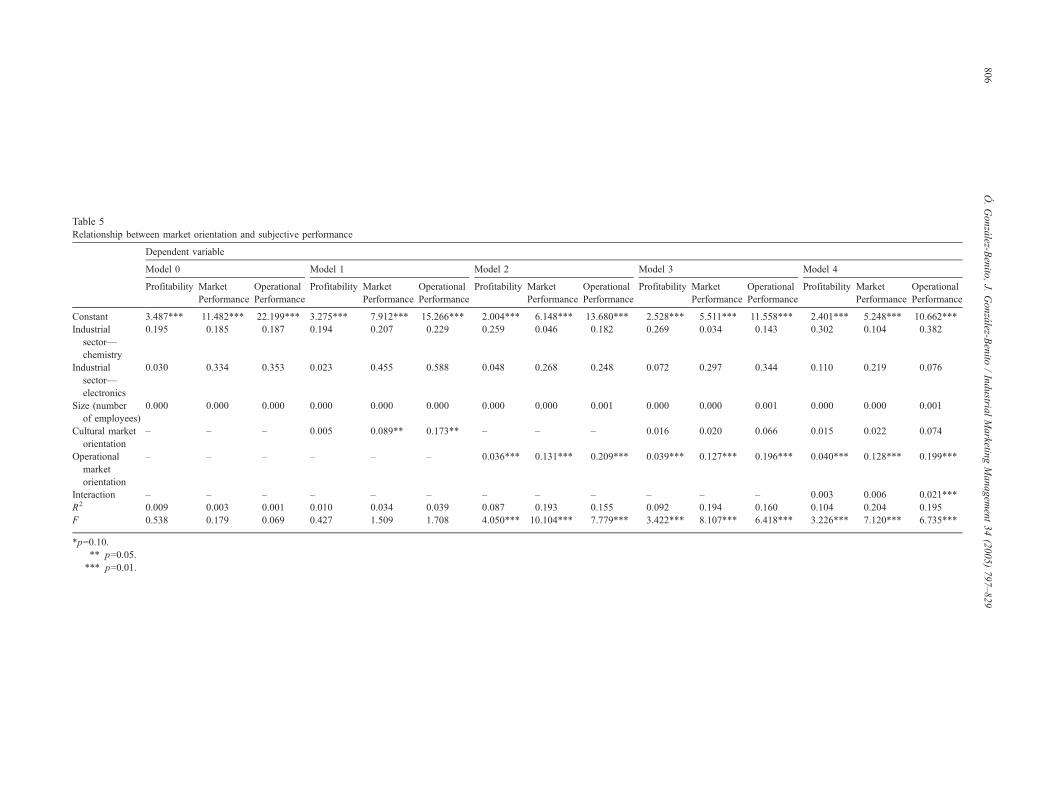
Table 5
Relationship between market orientation and subjective performance
Dependent variable
Model 0 Model 1 Model 2 Model 3 Model 4
Profitability Market
Performance
Operational
Performance
Profitability Market
Performance
Operational
Performance
Profitability Market
Performance
Operational
Performance
Profitability Market
Performance
Operational
Performance
Profitability Market
Performance
Operational
Performance
Constant 3.487TTT 11.482TTT 22.199TTT 3.275TTT 7.912TTT 15.266TTT 2.004TTT 6.148TTT 13.680TTT 2.528TTT 5.511TTT 11.558TTT 2.401TTT 5.248TTT 10.662TTTIndustrial
sector—
chemistry
0.195 �0.185 �0.187 0.194 �0.207 �0.229 0.259 0.046 0.182 0.269 0.034 �0.143 0.302 0.104 0.382
Industrial
sector—
electronics
0.030 0.334 �0.353 0.023 �0.455 �0.588 0.048 �0.268 �0.248 0.072 �0.297 �0.344 0.110 �0.219 �0.076
Size (number
of employees)
0.000 0.000 �0.000 0.000 0.000 �0.000 �0.000 �0.000 �0.001 �0.000 �0.000 �0.001 �0.000 �0.000 �0.001
Cultural market
orientation
– – – 0.005 0.089TT 0.173TT – – – �0.016 0.020 0.066 �0.015 0.022 0.074
Operational
market
orientation
– – – – – – 0.036TTT 0.131TTT 0.209TTT 0.039TTT 0.127TTT 0.196TTT 0.040TTT 0.128TTT 0.199TTT
Interaction – – – – – – – – – – – – 0.003 0.006 0.021TTTR2 0.009 0.003 0.001 0.010 0.034 0.039 0.087 0.193 0.155 0.092 0.194 0.160 0.104 0.204 0.195
F 0.538 0.179 0.069 0.427 1.509 1.708 4.050TTT 10.104TTT 7.779TTT 3.422TTT 8.107TTT 6.418TTT 3.226TTT 7.120TTT 6.735TTT
*p=0.10.
TT p=0.05.
TTT p=0.01.
O.Gonzalez-B
enito
,J.
Gonzalez-B
enito
/Industria
lMarketin
gManagem
ent34(2005)797–829
806

Table 6Relationship between market orientation and objective performance (absolute)
Dependent variable
Model 0 Model 1 Model 2 Model 3 Model 4
Profit Sales ROA Profit Sales ROA Profit Sales ROA Profit Sales ROA Profit Sales ROA
Constant �148.43 �15,722.73 0.063TTT �768.52 �72,901.12 0.076 �6014.72 �15,876.0TT 0.000 �3781.23 �141,229.3 0.041 �5026.68 �155,828.7 0.039
Industrial
sector—
chemistry
4139.66T 76,998.00TT �0.004 4131.20T 76,652.62TT �0.004 4373.66T 83,196.08TTT �0.003 4434.36T 83,515.16TTT �0.004 4696.62TT 87,394.30TTT 0.000
Industrial
sector—
electronics
�1038.96 13,818.31 �0.009 �1063.83 11,881.92 �0.008 �1021.96 15,577.79 �0.008 �908.11 16,371.07 �0.006 �610.58 20,733.4 �0.006
Size (number
of employees)
10.13TTT 177.59TTT 0.000 10.13TTT 177.78TTT 0.000 9.71TTT 167.17TTT 0.000 9.66TTT 166.78 0.000 9.686TTT 167.09TTT 0.000
Cultural market
orientation
– – – 15.54 1423.07 -0.000 – – – �70.12 �543.96 �0.001 �58.107 �411.453 �0.001
Operational
market
orientation
– – – – – – 144.575 3503.12TT 0.002T 153.50 3608.85TT 0.002T 164.123 3659.06TT 0.002T
Interaction – – – – – – – – – – – – 26.520 339.25 0.000
R2 0.324 0.419 0.007 0.324 0.420 0.007 0.332 0.439 0.024 0.332 0.439 0.028 0.338 0.444 0.028
F 26.321TTT 40.791TTT 0.389 19.624TTT 30.565TTT 0.301 20.337TTT 33.076TTT 1.001 16.215TTT 26.321TTT 0.930 13.807TTT 22.188TTT 0.781
Sample size is 169, 174 and 168 for profit, sales and ROA, respectively.
T p=0.10.
TT p=0.05.
TTT p=0.01.
O.Gonzalez-B
enito
,J.
Gonzalez-B
enito
/Industria
lMarketin
gManagem
ent34(2005)797–829
807

O. Gonzalez-Benito, J. Gonzalez-Benito / Industrial Marketing Management 34 (2005) 797–829808
Nevertheless, the relationship is moderated even though
significant. That implies the existence of firms for which
there is no correspondence between the degree of cultural and
operational implementation of market orientation. This cir-
cumstance becomes evident when Table 4 is observed. The
distinction between more and less oriented firms shows that,
even though many firms’ classifications agree in both
dimensions, there is an important proportion of firms
characterised by opposing levels. Table 4 is also consistent
with the reciprocal causality mentioned above. Although the
behaviour could initially be thought of as the consequence of
the organizational culture, the existence of a relevant number
of market-oriented firms in the operational sense but not in
the cultural sense sustains the inverse reasoning. The non-
significant correlation found between cultural orientation and
the residual of regressing it with operational orientation,
reported in Table 3, provides additional support for such a
conclusion. The variance in operational market orientation
seems to be independent of the degree of cultural market
orientation. None of these arguments supports the rejection of
H2. Cultural market orientation is not necessarily an
antecedent of operational market orientation. On the
contrary, and in relative terms, there are firms with
market-oriented practices whose managers do not prioritise
the values of market orientation. These firms seem to adopt
market orientation more as an doperational recipeT than as a
management philosophy.
Two clarifications must be taken into account at this point.
First, any mention of the degree of market orientation is
made in relative terms. As shown in Table 1, the degree of
reported cultural and operational market orientation is quite
high. Therefore, when some firms are referred to as bmarket-
orientedQ, that means that they are more market oriented than
other competing firms in the population studied. Second,
data collection focused on the production and operations
functional area. Therefore, the measures of cultural and
operational market orientation do not necessarily reflect the
situation at the corporate level. The absence of cultural
support for market orientation practices might merely be
confined to the production field owing to cultural and
perceptual divergences within managing teams.
Given the existence of two related, but not coincident,
approaches to market orientation, the next key question
refers to their effect on organizational performance. Tables
5 and 6 show that the relationship between market
orientation and organizational performance differs accord-
ing to the type of market orientation and the measure of
performance. On the one hand, model 2 lends support for
H3 in relation to profitability, market performance, opera-
tional performance, sales and ROA. The pragmatic approach
to market orientation seems to make a significant contribu-
tion to the improvement of attractiveness and commercial
success, and to the achievement of objectives linked to the
production and operations function. This not only results in
higher sales but also more efficiency in terms of profitability
over the last few years and, although more moderately, in
terms of ROA. Therefore, the implementation of activities
and processes to create superior value for customers seems
to play a fundamental role in the improvement of perform-
ance. Nevertheless, it is important to point out that the
relationship is not significant for profitability when it is
measured with secondary objective sources. On the other
hand, model 1 lends support for H3 in relation to market and
operational performance. This result implies that cultural
market orientation enhances performance dimensions such
as reputation, image, new product success, cost control,
flexibility, time to market, quality, etc., but these outputs do
not seem to lead to better financial performance.
The results presented in Tables 5 and 6 also imply that
the effect of operational market orientation is higher than the
effect of cultural market orientation. First, operational
orientation is related to a higher number of performance
measures than cultural orientation. Second, significance
levels are always higher for the effects of operational
orientation. And third, when the effects of both approaches
to market orientation are simultaneously considered in
model 3, the role of cultural orientation is absorbed by the
role of operational orientation. This leads us to think that the
effect of cultural market orientation is given by its relation-
ship with operational market orientation. All these argu-
ments provide support for H4. Therefore, it is the actions
and procedures, not the beliefs and attitudes, which enforce
organizational performance.
Apart from the dominant role of the operational market
orientation in the improvement of organizational perform-
ance, only one of the interaction effects considered in model 4
was found to be significant. Cultural orientation constitutes a
moderating, reinforcing variable only when operational
performance is considered. Thus H5 receives no support
except for this case. Cultural orientation is key in the
achievement of objectives directly linked to the production
function, that is, the optimisation of processes, activities and
outcomes of the production function, but it does not seem to
be relevant to the accomplishment of better market position
and profitability. In short, the results lead us to think that the
adoption of doperational recipesT of market orientation
might lead to positive effects of performance regardless of
the cultural conversion of production and operations
managers. Although it has been posed that the relationship
between market-oriented behaviour and performance is
necessarily based on a strong culture (Slater & Narver,
1998), the results imply that such a culture does not
necessarily prioritise the marketing concept, at least in a
relative sense and as far as the production and operations
function is concerned.
The last question concerns the distinction between
objective and subjective approaches to the measurement of
organizational performance. The comparison of Tables 5
and 6 shows that the relationship is stronger for subjective
measures than for objective measures. This lends support for
H6. Subjective measures are more flexible than objective
measures in capturing complex dimensions of performance,
O. Gonzalez-Benito, J. Gonzalez-Benito / Industrial Marketing Management 34 (2005) 797–829 809
considering lagged effects, and facilitating comparison
between firms. In this respect, subjective performance
seems to be a more reliable measure of performance and
the relationship between market orientation and perform-
ance gains credibility. However, subjective measures
obtained from a single respondent might involve biases as
a consequence of the response style or the interest in
communicating a favourable and coherent corporate image.
In this respect, the relationship between market orientation
and performance might appear falsely reinforced in the data.
The assessment of favourable and contrary arguments is out
of the scope of this paper. Moreover, the literature review
summarised in Appendix 1 does not shed light on this
question. Less than 10% of papers revised used different
respondents for market orientation and performance meas-
urement. Many of these multiple-respondent studies still
reported a positive relationship between market orientation
and subjective performance (e.g. Deshpande & Farley,
1999; Deshpande et al., 1993; Langerak, 2001a,b; Pelham,
1997a,b, 2000; Salomo et al., 2003; Siguaw et al., 1998;
Slater & Narver, 2000). This supports the fact that the
relationship is not a consequence of the dhalo effectT.However, some other multiple-respondent studies did not
find a relationship (e.g. Farrelly & Quester, 2003; Jones et
al., 2003). This raises some doubts in this respect.
5. Conclusions
Previous studies on the relationship between market
orientation and organizational performance show some
incoherence in the conclusions reported. Although most of
them justify and find some kind of positive relationship,
others do not find any relationship. There is also some
discrepancy about the circumstances of the competitive
environment in which the relationship takes place or is
stronger. The diversity of conceptual and methodological
approaches to the definition and measurement of market
orientation, organizational performance, and the relation-
ship between both of them enriches the field of research
but also contributes additional confusion. The comparison
between studies becomes harder. Apparently contradictory
results can turn out to be complementary when their
theoretical and methodological frameworks are borne in
mind.
This study has dealt with the relationship between market
orientation and operational performance while taking into
account three key conceptual and methodological aspects of
the empirical development. First, the distinction between the
cultural/attitudinal and operational/behavioural approaches
to market orientation. Second, the distinction between the
objective and subjective approaches to the measurement of
organizational performance. And third, the perspective from
functional areas further removed from the customer than the
sales and marketing function, specifically the production
and operations function.
The results based on a sample of Spanish industrial firms
show a moderate, significant relationship between the
cultural and operational measures of the market orientation
of the production and operations function. Furthermore, the
cultural orientation does not seem to be a necessary
antecedent of the operational orientation. The results are
consistent with the existence of a reciprocal causality
between them. In addition, the results provide evidence of a
positive relationship between operational market orientation
and performance. Moreover, although the cultural market
orientation could be thought of as a quality warranty of the
operational implementation, it does not enhance the relation-
ship with commercial effectiveness and profitability. It only
constitutes a moderating variable of the relationship between
operational market orientation and the effectiveness and
efficiency of the production function. Finally, the results
show that the relationship between market orientation and
organizational performance becomes stronger when the latter
is subjectively measured.
Two managerial implications can be drawn from these
results. First, the adoption of doperational recipesT of market
orientation seems to improve performance independently of
the cultural conversion of the organization to the marketing
concept philosophy, at least in the operations and production
functional area. More attention should be paid to promoting
behaviour than to promoting culture. Besides, behaviour
might be the basis for the formation of beliefs and values, and
consequently, the organizational culture. Second, the benefits
derived from market orientation are not completely captured
by objective financial measures, at least in the short-term.
Market orientation contributes to the long-term viability of
the firm by improving market and operational performance.
The output of market orientation is better reflected by
reputation, image, customer satisfaction, new product suc-
cess, cost-efficiency, time-to-market, product quality, etc.
This study has tried to gain an insight into some relevant
questions about the conceptualisation and measurement of
the relationship between market orientation and perform-
ance, but uncovers some other questions in this respect.
First, cultural and operational approaches to market ori-
entation constitute the opposite ends of a continuum. A
more complete approach should consider a more detailed
partition of this continuum (Homburg & Pflesser, 2000).
Second, the results do not explain whether the relationship
between market orientation and performance and the
predominant role of operational implementation is only
attributable to the production function or independent of it.
The former case implies cultural heterogeneity within the
organization. Third, the study does not explain whether the
stronger relationship between market orientation and sub-
jective performance is due to the superiority of this
measurement approach or to the measurement bias that this
approach could entail. Finally, the empirical study has been
circumscribed to three Spanish industrial sectors. Additional
evidence from different settings and business activities is
required.
O. Gonzalez-Benito, J. Gonzalez-Benito / Industrial Marketing Management 34 (2005) 797–829810
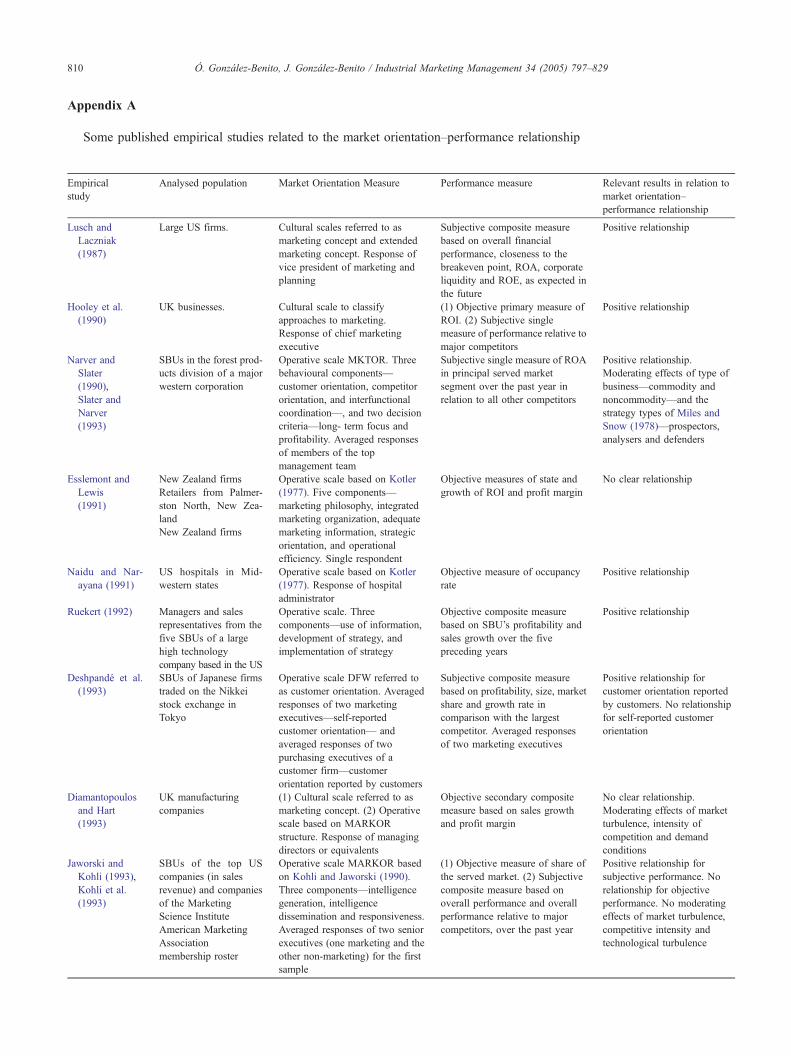
Appendix A
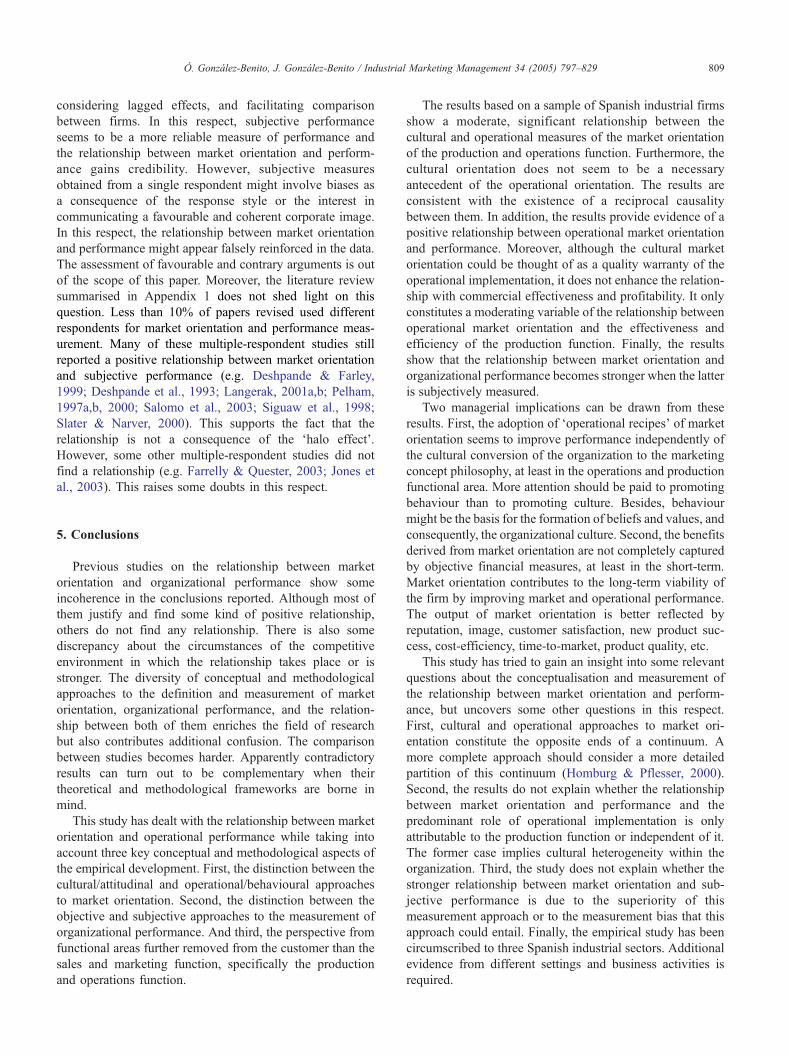
Some published empirical studies related to the market orientation–performance relationship
Empirical
study
Analysed population Market Orientation Measure Performance measure Relevant results in relation to
market orientation–
performance relationship
Lusch and
Laczniak
(1987)
Large US firms. Cultural scales referred to as
marketing concept and extended
marketing concept. Response of
vice president of marketing and
planning
Subjective composite measure
based on overall financial
performance, closeness to the
breakeven point, ROA, corporate
liquidity and ROE, as expected in
the future
Positive relationship
Hooley et al.
(1990)
UK businesses. Cultural scale to classify
approaches to marketing.
Response of chief marketing
executive
(1) Objective primary measure of
ROI. (2) Subjective single
measure of performance relative to
major competitors
Positive relationship
Narver and
Slater
(1990),
Slater and
Narver
(1993)
SBUs in the forest prod-
ucts division of a major
western corporation
Operative scale MKTOR. Three
behavioural components—
customer orientation, competitor
orientation, and interfunctional
coordination—, and two decision
criteria—long- term focus and
profitability. Averaged responses
of members of the top
management team
Subjective single measure of ROA
in principal served market
segment over the past year in
relation to all other competitors
Positive relationship.
Moderating effects of type of
business—commodity and
noncommodity—and the
strategy types of Miles and
Snow (1978)—prospectors,
analysers and defenders
Esslemont and
Lewis
(1991)
New Zealand firms Operative scale based on Kotler
(1977). Five components—
marketing philosophy, integrated
marketing organization, adequate
marketing information, strategic
orientation, and operational
efficiency. Single respondent
Objective measures of state and
growth of ROI and profit margin
No clear relationship
Retailers from Palmer-
ston North, New Zea-
land
New Zealand firms
Naidu and Nar-
ayana (1991)
US hospitals in Mid-
western states
Operative scale based on Kotler
(1977). Response of hospital
administrator
Objective measure of occupancy
rate
Positive relationship
Ruekert (1992) Managers and sales
representatives from the
five SBUs of a large
high technology
company based in the US
Operative scale. Three
components—use of information,
development of strategy, and
implementation of strategy
Objective composite measure
based on SBU’s profitability and
sales growth over the five
preceding years
Positive relationship
Deshpande et al.
(1993)
SBUs of Japanese firms
traded on the Nikkei
stock exchange in
Tokyo
Operative scale DFW referred to
as customer orientation. Averaged
responses of two marketing
executives—self-reported
customer orientation— and
averaged responses of two
purchasing executives of a
customer firm—customer
orientation reported by customers
Subjective composite measure
based on profitability, size, market
share and growth rate in
comparison with the largest
competitor. Averaged responses
of two marketing executives
Positive relationship for
customer orientation reported
by customers. No relationship
for self-reported customer
orientation
Diamantopoulos
and Hart
(1993)
UK manufacturing
companies
(1) Cultural scale referred to as
marketing concept. (2) Operative
scale based on MARKOR
structure. Response of managing
directors or equivalents
Objective secondary composite
measure based on sales growth
and profit margin
No clear relationship.
Moderating effects of market
turbulence, intensity of
competition and demand
conditions
Jaworski and
Kohli (1993),
Kohli et al.
(1993)
SBUs of the top US
companies (in sales
revenue) and companies
of the Marketing
Science Institute
Operative scale MARKOR based
on Kohli and Jaworski (1990).
Three components—intelligence
generation, intelligence
dissemination and responsiveness.
Averaged responses of two senior
executives (one marketing and the
other non-marketing) for the first
sample
(1) Objective measure of share of
the served market. (2) Subjective
composite measure based on
overall performance and overall
performance relative to major
competitors, over the past year
Positive relationship for
subjective performance. No
relationship for objective
performance. No moderating
effects of market turbulence,
competitive intensity and
technological turbulence
American Marketing
Association
membership roster

Empirical
study
Analysed population Market Orientation Measure Performance measure Relevant results in relation to
market orientation–
performance relationship
McDermott,
Franzak, and
Little, (1993)
Large US general
hospitals
Operative scale based on
MKTOR, MARKOR and prior
health care research. Four
components—market intelligence,
interfunctional coordination and
responsiveness (strategic and
tactical). Response of chief
marketing officer
Objective primary measure of
operating margin
Positive relationship. Stronger
for market intelligence and
interfunctional coordination
than for strategy and tactical
responsiveness
Deng and Dart
(1994)
Canadian companies Operative scale. Four
components—customer,
competitor, interfunctional
coordination, and profit
orientations. Response of general
manager or marketing manager
Subjective composite measure
based on overall performance,
liquidity, sales, market share,
penetration, export, development
of new products and new markets,
quality, productivity, and
expectations over the previous
three years
Positive relationship
Slater and
Narver
(1994)
SBUs in a forest product
company and a
diversified
manufacturing company
Operative scale MKTOR.
Averaged responses of members
of the top management team
Subjective single measures of
ROA, sales growth, and new
product success relative to all other
competitors in the principal served
market over the past year
Positive relationship. No
moderating effects of market
turbulence, technological
turbulence, competitive
hostility and market growth
Atuahene-Gima
(1995, 1996)
Australian service and
manufacturing single
firms and SBUs of large
multisite firms
Operative scale based on Ruekert
(1992). Response of the marketing
manager
Subjective composite measures
of new product market
performance—based on market
share, sales, growth and profit
objectives-and new product
project performance—based on
cost efficiencies, proprietary
advantage, sales and profitability
of other products, and new market
opportunities—in relation to one
new product introduced in the last
5 years
Positive relationship.
Moderating effect of
environment hostility, stage of
the product life cycle, and
service vs. product
innovations. No moderating
effect of degree of product
newness
Au and Tse
(1995)
Hotels and motor lodges
in Hong Kong
Operative scale based on Kotler
(1977). Response of general
manager. Complemented with
objective number of employees
responsible for public relations
and expenditure on public
relations
Objective primary (New Zealand)
and secondary (Hong Kong)
measure of occupancy rate
No relationship. No
moderating effect of country—
related to size and complexityHotels and motor lodges
in New Zealand
Greenley
(1995a,b)
UK companies with
more than 500
employees
Operative scale based on
MKTOR. Single responses
of managing director/CEOs
Subjective measures of ROI, new
product success and sales growth
over the last 3 years, relative to
those of major competitors
No overall relationship.
Moderating effects of market
turbulence and technological
change. No moderating effect
of market growth
Golden, Doney,
Johnson, and
Smith, (1995)
Russian firms Operative scale. Response of
primary manager or owner
Subjective composite measure
based on sales, market share,
market share growth and
profitability in relation to
competitors
Positive relationship through
product attributes. No
relationship through promotion
activities and price
Lonial and Raju
(2001), Raju
and Lonial
(2001), Raju
et al. (1995),
Raju, Lonial,
Gupta, and
Ziegler (2000)
US Hospitals in
Midwestern states
Operative scale based on
MARKOR. Four resulting
components—intelligence
generation, customer satisfaction,
responsiveness to customers, and
responsiveness to competitors.
Averaged responses of top
executives
Subjective composite measures of
financial performance—based on
profit, margin, ROI and cash
flow—, market/product
development—based on new
product and market development
and R and D—and internal
quality—based on service quality,
employee turnover, mortality and
cost per adjusted discharge
Positive relationship. Financial
performance related to
responsiveness to competition
and customers. Market/product
performance and internal
quality related to intelligence
generation, responsiveness to
competition and customer
satisfaction. Moderating effect
of size and environmental
uncertainty
Appendix A (continued)
(continued on next page)
O. Gonzalez-Benito, J. Gonzalez-Benito / Industrial Marketing Management 34 (2005) 797–829 811

Empirical
study
Analysed population Market Orientation Measure Performance measure Relevant results in relation to
market orientation–
performance relationship
Balakrishnan
(1996)
US manufacturers of
machine tools
Operative scale referred as
customer and competitive
orientation. Four resulting
components—basic market
orientation, competitive
benchmarking, customisation and
international orientation.
Response of chief executive
Subjective composite measures of
satisfaction with profit and profit
relative to competition—both
based on profit and ROA—and
subjective single measures of
customer retention and repeat
business generated from
customers
Positive relationship for basic
market orientation.
Competitive benchmarking
related to profit relative to
competitors. Customisation
related to repeat business.
International orientation related
to satisfaction with profit and
profit relative to competitors
Fritz (1996) Industrial firms in West
Germany
Cultural scale. Response of
corporate executive
Subjective composite measure
based on competitiveness,
customer satisfaction, continuance
of the firm, and long-term
profitability in relation to
objectives within the last 3 years
Positive relationship.
Moderating effects of position
of the top marketing executive,
influence of the marketing
sector, and co-operation of
marketing, production and R
and D
Llonch and
Walino (1996)
Industrial firms based in
Catalonia (Spain)
Operative scale based on
MKTOR. Response of chief
executive
Subjective single measures of
ROI, ROS, sales growth and
overall performance in relation to
competitors over the last 3 years
Positive relationship mainly
based on competitor
orientation. Moderating effects
of size, industrial sector and
foreign property
Pelham and
Wilson (1996)
Michigan firms (US) Operative scale based on
MKTOR. Response of firm
president
Subjective composite measures
of new product success—based
on product/service and market
development—, growth/share—
based on sales and employment
growth and market share—,
and profitability—based on
profits, margin, cash flow,
ROI and ROA—, and subjective
single measure of relative
product quality, in relation to
objectives
Positive relationship except for
growth/share performance
Pitt, Caruana, and
Berthon,
(1996)
Largest UK based
service firms
Operative scale MARKOR.
Response of marketing
director
Subjective composite measure
based on ROCE, sales growth and
overall performance relative to
other companies in the industry
over the last 5 years
Positive relationship. No
moderating effect of country—
related to cultural context and
economic performance
Malta firms
Selnes et al.
(1996)
SBUs of the top US
companies (in sales
revenues) and
companies of the
Marketing Science
Institute
Operative scale MARKOR. Aver-
aged responses of two senior
executives (one marketing and
the other non-marketing)
(1) Objective measure of share of
the served market. (2) Subjective
composite measure based on
overall performance and overall
performance relative to major
competitors, over the past year
Positive relationship for
subjective performance. No
relationship for objective
performance. No moderating
effect of country —related to
national culture and political
economyLargest firms (in sales
revenues) in Norway,
Denmark and Sweden
Slater and Narver
(1996)
US manufacturers in a
Midwestern state
Operative scale MKTOR.
Response of president or general
manager
Subjective single measures of
ROA and sales growth rate
relative to all other competitors in
the principal served market over
the past year
Positive relationship for
sales growth rate. No
relationship for ROA
Appiah-Adu
(1997)
Small UK firms Operative scale based on
MKTOR. Response of managing
director
Subjective single measures of
sales growth, new product success
rate and return on investment over
the previous 3 year period in
relation to all other competitors
Positive relationship.
Moderating effects of
market turbulence,
competitive intensity
and market growth. No
moderating effect of
technological turbulence
Appendix A (continued)
O. Gonzalez-Benito, J. Gonzalez-Benito / Industrial Marketing Management 34 (2005) 797–829812
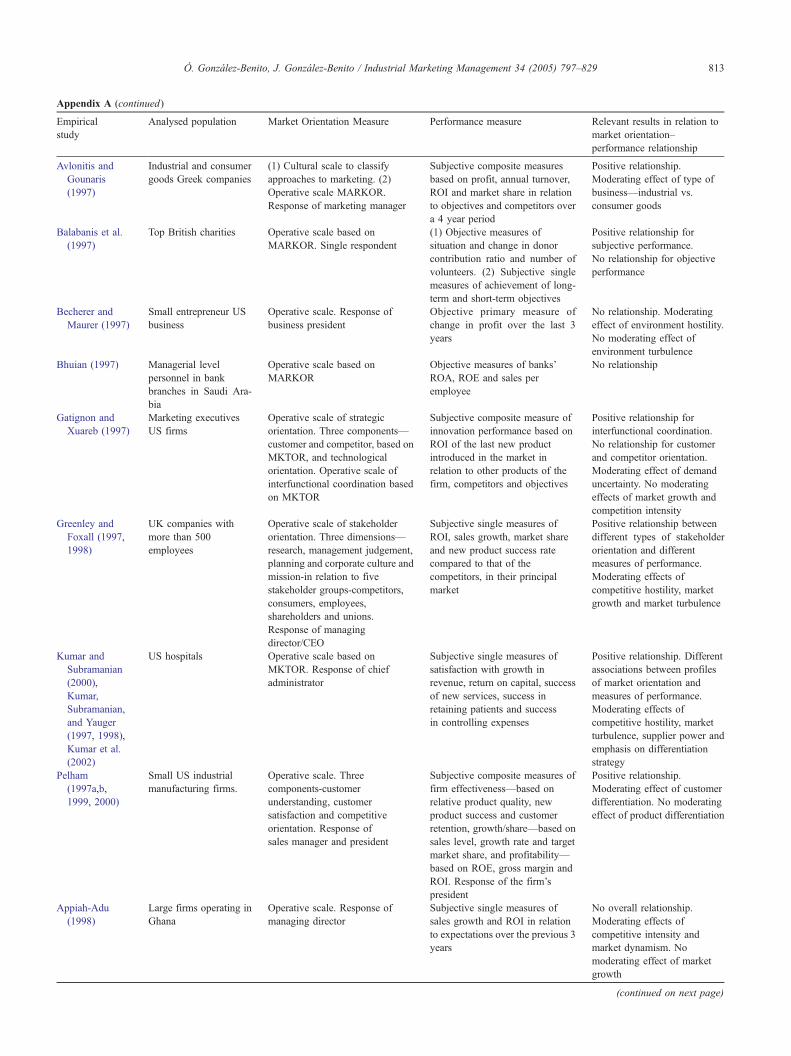
Empirical
study
Analysed population Market Orientation Measure Performance measure Relevant results in relation to
market orientation–
performance relationship
Avlonitis and
Gounaris
(1997)
Industrial and consumer
goods Greek companies
(1) Cultural scale to classify
approaches to marketing. (2)
Operative scale MARKOR.
Response of marketing manager
Subjective composite measures
based on profit, annual turnover,
ROI and market share in relation
to objectives and competitors over
a 4 year period
Positive relationship.
Moderating effect of type of
business—industrial vs.
consumer goods
Balabanis et al.
(1997)
Top British charities Operative scale based on
MARKOR. Single respondent
(1) Objective measures of
situation and change in donor
contribution ratio and number of
volunteers. (2) Subjective single
measures of achievement of long-
term and short-term objectives
Positive relationship for
subjective performance.
No relationship for objective
performance
Becherer and
Maurer (1997)
Small entrepreneur US
business
Operative scale. Response of
business president
Objective primary measure of
change in profit over the last 3
years
No relationship. Moderating
effect of environment hostility.
No moderating effect of
environment turbulence
Bhuian (1997) Managerial level
personnel in bank
branches in Saudi Ara-
bia
Operative scale based on
MARKOR
Objective measures of banks’
ROA, ROE and sales per
employee
No relationship
Gatignon and
Xuareb (1997)
Marketing executives
US firms
Operative scale of strategic
orientation. Three components—
customer and competitor, based on
MKTOR, and technological
orientation. Operative scale of
interfunctional coordination based
on MKTOR
Subjective composite measure of
innovation performance based on
ROI of the last new product
introduced in the market in
relation to other products of the
firm, competitors and objectives
Positive relationship for
interfunctional coordination.
No relationship for customer
and competitor orientation.
Moderating effect of demand
uncertainty. No moderating
effects of market growth and
competition intensity
Greenley and
Foxall (1997,
1998)
UK companies with
more than 500
employees
Operative scale of stakeholder
orientation. Three dimensions—
research, management judgement,
planning and corporate culture and
mission-in relation to five
stakeholder groups-competitors,
consumers, employees,
shareholders and unions.
Response of managing
director/CEO
Subjective single measures of
ROI, sales growth, market share
and new product success rate
compared to that of the
competitors, in their principal
market
Positive relationship between
different types of stakeholder
orientation and different
measures of performance.
Moderating effects of
competitive hostility, market
growth and market turbulence
Kumar and
Subramanian
(2000),
Kumar,
Subramanian,
and Yauger
(1997, 1998),
Kumar et al.
(2002)
US hospitals Operative scale based on
MKTOR. Response of chief
administrator
Subjective single measures of
satisfaction with growth in
revenue, return on capital, success
of new services, success in
retaining patients and success
in controlling expenses
Positive relationship. Different
associations between profiles
of market orientation and
measures of performance.
Moderating effects of
competitive hostility, market
turbulence, supplier power and
emphasis on differentiation
strategy
Pelham
(1997a,b,
1999, 2000)
Small US industrial
manufacturing firms.
Operative scale. Three
components-customer
understanding, customer
satisfaction and competitive
orientation. Response of
sales manager and president
Subjective composite measures of
firm effectiveness—based on
relative product quality, new
product success and customer
retention, growth/share—based on
sales level, growth rate and target
market share, and profitability—
based on ROE, gross margin and
ROI. Response of the firm’s
president
Positive relationship.
Moderating effect of customer
differentiation. No moderating
effect of product differentiation
Appiah-Adu
(1998)
Large firms operating in
Ghana
Operative scale. Response of
managing director
Subjective single measures of
sales growth and ROI in relation
to expectations over the previous 3
years
No overall relationship.
Moderating effects of
competitive intensity and
market dynamism. No
moderating effect of market
growth
Appendix A (continued)
(continued on next page)
O. Gonzalez-Benito, J. Gonzalez-Benito / Industrial Marketing Management 34 (2005) 797–829 813

Empirical
study
Analysed population Market Orientation Measure Performance measure Relevant results in relation to
market orientation–
performance relationship
Appiah-Adu and
Ranchhod
(1998)
UK firms in the
biotechnology industry
Operative scale based on
MKTOR. Response of managing
director
Subjective single measures of new
products/services success, market
share growth, profit margin, and
overall performance relative to the
main competition in the past 3
years
Positive relationship except for
new products/services success
Appiah-Adu and
Singh (1998)
Small and medium UK
enterprises
Operative scale based on DFW.
Response of marketing executive
Subjective single measures of new
product success rate, sales growth
and ROI relative to the main
competition over the previous
3 year period
Positive relationship
Bhuian (1998) Manufacturing
companies in Saudi
Arabia
Operative scale based on
MARKOR and performance
anticipation. Response of CEO
Subjective composite measure
based on quality of products,
revenues, financial position,
customer satisfaction and overall
performance over the last 3 years
Positive relationship. Moderat-
ing effects of competitive
intensity and technological tur-
bulence
Caruana et al.
(1998a,b,
1999)
Public sector
organizations in
Australia
Departments in
Operative scale based on
MARKOR. Response of head of
public sector organization or
university department
Subjective single measures of
overall performance and ability to
attract non-government funding
during the last 5 years
Positive relationship based on
responsiveness
Australian and New
Zealand universities
Subjective composite measure
based on improvements achieved,
service to customers, cost
effectiveness and overall
performance in the last 3 years
Chang and Chen
(1998)
Retail stock brokerage
firms in Taiwan
Operative scale extending
MKTOR with performance
anticipation. Response of the head
of retail brokerage operations
Subjective single measure of ROA
in relation to major direct
competitors over the past year, and
subjective composite measure of
service quality based on
SERVQUAL
Positive relationship. Service
quality as intermediate variable
in the market orientation– busi-
ness performance relationship
Deshpande and
Farley (1998a)
Marketing executives
from US and European
major firms, members
of the Marketing
Science Institute
Operative scales MARKOR,
MKTOR, DFW and the resulting
summary scale
Subjective composite measures of
performance, one based on cus
tomer retention, sales growth, ROI
and ROS, the other based on profit
ability, size, market share and
growth
Positive relationship. No mod-
erating effect of country—US
vs. Western European indus-
trial countries
Doyle and Wong
(1998)
SBUs of large UK firms Operative scale based on
MARKOR structure. Averaged
responses of marketing/sales,
accountant/financial, and
manufacturing/operations
managers
Subjective composite measure
based on ROC, market share, sales
growth and overall performance in
relation to excellent competitors
Positive relationship
Gray et al.
(1998, 1999)
Senior managers in New
Zealand companies
(1) Cultural scale of business
philosophy. (2) Operative scale
based on MARKOR, MKTOR
and Deng and Dart (1994). Five
resulting components—
customer and competitor
orientation, interfunctional
coordination, responsiveness and
profit emphasis
(1) Objective measures of ROI,
relative ROI and pretax profit. (2)
Subjective single measures of
brand awareness, customer
satisfaction and loyalty, market
share, sales growth and
profitability relative to nearest
competitor
Positive relationship except for
relative ROI. Stronger relation-
ship for subjective than for
objective performance. Moder-
ating effects of competitive
intensity, market growth, entry
barriers and buyer power. No
moderating effects of market
and technological turbulence
Han et al. (1998) US banks in a Midwest-
ern state
Operative scale MKTOR.
Response of the person in charge
of the marketing function at the
senior management level
(1) Objective primary measures of
net income growth and ROA. (2)
Subjective single measures of
growth and profitability
No direct relationship. Positive
relationship when innovations
are accounted for (mediating
role of innovativeness) based
on customer orientation
Horng and Chen
(1998)
Small and medium firms
of Taiwan
Operative scale based on
MARKOR structure. Response of
CEO or top manager
Subjective single measure of
performance for the last year
Positive relationship based on
intelligence generation
Appendix A (continued)
O. Gonzalez-Benito, J. Gonzalez-Benito / Industrial Marketing Management 34 (2005) 797–829814
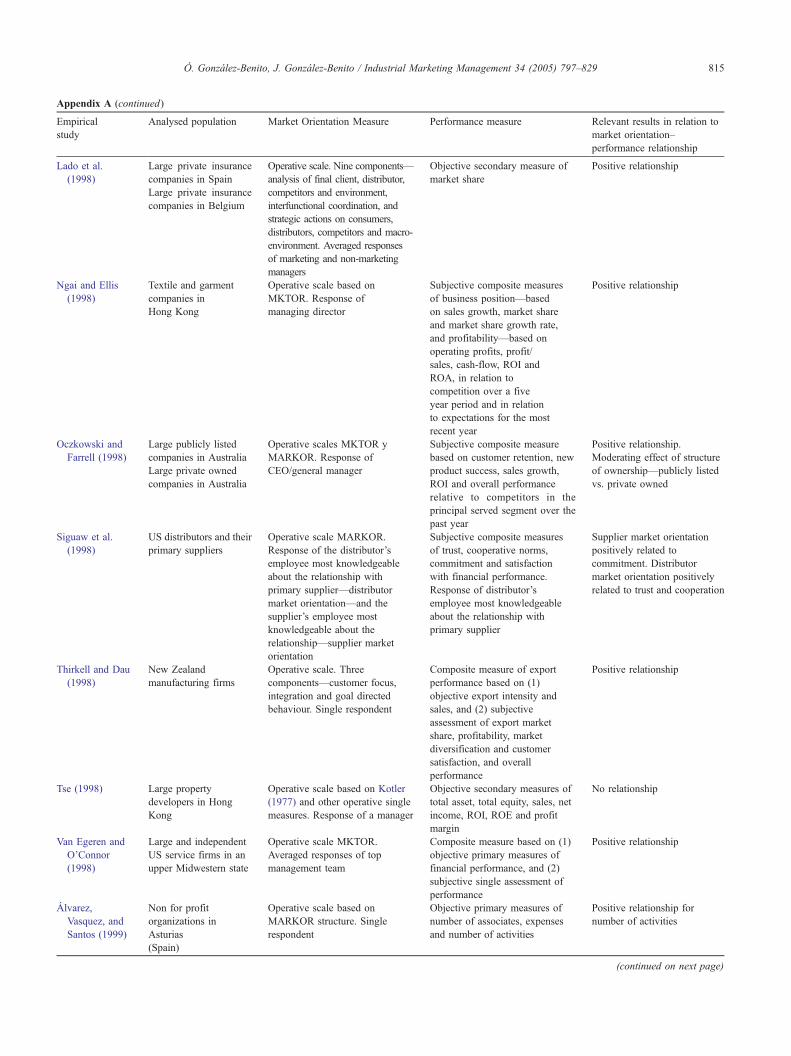
Empirical
study
Analysed population Market Orientation Measure Performance measure Relevant results in relation to
market orientation–
performance relationship
Lado et al.
(1998)
Large private insurance
companies in Spain
Operative scale. Nine components—
analysis of final client, distributor,
competitors and environment,
interfunctional coordination, and
strategic actions on consumers,
distributors, competitors and macro-
environment. Averaged responses
of marketing and non-marketing
managers
Objective secondary measure of
market share
Positive relationship
Large private insurance
companies in Belgium
Ngai and Ellis
(1998)
Textile and garment
companies in
Hong Kong
Operative scale based on
MKTOR. Response of
managing director
Subjective composite measures
of business position—based
on sales growth, market share
and market share growth rate,
and profitability—based on
operating profits, profit/
sales, cash-flow, ROI and
ROA, in relation to
competition over a five
year period and in relation
to expectations for the most
recent year
Positive relationship
Oczkowski and
Farrell (1998)
Large publicly listed
companies in Australia
Operative scales MKTOR y
MARKOR. Response of
CEO/general manager
Subjective composite measure
based on customer retention, new
product success, sales growth,
ROI and overall performance
relative to competitors in the
principal served segment over the
past year
Positive relationship.
Moderating effect of structure
of ownership—publicly listed
vs. private owned
Large private owned
companies in Australia
Siguaw et al.
(1998)
US distributors and their
primary suppliers
Operative scale MARKOR.
Response of the distributor’s
employee most knowledgeable
about the relationship with
primary supplier—distributor
market orientation—and the
supplier’s employee most
knowledgeable about the
relationship—supplier market
orientation
Subjective composite measures
of trust, cooperative norms,
commitment and satisfaction
with financial performance.
Response of distributor’s
employee most knowledgeable
about the relationship with
primary supplier
Supplier market orientation
positively related to
commitment. Distributor
market orientation positively
related to trust and cooperation
Thirkell and Dau
(1998)
New Zealand
manufacturing firms
Operative scale. Three
components—customer focus,
integration and goal directed
behaviour. Single respondent
Composite measure of export
performance based on (1)
objective export intensity and
sales, and (2) subjective
assessment of export market
share, profitability, market
diversification and customer
satisfaction, and overall
performance
Positive relationship
Tse (1998) Large property
developers in Hong
Kong
Operative scale based on Kotler
(1977) and other operative single
measures. Response of a manager
Objective secondary measures of
total asset, total equity, sales, net
income, ROI, ROE and profit
margin
No relationship
Van Egeren and
O’Connor
(1998)
Large and independent
US service firms in an
upper Midwestern state
Operative scale MKTOR.
Averaged responses of top
management team
Composite measure based on (1)
objective primary measures of
financial performance, and (2)
subjective single assessment of
performance
Positive relationship
Alvarez,
Vasquez, and
Santos (1999)
Non for profit
organizations in
Asturias
(Spain)
Operative scale based on
MARKOR structure. Single
respondent
Objective primary measures of
number of associates, expenses
and number of activities
Positive relationship for
number of activities
Appendix A (continued)
(continued on next page)
O. Gonzalez-Benito, J. Gonzalez-Benito / Industrial Marketing Management 34 (2005) 797–829 815
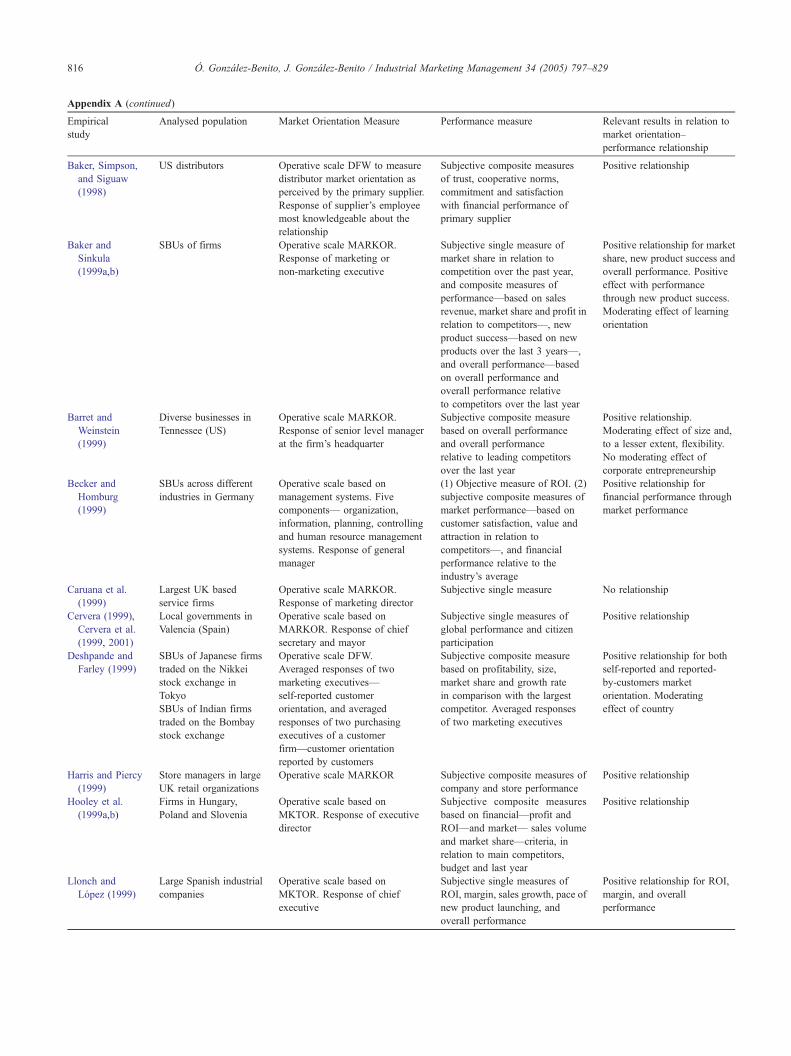
Empirical
study
Analysed population Market Orientation Measure Performance measure Relevant results in relation to
market orientation–
performance relationship
Baker, Simpson,
and Siguaw
(1998)
US distributors Operative scale DFW to measure
distributor market orientation as
perceived by the primary supplier.
Response of supplier’s employee
most knowledgeable about the
relationship
Subjective composite measures
of trust, cooperative norms,
commitment and satisfaction
with financial performance of
primary supplier
Positive relationship
Baker and
Sinkula
(1999a,b)
SBUs of firms Operative scale MARKOR.
Response of marketing or
non-marketing executive
Subjective single measure of
market share in relation to
competition over the past year,
and composite measures of
performance—based on sales
revenue, market share and profit in
relation to competitors—, new
product success—based on new
products over the last 3 years—,
and overall performance—based
on overall performance and
overall performance relative
to competitors over the last year
Positive relationship for market
share, new product success and
overall performance. Positive
effect with performance
through new product success.
Moderating effect of learning
orientation
Barret and
Weinstein
(1999)
Diverse businesses in
Tennessee (US)
Operative scale MARKOR.
Response of senior level manager
at the firm’s headquarter
Subjective composite measure
based on overall performance
and overall performance
relative to leading competitors
over the last year
Positive relationship.
Moderating effect of size and,
to a lesser extent, flexibility.
No moderating effect of
corporate entrepreneurship
Becker and
Homburg
(1999)
SBUs across different
industries in Germany
Operative scale based on
management systems. Five
components— organization,
information, planning, controlling
and human resource management
systems. Response of general
manager
(1) Objective measure of ROI. (2)
subjective composite measures of
market performance—based on
customer satisfaction, value and
attraction in relation to
competitors—, and financial
performance relative to the
industry’s average
Positive relationship for
financial performance through
market performance
Caruana et al.
(1999)
Largest UK based
service firms
Operative scale MARKOR.
Response of marketing director
Subjective single measure No relationship
Cervera (1999),
Cervera et al.
(1999, 2001)
Local governments in
Valencia (Spain)
Operative scale based on
MARKOR. Response of chief
secretary and mayor
Subjective single measures of
global performance and citizen
participation
Positive relationship
Deshpande and
Farley (1999)
SBUs of Japanese firms
traded on the Nikkei
stock exchange in
Tokyo
Operative scale DFW.
Averaged responses of two
marketing executives—
self-reported customer
orientation, and averaged
responses of two purchasing
executives of a customer
firm—customer orientation
reported by customers
Subjective composite measure
based on profitability, size,
market share and growth rate
in comparison with the largest
competitor. Averaged responses
of two marketing executives
Positive relationship for both
self-reported and reported-
by-customers market
orientation. Moderating
effect of countrySBUs of Indian firms
traded on the Bombay
stock exchange
Harris and Piercy
(1999)
Store managers in large
UK retail organizations
Operative scale MARKOR Subjective composite measures of
company and store performance
Positive relationship
Hooley et al.
(1999a,b)
Firms in Hungary,
Poland and Slovenia
Operative scale based on
MKTOR. Response of executive
director
Subjective composite measures
based on financial—profit and
ROI—and market— sales volume
and market share—criteria, in
relation to main competitors,
budget and last year
Positive relationship
Llonch and
Lopez (1999)
Large Spanish industrial
companies
Operative scale based on
MKTOR. Response of chief
executive
Subjective single measures of
ROI, margin, sales growth, pace of
new product launching, and
overall performance
Positive relationship for ROI,
margin, and overall
performance
Appendix A (continued)
O. Gonzalez-Benito, J. Gonzalez-Benito / Industrial Marketing Management 34 (2005) 797–829816

Empirical
study
Analysed population Market Orientation Measure Performance measure Relevant results in relation to
market orientation–
performance relationship
Mavondo
(1999),
Mavondo and
Farrell (2003)
Food manufacturing
business in Zimbabwe
Not specified. Single respondent Objective single measure of ROA
and composite measure of marketing
effectiveness based on sales growth,
changes in market share and number
of successful new products in the
last three years
Positive relationship for
marketing effectiveness
Moorman and
Rust (1999)
Managers from different
functions from US
business organizations
Operative scales MARKOR and
MKTOR
Subjective composite measures of
financial performance—based on
costs, sales, profitability and market
share, customer relationship
performance—based on customer
satisfaction and retention, and
quality, and new product
performance—based on speed,
creativity and financial performance
of new product/service development,
relative to objectives.
Positive relationship except
for customer relationship
satisfaction
Sargeant and
Mohamad
(1999)
Hotel groups in the UK Operative scale. Response of
marketing director
Objective primary measures
of turnover and profit after tax
No relationship
Vorhies, Harper,
and Rao
(1999)
Large manufacturing
and service firms with
Australian operations
Operative scale MARKOR.
Response of top marketing
executive
Subjective single measures of
profitability, growth, adaptability
and customer satisfaction relative
to that of major competitors
Positive relationship
Alvarez et al.
(2000),
Vazquez et al.
(2001)
Industrial firms in
Asturias (Spain)
(1) Cultural scale based on
MKTOR structure. (2) Operative
scale based on MARKOR
structure. Response of
firm’s director
Subjective single measure of ROI,
profits, sales and new product
success relative to objectives and
competitors in the last period
Positive relationship, especially
for ROI and new product
success. Moderating effect
of uncertainty. No moderating
effect of dynamism,
competitive intensity and
technological turbulence
Cravens and
Guilding
(2000)
US companies with
strong brands
Operative scale based on
MKTOR. Response of senior level
accounting/finance or marketing
executive
Subjective composite measure
based on customer satisfaction,
sales volume, sales growth and
profits relative to expectation
Positive relationship
Dawes (2000) Firms in South Australia Operative scale based on
MKTOR, MARKOR, DFW and
Deng and Dart (1994). Four
components— customer
orientation, customer
responsiveness, competitor
orientation and market
information sharing. Average
of responses of CEO and
other senior managers
Subjective composite measure of
performance. Response of CEO
Positive relationship except for
market information sharing.
Only relationship with
customer orientation remains
significant when other
influences are controlled
Deshpande and
Farley (2000)
Senior managers of
Chinese companies
headquartered in
Shanghai
Operative scale DFW Subjective composite measure
based on profitability, size, market
share and growth rate in comparison
with the largest competitor
Positive relationship
Deshpande et al.
(2000)
Japanese firms Operative scale DFW. Averaged
responses of two marketing
executives-self-reported market
orientation, and averaged
responses of two purchasing
executives of a customer firm-
market orientation reported by
customers
Subjective composite measure
based on profitability, size, market
share and growth rate in
comparison with the largest
competitor. Averaged responses
of two marketing executives
No relationship. No
moderating effect of
country-related to
cultural environment
US firms
UK firms
German firms
French firms
Appendix A (continued)
(continued on next page)
O. Gonzalez-Benito, J. Gonzalez-Benito / Industrial Marketing Management 34 (2005) 797–829 817
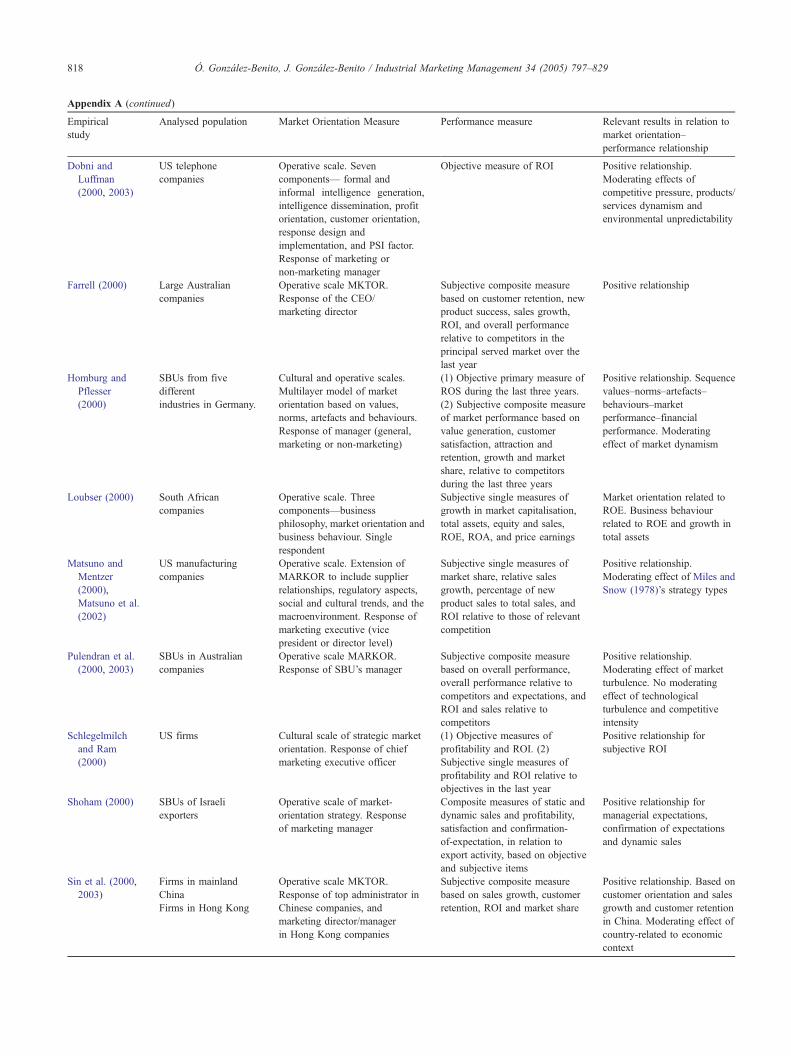
Empirical
study
Analysed population Market Orientation Measure Performance measure Relevant results in relation to
market orientation–
performance relationship
Dobni and
Luffman
(2000, 2003)
US telephone
companies
Operative scale. Seven
components— formal and
informal intelligence generation,
intelligence dissemination, profit
orientation, customer orientation,
response design and
implementation, and PSI factor.
Response of marketing or
non-marketing manager
Objective measure of ROI Positive relationship.
Moderating effects of
competitive pressure, products/
services dynamism and
environmental unpredictability
Farrell (2000) Large Australian
companies
Operative scale MKTOR.
Response of the CEO/
marketing director
Subjective composite measure
based on customer retention, new
product success, sales growth,
ROI, and overall performance
relative to competitors in the
principal served market over the
last year
Positive relationship
Homburg and
Pflesser
(2000)
SBUs from five
different
industries in Germany.
Cultural and operative scales.
Multilayer model of market
orientation based on values,
norms, artefacts and behaviours.
Response of manager (general,
marketing or non-marketing)
(1) Objective primary measure of
ROS during the last three years.
(2) Subjective composite measure
of market performance based on
value generation, customer
satisfaction, attraction and
retention, growth and market
share, relative to competitors
during the last three years
Positive relationship. Sequence
values–norms–artefacts–
behaviours–market
performance–financial
performance. Moderating
effect of market dynamism
Loubser (2000) South African
companies
Operative scale. Three
components—business
philosophy, market orientation and
business behaviour. Single
respondent
Subjective single measures of
growth in market capitalisation,
total assets, equity and sales,
ROE, ROA, and price earnings
Market orientation related to
ROE. Business behaviour
related to ROE and growth in
total assets
Matsuno and
Mentzer
(2000),
Matsuno et al.
(2002)
US manufacturing
companies
Operative scale. Extension of
MARKOR to include supplier
relationships, regulatory aspects,
social and cultural trends, and the
macroenvironment. Response of
marketing executive (vice
president or director level)
Subjective single measures of
market share, relative sales
growth, percentage of new
product sales to total sales, and
ROI relative to those of relevant
competition
Positive relationship.
Moderating effect of Miles and
Snow (1978)’s strategy types
Pulendran et al.
(2000, 2003)
SBUs in Australian
companies
Operative scale MARKOR.
Response of SBU’s manager
Subjective composite measure
based on overall performance,
overall performance relative to
competitors and expectations, and
ROI and sales relative to
competitors
Positive relationship.
Moderating effect of market
turbulence. No moderating
effect of technological
turbulence and competitive
intensity
Schlegelmilch
and Ram
(2000)
US firms Cultural scale of strategic market
orientation. Response of chief
marketing executive officer
(1) Objective measures of
profitability and ROI. (2)
Subjective single measures of
profitability and ROI relative to
objectives in the last year
Positive relationship for
subjective ROI
Shoham (2000) SBUs of Israeli
exporters
Operative scale of market-
orientation strategy. Response
of marketing manager
Composite measures of static and
dynamic sales and profitability,
satisfaction and confirmation-
of-expectation, in relation to
export activity, based on objective
and subjective items
Positive relationship for
managerial expectations,
confirmation of expectations
and dynamic sales
Sin et al. (2000,
2003)
Firms in mainland
China
Operative scale MKTOR.
Response of top administrator in
Chinese companies, and
marketing director/manager
in Hong Kong companies
Subjective composite measure
based on sales growth, customer
retention, ROI and market share
Positive relationship. Based on
customer orientation and sales
growth and customer retention
in China. Moderating effect of
country-related to economic
context
Firms in Hong Kong
Appendix A (continued)
O. Gonzalez-Benito, J. Gonzalez-Benito / Industrial Marketing Management 34 (2005) 797–829818
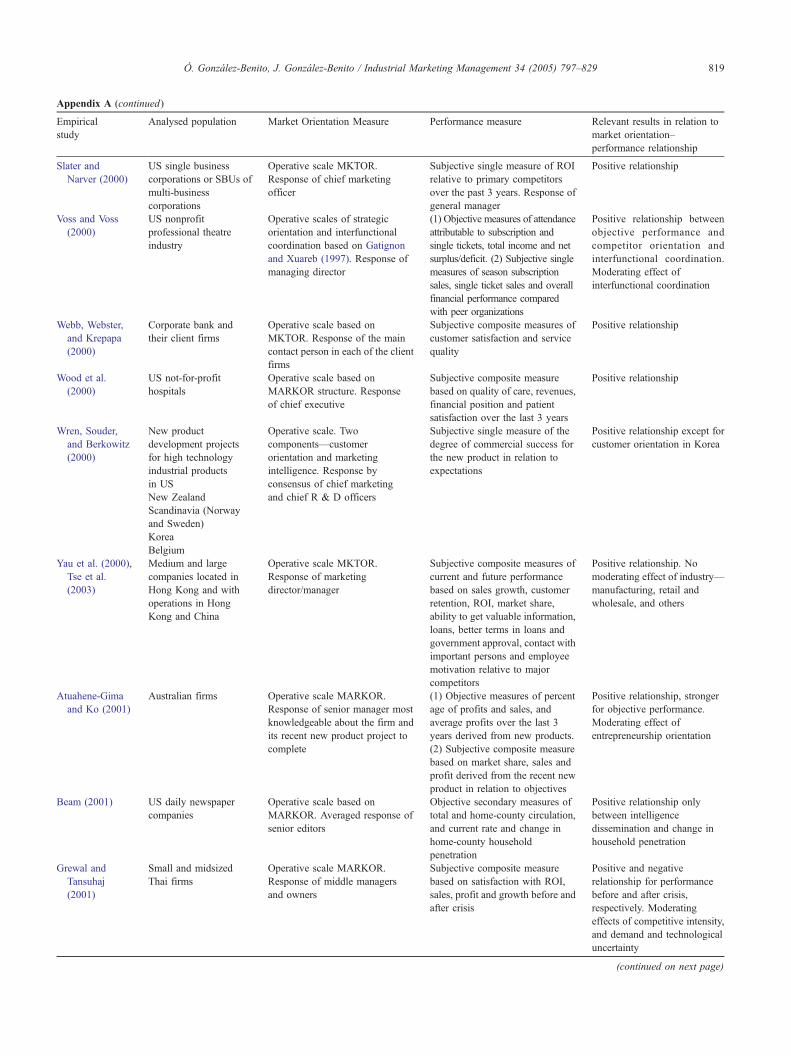
Empirical
study
Analysed population Market Orientation Measure Performance measure Relevant results in relation to
market orientation–
performance relationship
Slater and
Narver (2000)
US single business
corporations or SBUs of
multi-business
corporations
Operative scale MKTOR.
Response of chief marketing
officer
Subjective single measure of ROI
relative to primary competitors
over the past 3 years. Response of
general manager
Positive relationship
Voss and Voss
(2000)
US nonprofit
professional theatre
industry
Operative scales of strategic
orientation and interfunctional
coordination based on Gatignon
and Xuareb (1997). Response of
managing director
(1) Objective measures of attendance
attributable to subscription and
single tickets, total income and net
surplus/deficit. (2) Subjective single
measures of season subscription
sales, single ticket sales and overall
financial performance compared
with peer organizations
Positive relationship between
objective performance and
competitor orientation and
interfunctional coordination.
Moderating effect of
interfunctional coordination
Webb, Webster,
and Krepapa
(2000)
Corporate bank and
their client firms
Operative scale based on
MKTOR. Response of the main
contact person in each of the client
firms
Subjective composite measures of
customer satisfaction and service
quality
Positive relationship
Wood et al.
(2000)
US not-for-profit
hospitals
Operative scale based on
MARKOR structure. Response
of chief executive
Subjective composite measure
based on quality of care, revenues,
financial position and patient
satisfaction over the last 3 years
Positive relationship
Wren, Souder,
and Berkowitz
(2000)
New product
development projects
for high technology
industrial products
in US
Operative scale. Two
components—customer
orientation and marketing
intelligence. Response by
consensus of chief marketing
and chief R & D officers
Subjective single measure of the
degree of commercial success for
the new product in relation to
expectations
Positive relationship except for
customer orientation in Korea
New Zealand
Scandinavia (Norway
and Sweden)
Korea
Belgium
Yau et al. (2000),
Tse et al.
(2003)
Medium and large
companies located in
Hong Kong and with
operations in Hong
Kong and China
Operative scale MKTOR.
Response of marketing
director/manager
Subjective composite measures of
current and future performance
based on sales growth, customer
retention, ROI, market share,
ability to get valuable information,
loans, better terms in loans and
government approval, contact with
important persons and employee
motivation relative to major
competitors
Positive relationship. No
moderating effect of industry—
manufacturing, retail and
wholesale, and others
Atuahene-Gima
and Ko (2001)
Australian firms Operative scale MARKOR.
Response of senior manager most
knowledgeable about the firm and
its recent new product project to
complete
(1) Objective measures of percent
age of profits and sales, and
average profits over the last 3
years derived from new products.
(2) Subjective composite measure
based on market share, sales and
profit derived from the recent new
product in relation to objectives
Positive relationship, stronger
for objective performance.
Moderating effect of
entrepreneurship orientation
Beam (2001) US daily newspaper
companies
Operative scale based on
MARKOR. Averaged response of
senior editors
Objective secondary measures of
total and home-county circulation,
and current rate and change in
home-county household
penetration
Positive relationship only
between intelligence
dissemination and change in
household penetration
Grewal and
Tansuhaj
(2001)
Small and midsized
Thai firms
Operative scale MARKOR.
Response of middle managers
and owners
Subjective composite measure
based on satisfaction with ROI,
sales, profit and growth before and
after crisis
Positive and negative
relationship for performance
before and after crisis,
respectively. Moderating
effects of competitive intensity,
and demand and technological
uncertainty
Appendix A (continued)
(continued on next page)
O. Gonzalez-Benito, J. Gonzalez-Benito / Industrial Marketing Management 34 (2005) 797–829 819

Empirical
study
Analysed population Market Orientation Measure Performance measure Relevant results in relation to
market orientation–
performance relationship
Harris (2001) Medium and large UK
firms
Operative scale MKTOR.
Response of managing
director/chief executive
officer
(1) Objective secondary measures
of sales growth and ROI. (2)
Subjective single measures of
sales growth and ROI relative to
competitors
No relationship. Moderating
effect of market turbulence and
competitive hostility. No
moderating effect of
technological turbulence
Harris and
Ogbonna
(2001),
Ogbonna and
Harris (2002)
Medium and large UK
firms
Operative scale MKTOR.
Response of head of marketing
Subjective composite measure
based on customer satisfaction,
sales growth, market share,
competitive advantage and sales
volume pertaining to long and
short-term
Positive relationship
Harrison-Walker
(2001)
SBUs of US
organizations in
hospitality and beverage
manufacturing indus-
tries
Operative scale. Two
components—customers and
competitors—and four
stages—information acquisition,
sharing and shared interpretation,
and developing and
implementation of strategies.
Averaged responses of senior level
marketing executives
Subjective composite measures of
financial performance—based on
sales, sales growth, profit, ROI
and market share—, customer
response performance-based on
propensity, willingness and
perception of superiority-and
innovation performance-based on
new product success and time to
market
Positive relationship for
customer orientation
Hult and
Ketchen
(2001)
SBUs of large
multinational
corporations
Operative scale MKTOR.
Response of senior executive
Objective measures of change in
ROI, income, and stock price over
the past 5 years
Positive relationship through
positional advantage
Kahn (2001) US apparel and textile
manufacturers
Operative scale based on MKTOR
and distinguishing interaction and
collaboration from interfunctional
coordination. Response of
marketing, R & D and
manufacturing managers
Subjective single measures of
product development (pre-launch)
and product management (launch
and post-launch) performance
Positive relationship for
product development
performance based on
marketing managers’
perceptions, and for product
management performance
based on marketing and
manufacturing perceptions
Langerak
(2001a,b)
Dutch manufacturers. Operative scales of downstream
and upstream market orientation.
Response of general manager.
Scales of customer orientation of
salespersons and of supplier
orientation of purchasers.
Response of contact with
knowledge about the relationship
in a customer and a supplier firm,
respectively
Subjective composite measure of
financial performance—based on
sales growth, profit, new product
success and ROI. Response of
general manager. Subjective
composite measures of trust,
cooperative norms and
satisfaction. Response of contact
with knowledge about the
relationship in a customer and a
supplier firm
Positive relationship between
downstream market orientation
and financial performance
through customer orientation
and trust, cooperative norms
and satisfaction. Positive
relationship between upstream
market orientation and
financial performance through
supplier orientation and trust
and cooperative norms
Prasad,
Ranamurthy,
and Naidu
(2001)
US manufacturing firms
involved in exporting in
a large Midwestern state
Operative scale MKTOR.
Response of chief executive
officer
Subjective composite measure
based on economic/financial and
strategic outcomes of exporting
and satisfaction with them
Positive relationship through
marketing competencies.
Moderating effects of
competitive intensity,
integration of the internet, size
and degree of export
dependence
Santos et al.
(2001)
Medium and large
industrial firms in
Spain
Operative scale based on
MARKOR structure. Response of
general manager or marketing
manager
Subjective composite measure
based on ROI, sales, new product
success and profit
Positive relationship
Shoham and
Rose (2001)
Israeli firms from four
industries
Operative scale MARKOR.
Response of manager
Composite measures of sales,
growth in sales, profitability and
growth in profitability based on
objective and subjective items
Positive relationship except for
sales
Appendix A (continued)
O. Gonzalez-Benito, J. Gonzalez-Benito / Industrial Marketing Management 34 (2005) 797–829820
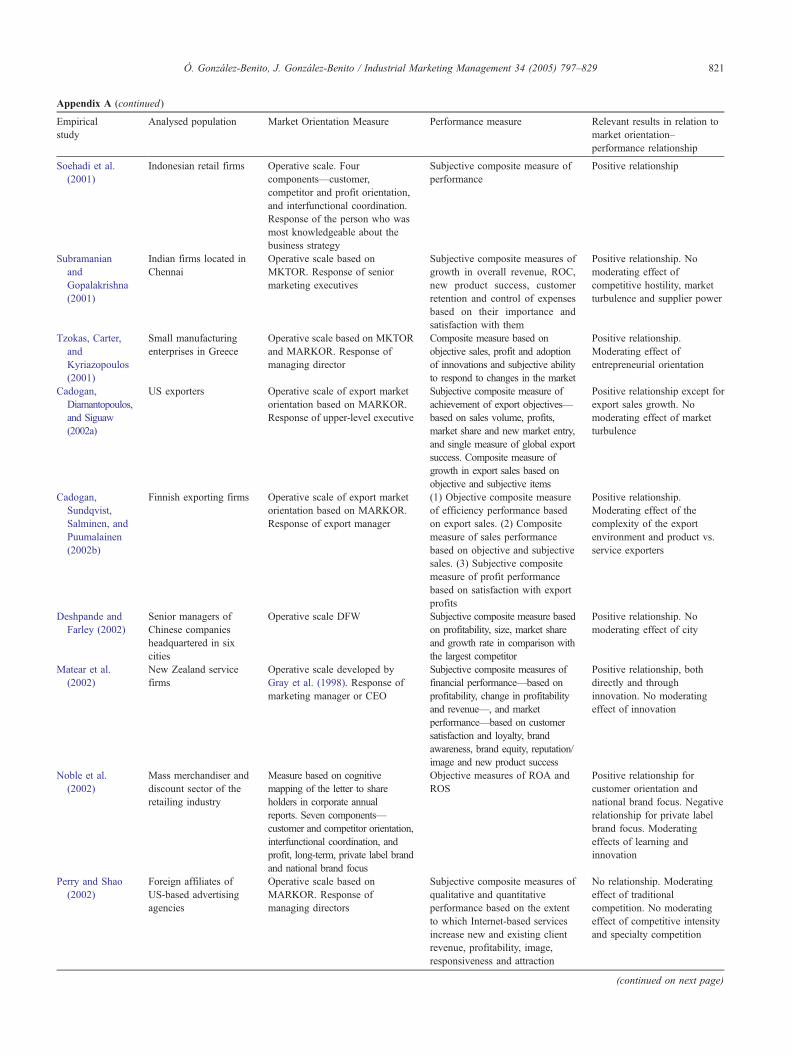
Empirical
study
Analysed population Market Orientation Measure Performance measure Relevant results in relation to
market orientation–
performance relationship
Soehadi et al.
(2001)
Indonesian retail firms Operative scale. Four
components—customer,
competitor and profit orientation,
and interfunctional coordination.
Response of the person who was
most knowledgeable about the
business strategy
Subjective composite measure of
performance
Positive relationship
Subramanian
and
Gopalakrishna
(2001)
Indian firms located in
Chennai
Operative scale based on
MKTOR. Response of senior
marketing executives
Subjective composite measures of
growth in overall revenue, ROC,
new product success, customer
retention and control of expenses
based on their importance and
satisfaction with them
Positive relationship. No
moderating effect of
competitive hostility, market
turbulence and supplier power
Tzokas, Carter,
and
Kyriazopoulos
(2001)
Small manufacturing
enterprises in Greece
Operative scale based on MKTOR
and MARKOR. Response of
managing director
Composite measure based on
objective sales, profit and adoption
of innovations and subjective ability
to respond to changes in the market
Positive relationship.
Moderating effect of
entrepreneurial orientation
Cadogan,
Diamantopoulos,
and Siguaw
(2002a)
US exporters Operative scale of export market
orientation based on MARKOR.
Response of upper-level executive
Subjective composite measure of
achievement of export objectives—
based on sales volume, profits,
market share and new market entry,
and single measure of global export
success. Composite measure of
growth in export sales based on
objective and subjective items
Positive relationship except for
export sales growth. No
moderating effect of market
turbulence
Cadogan,
Sundqvist,
Salminen, and
Puumalainen
(2002b)
Finnish exporting firms Operative scale of export market
orientation based on MARKOR.
Response of export manager
(1) Objective composite measure
of efficiency performance based
on export sales. (2) Composite
measure of sales performance
based on objective and subjective
sales. (3) Subjective composite
measure of profit performance
based on satisfaction with export
profits
Positive relationship.
Moderating effect of the
complexity of the export
environment and product vs.
service exporters
Deshpande and
Farley (2002)
Senior managers of
Chinese companies
headquartered in six
cities
Operative scale DFW Subjective composite measure based
on profitability, size, market share
and growth rate in comparison with
the largest competitor
Positive relationship. No
moderating effect of city
Matear et al.
(2002)
New Zealand service
firms
Operative scale developed by
Gray et al. (1998). Response of
marketing manager or CEO
Subjective composite measures of
financial performance—based on
profitability, change in profitability
and revenue—, and market
performance—based on customer
satisfaction and loyalty, brand
awareness, brand equity, reputation/
image and new product success
Positive relationship, both
directly and through
innovation. No moderating
effect of innovation
Noble et al.
(2002)
Mass merchandiser and
discount sector of the
retailing industry
Measure based on cognitive
mapping of the letter to share
holders in corporate annual
reports. Seven components—
customer and competitor orientation,
interfunctional coordination, and
profit, long-term, private label brand
and national brand focus
Objective measures of ROA and
ROS
Positive relationship for
customer orientation and
national brand focus. Negative
relationship for private label
brand focus. Moderating
effects of learning and
innovation
Perry and Shao
(2002)
Foreign affiliates of
US-based advertising
agencies
Operative scale based on
MARKOR. Response of
managing directors
Subjective composite measures of
qualitative and quantitative
performance based on the extent
to which Internet-based services
increase new and existing client
revenue, profitability, image,
responsiveness and attraction
No relationship. Moderating
effect of traditional
competition. No moderating
effect of competitive intensity
and specialty competition
Appendix A (continued)
(continued on next page)
O. Gonzalez-Benito, J. Gonzalez-Benito / Industrial Marketing Management 34 (2005) 797–829 821
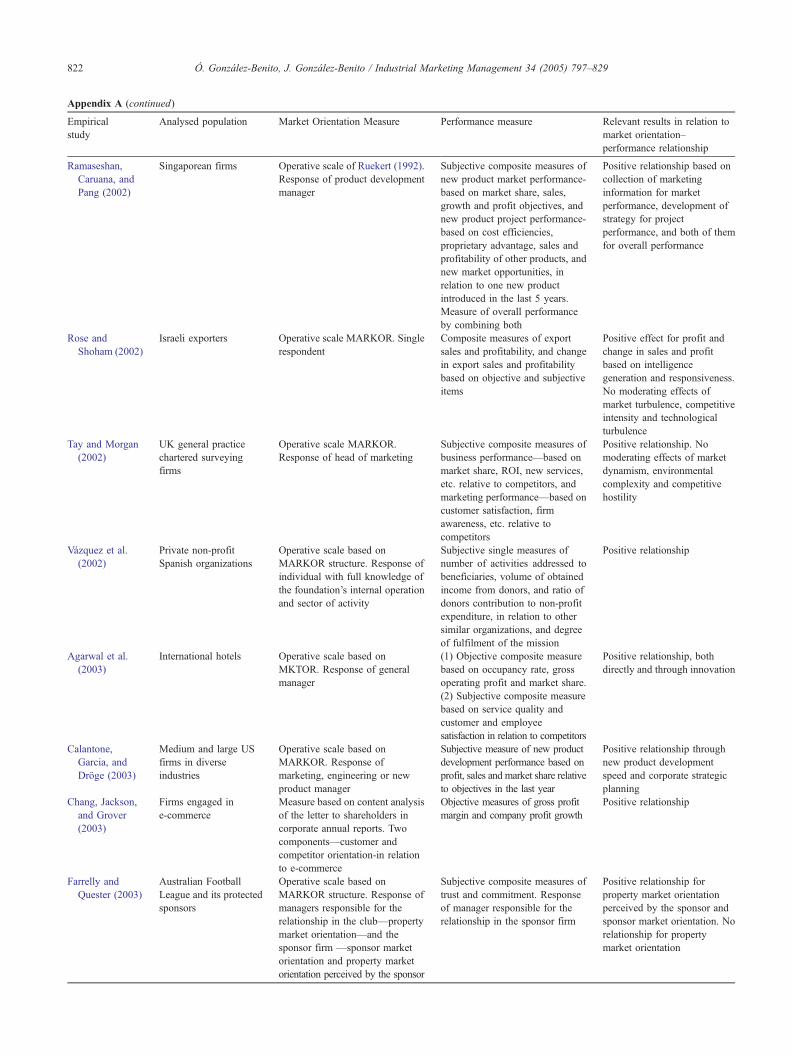
Empirical
study
Analysed population Market Orientation Measure Performance measure Relevant results in relation to
market orientation–
performance relationship
Ramaseshan,
Caruana, and
Pang (2002)
Singaporean firms Operative scale of Ruekert (1992).
Response of product development
manager
Subjective composite measures of
new product market performance-
based on market share, sales,
growth and profit objectives, and
new product project performance-
based on cost efficiencies,
proprietary advantage, sales and
profitability of other products, and
new market opportunities, in
relation to one new product
introduced in the last 5 years.
Measure of overall performance
by combining both
Positive relationship based on
collection of marketing
information for market
performance, development of
strategy for project
performance, and both of them
for overall performance
Rose and
Shoham (2002)
Israeli exporters Operative scale MARKOR. Single
respondent
Composite measures of export
sales and profitability, and change
in export sales and profitability
based on objective and subjective
items
Positive effect for profit and
change in sales and profit
based on intelligence
generation and responsiveness.
No moderating effects of
market turbulence, competitive
intensity and technological
turbulence
Tay and Morgan
(2002)
UK general practice
chartered surveying
firms
Operative scale MARKOR.
Response of head of marketing
Subjective composite measures of
business performance—based on
market share, ROI, new services,
etc. relative to competitors, and
marketing performance—based on
customer satisfaction, firm
awareness, etc. relative to
competitors
Positive relationship. No
moderating effects of market
dynamism, environmental
complexity and competitive
hostility
Vazquez et al.
(2002)
Private non-profit
Spanish organizations
Operative scale based on
MARKOR structure. Response of
individual with full knowledge of
the foundation’s internal operation
and sector of activity
Subjective single measures of
number of activities addressed to
beneficiaries, volume of obtained
income from donors, and ratio of
donors contribution to non-profit
expenditure, in relation to other
similar organizations, and degree
of fulfilment of the mission
Positive relationship
Agarwal et al.
(2003)
International hotels Operative scale based on
MKTOR. Response of general
manager
(1) Objective composite measure
based on occupancy rate, gross
operating profit and market share.
(2) Subjective composite measure
based on service quality and
customer and employee
satisfaction in relation to competitors
Positive relationship, both
directly and through innovation
Calantone,
Garcia, and
Droge (2003)
Medium and large US
firms in diverse
industries
Operative scale based on
MARKOR. Response of
marketing, engineering or new
product manager
Subjective measure of new product
development performance based on
profit, sales and market share relative
to objectives in the last year
Positive relationship through
new product development
speed and corporate strategic
planning
Chang, Jackson,
and Grover
(2003)
Firms engaged in
e-commerce
Measure based on content analysis
of the letter to shareholders in
corporate annual reports. Two
components—customer and
competitor orientation-in relation
to e-commerce
Objective measures of gross profit
margin and company profit growth
Positive relationship
Farrelly and
Quester (2003)
Australian Football
League and its protected
sponsors
Operative scale based on
MARKOR structure. Response of
managers responsible for the
relationship in the club—property
market orientation—and the
sponsor firm —sponsor market
orientation and property market
orientation perceived by the sponsor
Subjective composite measures of
trust and commitment. Response
of manager responsible for the
relationship in the sponsor firm
Positive relationship for
property market orientation
perceived by the sponsor and
sponsor market orientation. No
relationship for property
market orientation
Appendix A (continued)
O. Gonzalez-Benito, J. Gonzalez-Benito / Industrial Marketing Management 34 (2005) 797–829822
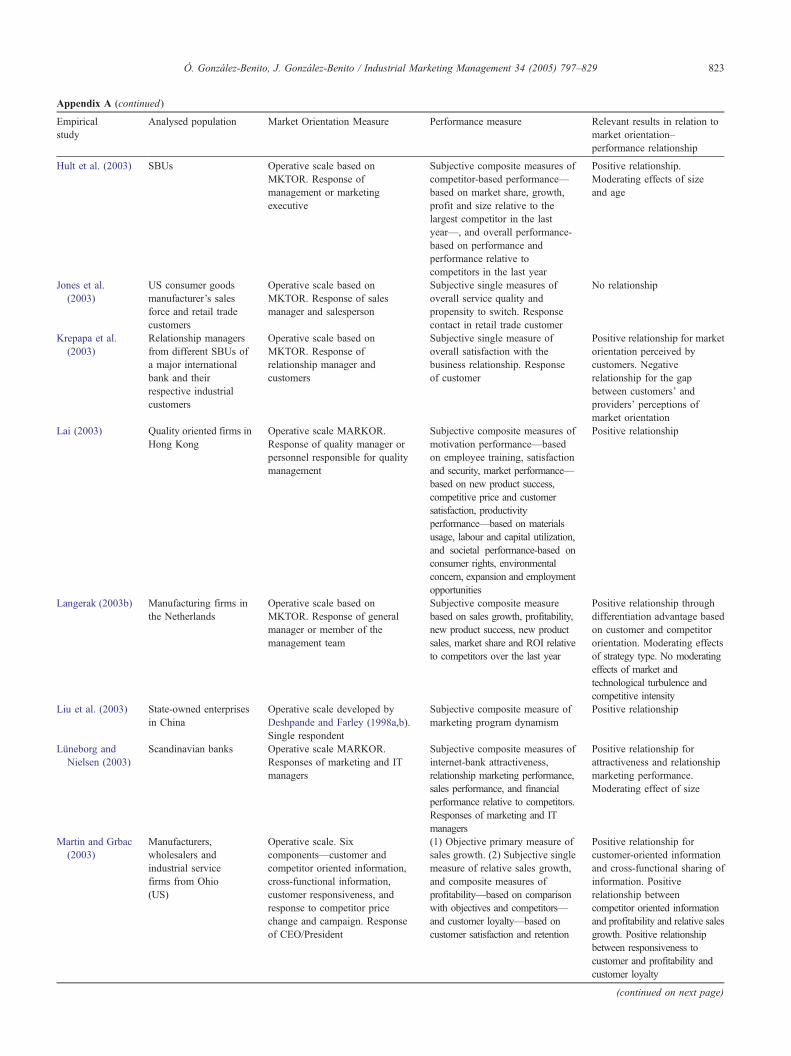
Empirical
study
Analysed population Market Orientation Measure Performance measure Relevant results in relation to
market orientation–
performance relationship
Hult et al. (2003) SBUs Operative scale based on
MKTOR. Response of
management or marketing
executive
Subjective composite measures of
competitor-based performance—
based on market share, growth,
profit and size relative to the
largest competitor in the last
year—, and overall performance-
based on performance and
performance relative to
competitors in the last year
Positive relationship.
Moderating effects of size
and age
Jones et al.
(2003)
US consumer goods
manufacturer’s sales
force and retail trade
customers
Operative scale based on
MKTOR. Response of sales
manager and salesperson
Subjective single measures of
overall service quality and
propensity to switch. Response
contact in retail trade customer
No relationship
Krepapa et al.
(2003)
Relationship managers
from different SBUs of
a major international
bank and their
respective industrial
customers
Operative scale based on
MKTOR. Response of
relationship manager and
customers
Subjective single measure of
overall satisfaction with the
business relationship. Response
of customer
Positive relationship for market
orientation perceived by
customers. Negative
relationship for the gap
between customers’ and
providers’ perceptions of
market orientation
Lai (2003) Quality oriented firms in
Hong Kong
Operative scale MARKOR.
Response of quality manager or
personnel responsible for quality
management
Subjective composite measures of
motivation performance—based
on employee training, satisfaction
and security, market performance—
based on new product success,
competitive price and customer
satisfaction, productivity
performance—based on materials
usage, labour and capital utilization,
and societal performance-based on
consumer rights, environmental
concern, expansion and employment
opportunities
Positive relationship
Langerak (2003b) Manufacturing firms in
the Netherlands
Operative scale based on
MKTOR. Response of general
manager or member of the
management team
Subjective composite measure
based on sales growth, profitability,
new product success, new product
sales, market share and ROI relative
to competitors over the last year
Positive relationship through
differentiation advantage based
on customer and competitor
orientation. Moderating effects
of strategy type. No moderating
effects of market and
technological turbulence and
competitive intensity
Liu et al. (2003) State-owned enterprises
in China
Operative scale developed by
Deshpande and Farley (1998a,b).
Single respondent
Subjective composite measure of
marketing program dynamism
Positive relationship
Luneborg and
Nielsen (2003)
Scandinavian banks Operative scale MARKOR.
Responses of marketing and IT
managers
Subjective composite measures of
internet-bank attractiveness,
relationship marketing performance,
sales performance, and financial
performance relative to competitors.
Responses of marketing and IT
managers
Positive relationship for
attractiveness and relationship
marketing performance.
Moderating effect of size
Martin and Grbac
(2003)
Manufacturers,
wholesalers and
industrial service
firms from Ohio
(US)
Operative scale. Six
components—customer and
competitor oriented information,
cross-functional information,
customer responsiveness, and
response to competitor price
change and campaign. Response
of CEO/President
(1) Objective primary measure of
sales growth. (2) Subjective single
measure of relative sales growth,
and composite measures of
profitability—based on comparison
with objectives and competitors—
and customer loyalty—based on
customer satisfaction and retention
Positive relationship for
customer-oriented information
and cross-functional sharing of
information. Positive
relationship between
competitor oriented information
and profitability and relative sales
growth. Positive relationship
between responsiveness to
customer and profitability and
customer loyalty
Appendix A (continued)
(continued on next page)
O. Gonzalez-Benito, J. Gonzalez-Benito / Industrial Marketing Management 34 (2005) 797–829 823
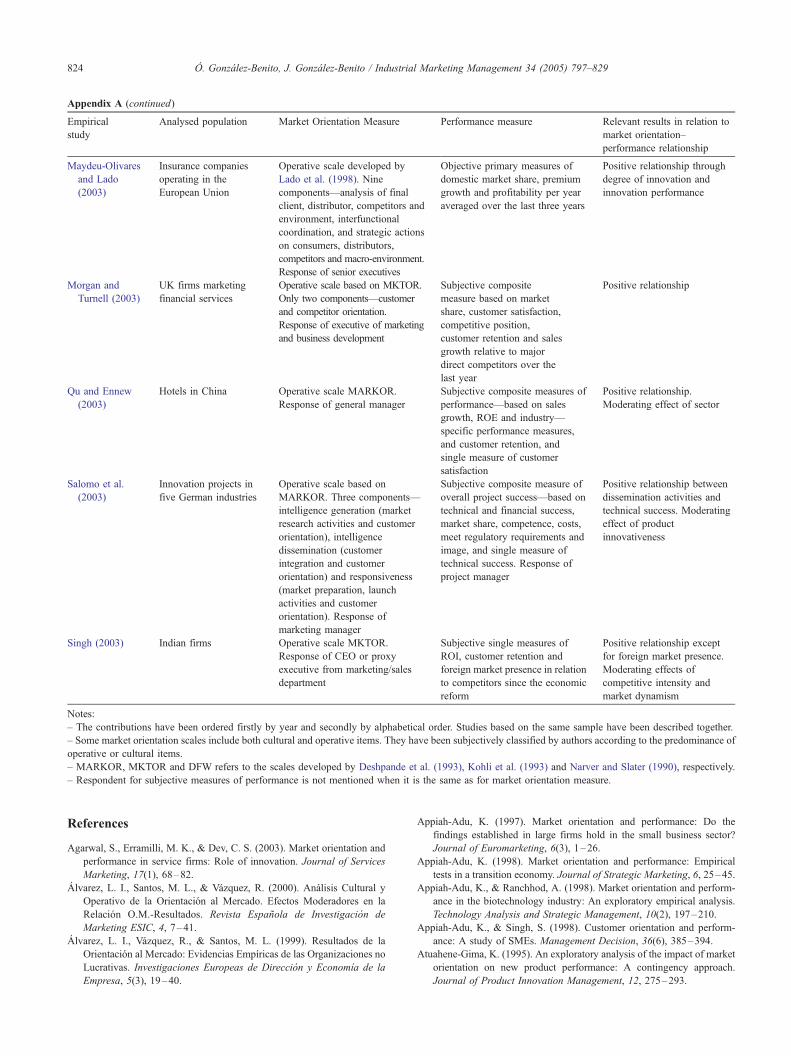
Empirical
study
Analysed population Market Orientation Measure Performance measure Relevant results in relation to
market orientation–
performance relationship
Maydeu-Olivares
and Lado
(2003)
Insurance companies
operating in the
European Union
Operative scale developed by
Lado et al. (1998). Nine
components—analysis of final
client, distributor, competitors and
environment, interfunctional
coordination, and strategic actions
on consumers, distributors,
competitors and macro-environment.
Response of senior executives
Objective primary measures of
domestic market share, premium
growth and profitability per year
averaged over the last three years
Positive relationship through
degree of innovation and
innovation performance
Morgan and
Turnell (2003)
UK firms marketing
financial services
Operative scale based on MKTOR.
Only two components—customer
and competitor orientation.
Response of executive of marketing
and business development
Subjective composite
measure based on market
share, customer satisfaction,
competitive position,
customer retention and sales
growth relative to major
direct competitors over the
last year
Positive relationship
Qu and Ennew
(2003)
Hotels in China Operative scale MARKOR.
Response of general manager
Subjective composite measures of
performance—based on sales
growth, ROE and industry—
specific performance measures,
and customer retention, and
single measure of customer
satisfaction
Positive relationship.
Moderating effect of sector
Salomo et al.
(2003)
Innovation projects in
five German industries
Operative scale based on
MARKOR. Three components—
intelligence generation (market
research activities and customer
orientation), intelligence
dissemination (customer
integration and customer
orientation) and responsiveness
(market preparation, launch
activities and customer
orientation). Response of
marketing manager
Subjective composite measure of
overall project success—based on
technical and financial success,
market share, competence, costs,
meet regulatory requirements and
image, and single measure of
technical success. Response of
project manager
Positive relationship between
dissemination activities and
technical success. Moderating
effect of product
innovativeness
Singh (2003) Indian firms Operative scale MKTOR.
Response of CEO or proxy
executive from marketing/sales
department
Subjective single measures of
ROI, customer retention and
foreign market presence in relation
to competitors since the economic
reform
Positive relationship except
for foreign market presence.
Moderating effects of
competitive intensity and
market dynamism
Notes:
– The contributions have been ordered firstly by year and secondly by alphabetical order. Studies based on the same sample have been described together.
– Some market orientation scales include both cultural and operative items. They have been subjectively classified by authors according to the predominance of
operative or cultural items.
– MARKOR, MKTOR and DFW refers to the scales developed by Deshpande et al. (1993), Kohli et al. (1993) and Narver and Slater (1990), respectively.
– Respondent for subjective measures of performance is not mentioned when it is the same as for market orientation measure.
Appendix A (continued)
O. Gonzalez-Benito, J. Gonzalez-Benito / Industrial Marketing Management 34 (2005) 797–829824
References
Agarwal, S., Erramilli, M. K., & Dev, C. S. (2003). Market orientation and
performance in service firms: Role of innovation. Journal of Services
Marketing, 17(1), 68–82.
Alvarez, L. I., Santos, M. L., & Vazquez, R. (2000). Analisis Cultural y
Operativo de la Orientacion al Mercado. Efectos Moderadores en la
Relacion O.M.-Resultados. Revista Espanola de Investigacion de
Marketing ESIC, 4, 7–41.
Alvarez, L. I., Vazquez, R., & Santos, M. L. (1999). Resultados de la
Orientacion al Mercado: Evidencias Empıricas de las Organizaciones no
Lucrativas. Investigaciones Europeas de Direccion y Economıa de la
Empresa, 5(3), 19–40.
Appiah-Adu, K. (1997). Market orientation and performance: Do the
findings established in large firms hold in the small business sector?
Journal of Euromarketing, 6(3), 1–26.
Appiah-Adu, K. (1998). Market orientation and performance: Empirical
tests in a transition economy. Journal of Strategic Marketing, 6, 25–45.
Appiah-Adu, K., & Ranchhod, A. (1998). Market orientation and perform-
ance in the biotechnology industry: An exploratory empirical analysis.
Technology Analysis and Strategic Management, 10(2), 197–210.
Appiah-Adu, K., & Singh, S. (1998). Customer orientation and perform-
ance: A study of SMEs. Management Decision, 36(6), 385–394.
Atuahene-Gima, K. (1995). An exploratory analysis of the impact of market
orientation on new product performance: A contingency approach.
Journal of Product Innovation Management, 12, 275–293.
O. Gonzalez-Benito, J. Gonzalez-Benito / Industrial Marketing Management 34 (2005) 797–829 825
Atuahene-Gima, K. (1996). Market orientation and innovation. Journal of
Business Research, 35, 93–103.
Atuahene-Gima, K., & Ko, A. (2001). An empirical investigation of the
effect of market orientation and entrepreneurship orientation alignment
on product innovation. Organization Science, 12(1), 54–74.
Au, A. K. M., & Tse, A. C. B. (1995). The effect of marketing orientation
on company performance in the service sector: A comparative study of
the hotel industry in Hong Kong and New Zeland. Journal of
International Consumer Marketing, 8(2), 77–87.
Avlonitis, G. J., & Gounaris, S. P. (1997). Marketing orientation and
company performance. Industrial vs. consumer goods companies.
Industrial Marketing Management, 26, 385–402.
Baker, T. L., Simpson, P. M., & Siguaw, J. A. (1998). The impact of
suppliers’ perceptions of reseller market orientation on key relation-
ship constructs. Journal of the Academy of Marketing Science, 27(1),
50–57.
Baker, W. E., & Sinkula, J. M. (1999a). The synergistic effect of market
orientation and learning orientation on organizational performance.
Journal of the Academy of Marketing Science, 27(4), 411–427.
Baker, W. E., & Sinkula, J. M. (1999b). Learning orientation, market
orientation, and innovation: Integrating and extending models of
organizational performance. Journal of Market Focused Management,
4, 295–308.
Balabanis, G., Stables, R. E., & Phillips, H. C. (1997). Market orientation in
the top 200 British Charity Organizations and its impact on their
performance. European Journal of Marketing, 31(8), 583–603.
Balakrishnan, S. (1997). Benefits of customer and competitive orienta-
tion in industrial marketing. Industrial Marketing Management, 25,
257–269.
Barret, H., & Weinstein, A. (1998). The effect of market orientation and
organizational flexibility on corporate entrepreneurship. Entrepreneur-
ship Theory and Practice, 23(1), 57–70.
Beam, R. A. (2001). Does it pay to be a market-oriented daily newspaper?
Journalism and Mass Communication Quarterly, 78(3), 466–483.
Becherer, R. C., & Maurer, J. G. (1997). The moderating effect of
environmental variables on the entrepreneurial and marketing orienta-
tion of entrepreneur-led firms. Entrepreneurship Theory and Practice,
22(1), 47–58.
Becker, J., & Hombugh, C. (1999). Market-oriented management: A
systems-based perspective. Journal of Market Focused Management, 4,
17–41.
Bhuian, S. N. (1997). Exploring market orientation in banks: An empirical
examination in Saudi Arabia. The Journal of Services Marketing, 11(5),
317–328.
Bhuian, S. N. (1998). An empirical examination of market orientation in
Saudi Arabian manufacturing companies. Journal of Business
Research, 43, 13–25.
Cadogan, J. W., Diamantopoulos, A., & Siguaw, J. A. (2002). Export
market-oriented activities: Their antecedents and performance
consequences. Journal of International Business Studies, 33(3),
615–626.
Cadogan, J. W., Sundqvist, S., Salminen, R. T., & Puumalainen, K. (2002).
Market-oriented behavior: Comparing service with product exporters.
European Journal of Marketing, 36(9/10), 1076–1102.
Calantone, R., Garcıa, R., & Droge, C. (2003). The effects of environmental
turbulence on new product development strategy planning. Journal of
Product Innovation Management, 20, 90–103.
Caruana, A., Pitt, L., & Berthon, P. (1999). Excellence—market orientation
link: Some consequences for service firms. Journal of Business
Research, 44, 5–15.
Caruana, A., Ramaseshan, B., & Ewing, M. T. (1998a). The market
orientation—performance link: Some evidence from the public sector
and universities. Journal of Nonprofit & Public Sector Marketing, 6(1),
63–82.
Caruana, A., Ramaseshan, B., & Ewing, M. T. (1998b). Do universities that
are more market oriented perform better? International Journal of
Public Sector Management, 11(1), 55–70.
Caruana, A., Ramaseshan, B., & Ewing, M. T. (1999). Market orientation
and performance in the Australian public sector: The role of organiza-
tional commitment. Journal of Global Marketing, 12(3), 59–79.
Cervera, A. (1999). Construccion de un Modelo de Orientacion al Mercado
en las Administraciones Publicas. Investigaciones Europeas de Direc-
cion y Economıa de la Empresa, 5(3), 41–62.
Cervera, A., Molla, A., & Sanchez, M. (2001). Antecedents and
consequences of market orientation in public organisations. European
Journal of Marketing, 35(11/12), 1259–1286.
Cervera, A., Sanchez, M., & Gil, I. (1999). Desarrollo de una Escala de
Orientacion al Mercado en el Ambito de las Administraciones Publicas.
Revista Espanola de Investigacion de Marketing ESIC, 3(2), 55–81.
Chang, K. -C., Jackson, J., & Grover, V. (2003). E-commerce and corporate
strategy: An executive perspective. Information and Management, 40,
663–675.
Chang, T. -Z. Y., & Chen, S. -J. (1998). Market orientation, service quality
and business profitability: A conceptual model and empirical evidence.
The Journal of Services Marketing, 12(4), 246–264.
Christensen, C., & Bower, J. (1996). Customer power, strategic investment,
and the failure of leading firms. Strategic Management Journal, 17(3),
197–218.
Connolly, T., Conlon, E. J., & Deutsch, S. J. (1980). Organizational
effectiveness: A multiple-constituency approach. Academy of Manage-
ment Review, 5, 211–217.
Connor, T. (1999). Customer-led and market-oriented: A matter of balance.
Strategic Management Journal, 20, 1157–1163.
Covin, J. G., Slevin, D. P., & Schultz, R. L. (1994). Implementing strategic
missions: Effective strategic, structural and tactical choices. Journal of
Management Studies, 31(4), 481–505.
Cravens, K. S., & Guilding, C. (2000). Measuring customer focus: An
examination of the relationship between market orientation and brand
valuation. Journal of Strategic Marketing, 8, 27–45.
Dawes, J. (1999). The relationship between subjective and objective
company performance measures in market orientation research: Further
empirical evidence. Marketing Bulletin, 10, 65–75.
Dawes, J. (2000). Market orientation and company profitability: Further
evidence incorporating longitudinal data. Australian Journal of Market-
ing Research, 25(2), 173–199.
Deng, S., & Dart, J. (1994). Measuring market orientation: A multi-factor,
multi-item approach. Journal of Marketing Management, 10, 725–742.
Deshpande, R., & Farley, J. U. (1998a). Measuring market orientation:
Generalization and synthesis. Journal of Market Focused Management,
2(3), 213–232.
Deshpande, R., & Farley, J. U. (1998b). The market orientation construct:
Correlations, culture and comprehensiveness. Journal of Market
Focused Management, 2(3), 237–239.
Deshpande, R., & Farley, J. U. (1999). Corporate culture and market
orientation: Comparing Indian and Japanese firms. Journal of Interna-
tional Marketing, 7(4), 111–127.
Deshpande, R., & Farley, J. U. (2000). Market-focused organizational
transformation in China. Journal of Global Marketing, 14(1/2), 7–35.
Deshpande, R., & Farley, J. U. (2002). High performance firms in a
complex New China: A tale of six cities. Journal of Global Marketing,
16(1/2), 207–229.
Deshpande, R., Farley, J. U., & Webster Jr., F. E. (1993 January). Corporate
culture, customer orientation, and innovativenes in Japanese firms: A
quadrad analysis. Journal of Marketing, 57, 23–27.
Deshpande, R., Farley, J. U., & Webster Jr., F. E. (2000). Corporate culture
and market orientation: Comparing Indian and Japanese firms. Interna-
tional Journal of Research in Marketing, 17, 353–362.
Dess, G. G., & Robinson Jr., R. B. (1984). Measuring organizational
performance in the absence of objective measures: The case of the
privately-held firm and conglomerate business unit. Strategic Manage-
ment Journal, 5, 265–273.
Diamantopoulos, A., & Hart, S. (1993). Linking market orientation and
company performance: Preliminary evidence on Kohli and Jaworski’s
framework. Journal of Strategic Marketing, 1, 93–121.

O. Gonzalez-Benito, J. Gonzalez-Benito / Industrial Marketing Management 34 (2005) 797–829826
Dobni, C. B., & Luffman, G. (2000). Market orientation and market
strategy profiling an empirical test on environment–behaviour–action
coalignment and its performance implications. Management Decision,
38(8), 503–510.
Dobni, C. B., & Luffman, G. (2003). Determining the scope and impact of
market orientation profiles on strategy implementation and perform-
ance. Strategic Management Journal, 24, 577–585.
Doyle, P., & Wong, V. (1998). Marketing and competitive performance: An
empirical study. European Journal of Marketing, 32(5/6), 514–535.
Esslemont, D., & Lewis, T. (1991, May). Some empirical tests of the
marketing concept. Marketing Bulletin, 2, 1–7.
Farrell, M. A. (2000). Developing a market-oriented learning organisation.
Australian Journal of Management, 25(2), 201–222.
Farrelly, F., & Quester, P. (2003). The effects of market orientation on trust
and commitment: The case of the sponsorship business-to-business
relationship. European Journal of Marketing, 37(3/4), 530–553.
Fritz, W. (1996). Market orientation and corporate success: Findings from
Germany. European Journal of Marketing, 30(8), 59–74.
Gatignon, H., & Xuareb, J. -M. (1997, February). Strategic orientation of
the firm and new product performance. Journal of Marketing Research,
34, 77–90.
Golden, P. A., Doney, P. M., Johnson, D. M., & Smith, J. R. (1995).
The dynamics of a marketing orientation in transition economies:
A study of Russian firms. Journal of International Marketing, 3(2),
29–49.
Gray, B., Greenley, G. E., Matear, S. M., & Matheson, P. K. (1999).
Thriving on turbulence. Journal of Market Focused Management, 4,
231–257.
Gray, B., Matear, S., Boshoff, C., & Matheson, P. (1998). Developing a
better measure of market orientation. European Journal of Marketing,
32(9/10), 884–903.
Greenley, G. E. (1995a). Market orientation and company performance:
Empirical evidence from UK companies. British Journal of Manage-
ment, 6, 1–13.
Greenley, G. E. (1995b). Forms of market orientation in UK companies.
Journal of Management Studies, 32(1), 47–66.
Greenley, G. E., & Foxall, G. R. (1997). Multiple stakeholder orientation in
UK companies and the implications for company performance. Journal
of Management Studies, 34(2), 259–284.
Greenley, G. E., & Foxall, G. R. (1998). External moderation of
associations among stakeholder orientations and company performance.
International Journal of Research in Marketing, 15, 51–69.
Grewal, R., & Tansuhaj, P. (2001, April). Building organizational
capabilities for managing economic crisis: The role of market
orientation and strategic flexibility. Journal of Marketing, 65, 67–80.
Griffiths, J. S., & Grover, R. (1998). A framework for understanding market
orientation: The behavior and the culture. In D. Grewal, & C. Pechman
(Eds.), Marketing Theory and Applications, vol. 9 (pp. 311–320).
Chicago7 American Marketing Association.
Hamel, G., & Prahalad, C. K. (1994). Competing for the future. Boston7
Harvard Business School Press.
Han, J. K., Kim, N., & Srivastava, R. K. (1998, October). Market
orientation and organizational performance: Is innovation a missing
link? Journal of Marketing, 62, 30–45.
Harris, L. C. (2001). Market orientation and performance: Objective and
subjective empirical evidence from UK companies. Journal of Manage-
ment Studies, 38(1), 17–43.
Harris, L. C., & Ogbonna, E. (2001). Strategic human resource manage-
ment, market orientation, and organizational performance. Journal of
Business Research, 51, 157–166.
Harris, L. C., & Piercy, N. F. (1999). A contingency approach to market
orientation: Distinguishing behaviours, systems, structures, strategies
and performance characteristics. Journal of Marketing Management,
15, 617–646.
Harrison-Walker, L. J. (2001). The measurement of a market orientation
and its impact on business performance. Journal of Quality Manage-
ment, 6, 139–172.
Hart, S., & Banbury, C. (1994). How strategy-making processes can make a
difference. Strategic Management Journal, 15, 251–269.
Hayes, R. H., & Weelwright, S. C. (1984). Restoring our competitive edge:
Competing through manufacturing. New York7 John Wiley and
Sons, Inc.
Homburg, C., & Pflesser, C. (2000, November). A multiple-layer
model of market oriented organizational culture: Measurement
issues and performance outcomes. Journal of Marketing Research,
37, 449–462.
Hooley, G., Cox, T., Fahy, J., Shipley, D., Beracs, J., Fonfara, K., et al.
(1999). Market orientation in the transition economies of Central
Europe: Test of the Narver and Slater market orientation scales. Journal
of Business Research, 50, 273–285.
Hooley, G., Fahy, J., Cox, T., Beracs, J., Fonfara, K., & Snoj, B. (1999).
Marketing capabilities and firm performance: A hierarchical model.
Journal of Market Focused Management, 4, 259–278.
Hooley, G. J., Lynch, J. E., & Shepherd, J. (1990). The marketing
concept: Putting theory into practice. European Journal of Marketing,
24(9), 7–24.
Horng, S-C., & Chen, A. C. -H. (1998). Market orientation of small and
medium sized firms in Taiwan. Journal of Small Business Management,
36(3), 79–85.
Hult, G. T. M., & Ketchen Jr., D. J. (2001). Does market orientation
matter?: A test of the relationship between positional advantage and
performance. Strategic Management Journal, 22, 899–906.
Hult, G. T. M., Snow, C. C., & Kandemir, D. (2003). The role of
entrepreneurship in building cultural competitiveness in different
organizational types. Journal of Management, 29(3), 401–426.
Hunt, S. D., & Morgan, R. M. (1995, April). The comparative advantage
theory of competition. Journal of Marketing, 59, 1–15.
Hurley, R. F., & Hule, G. T. M. (1998, July). Innovation, market
orientation, and organizational learning: An integration and empirical
examination. Journal of Marketing, 62, 42–54.
Jaworski, B. J., & Kohli, A. K. (1993, July). Market orientation:
Antecedents and consequences. Journal of Marketing, 57, 53–70.
Jones, E., Busch, P., & Dacin, P. (2003). Firm market orientation and
salesperson customer orientation: Interpersonal and intrapersonal
influences on customer service and retention in business-to-busi-
ness buyer–seller relationships. Journal of Business Research, 56,
323–340.
Kahn, K. B. (2001). Market orientation, interdepartmental integration, and
product development performance. The Journal of Product Innovation
Management, 18, 314–323.
Kohli, A. K., & Jaworski, B. J. (1990, April). Market orientation: The
construct, research propositions, and managerial implications. Journal
of Marketing, 54, 1–18.
Kohli, A. K., Jaworski, B. J., & Kumar, A. (1993, November). MARKOR:
A measure of marketing orientation. Journal of Marketing Research,
30, 467–477.
Kotler, P. (1977, Nov–Dec). From sales obsession to marketing effective-
ness. Harvard Business Review, 67–75.
Krepapa, A., Bherthon, P., Webb, D., & Pitt, L. (2003). Mind the gap: An
analysis of service provider versus customer perceptions of market
orientation and the impact on satisfaction. European Journal of
Marketing, 37(1/2), 197–218.
Kumar, K., & Subramanian, R. (2000). Navigating the external environ-
ment through a market orientation. S.A.M. Advanced Management
Journal, 65(1), 15–30.
Kumar, K., Subramanian, R., & Strandholm, K. (2002). Market orientation
and performance: Does organizational strategy matter? Journal of
Applied Business Research, 18(1), 37–50.
Kumar, K., Subramanian, R., & Yauger, C. (1997). Performance-
oriented: Toward a successful strategy. Marketing Health Services,
17(2), 10–20.
Kumar, K., Subramanian, R., & Yauger, C. (1998). Examining the market
orientation–performance relationship: A context specific study. Journal
of Management, 24(2), 201–233.
O. Gonzalez-Benito, J. Gonzalez-Benito / Industrial Marketing Management 34 (2005) 797–829 827
Lado, N., Maydeu-Olivares, A., & Rivera, J. (1998). Measuring market
orientation in several populations: A structural equations model.
European Journal of Marketing, 32(1/2), 23–39.
Lai, K. -H. (2003). Market orientation in quality-oriented organizations and
its impact on their performance. International Journal of Production
Economics, 84, 17–34.
Langerak, F. (2001a). Effects of market orientation on the behaviors of
salespersons and purchasers, channel relationships, and performance of
manufacturers. International Journal of Research in Marketing, 18,
221–234.
Langerak, F. (2001b). The relationship between customer and supplier
perceptions of the manufacture’s market orientation and its busi-
ness peformance. International Journal of Market Research, 43(1),
43–62.
Langerak, F. (2003a). An appraisal of research on the predictive power of
market orientation. European Management Journal, 21(4), 447–464.
Langerak, F. (2003b). The effect of market orientation on positional
advantage and organizational performance. Journal of Strategic
Marketing, 11, 93–115.
Liu, S. S., Luo, X., & Shi, Y. -Z. (2003). Market-oriented organizations in
an emerging economy: A study of missing links. Journal of Business
Research, 56, 481–491.
Llonch, J., & Lopez, P. (1999). Orientacion al Mercado, Orientacion
Estrategica y Organizacion de las Actividades de Marketing: Una
Investigacion Empırica. Investigaciones Europeas de Direccion y
Economıa de la Empresa, 5(3), 77–94.
Llonch, J., & Walino, S. (1996, Enero–Marzo). Efectos de la Orientacion al
Mercado en los Resultados de la Empresa. ESIC Market, 91, 9–39.
Lonial, S. C., & Raju, P. S. (2001). The impact of environmental
uncertainty on the market orientation–performance relationship: A
study of the hospital industry. Journal of Economic and Social
Research, 3(1), 5–27.
Loubser, S. S. (2000). The relationship between market orientation and
financial peformance in South African organizations. South African
Journal of Business Management, 31(2), 84–89.
Luneborg, J. L., & Nielsen, J. F. (2003). Customer focused technology and
performance in small and large banks. European Management Journal,
21(2), 258–269.
Lusch, R. F., & Laczniak, G. R. (1987). The evolving marketing concept,
competitive intensity and organizational performance. Journal of the
Academy of Marketing Science, 15(3), 1–11.
Marr, B., & Schiuma, G. (2003). Business performance measurement: Past
present and future. Management Decision, 41(8), 680–687.
Martin, J. H., & Grbac, B. (2003). Using supply chain management to
leverage a firm’s market orientation. Industrial Marketing Management,
32, 25–38.
Matear, S., Osborne, P., Garrett, T., & Gray, B. J. (2002). How does market
orientation contribute to service firm peformance? An examination of
alternative mechanisms. European Journal of Marketing, 36(9/10),
1058–1075.
Matsuno, K., & Mentzer, J. T. (2000, October). The effects of strategy type
on the market orientacion–performance relationship. Journal of Market-
ing, 64, 1–16.
Matsuno, K., Mentzer, J. T., & Ozsomer, A. (2002, July). The effects of
entrepreneurial proclivity and market orientation on business perform-
ance. Journal of Marketing, 65, 18–32.
Mavondo, F., & Farrell, M. (2003). Cultural orientation: Its relationship
with market orientation innovation and organizational performance.
Management Decision, 41(3), 241–249.
Mavondo, F. T. (1999). Environment and strategy as antecedents for
marketing effectiveness and organizational performance. Journal of
Strategic Marketing, 7, 237–250.
Maydeu-Olivares, A., & Lado, N. (2003). Market orientation and business
economic performance: A mediated model. International Journal of
Service Industry Management, 14(3), 284–309.
McDermott, D. R., Franzak, F. J., & Little, M. W. (1993). Does marketing
relate to hospital profitability. Marketing Health Services, 13(2), 18–25.
Miles, R. E., & Snow, C. C. (1978). Organizational strategy, structure and
process. New York, NY7 McGraw-Hill.
Moorman, C., & Rust, R. T. (1999). The role of marketing. Journal of
Marketing, 63, 180–197.
Morgan, R. E., & Turnell, C. R. (2003). Market-based organizational
learning and market performance gains. British Journal of Manage-
ment, 14, 255–274.
Naidu, G. M., & Narayana, C. L. (1991). How marketing oriented are
hospital in a declining market? Journal of Health Care Marketing,
11(1), 23–30.
Narver, J. C., & Slater, S. F. (1990, October). The effect of a
market orientation on business profitability. Journal of Marketing,
54, 20–35.
Narver, J. C., & Slater, S. F. (1998). Additional thoughts on the
measurement of market orientation: A comment on Deshpande and
Farley. Journal of Market Focused Management, 2(3), 233–236.
Ngai, J. C. H., & Ellis, P. (1998). Market orientation and business
performance: Some evidence from Hong Kong. International Market-
ing Review, 15(2), 119–139.
Noble, C. H., Sinha, R. K., & Kumar, A. (2002, October). Market
orientation and alternative strategic orientations: A longitudinal
assessment of peformance implications. Journal of Marketing, 66,
25–39.
Oczkowski, E., & Farrell, M. A. (1998). Discriminating between measure-
ment scales using non-nested test and two-stage least squares
estimators: The case of market orientation. International Journal of
Research in Marketing, 15, 349–366.
Ogbonna, E., & Harris, C. L. (2002). The performance implications of
management fads and fashions: An empirical study. Journal of Strategic
Management, 10, 47–68.
Pearce, J. A. I., Robbins, D. K., & Robinson Jr., R. B. (1987). The impact
of grand strategy and planning formality on financial peformance.
Strategic Management Journal, 8, 125–134.
Pelham, A. M. (1997a). Market orientation and performance: The
moderating effects of product and customer differentiation. Journal of
Business and Industrial Marketing, 12(5), 276–296.
Pelham, A. M. (1997b). Mediating influences on the relationship between
market orientation and profitability in small industrial firms. Journal of
Marketing Theory and Practice, 5(2), 1–23.
Pelham, A. M. (1999). Influence of environment, strategy, and market
orientation on performance in small manufacturing firms. Journal of
Business Research, 45, 33–46.
Pelham, A. M. (2000, January). Market orientation and other potential
influences on performance in small and medium-sized manufacturing
firms. Journal of Small Business Management, 48–67.
Pelham, A. M., & Wilson, D. T. (1996). A longitudinal study of the impact
of market structure, firm structure, strategy, and market orientation
culture on dimensions of small-firm performance. Journal of the
Academy of Marketing Science, 24(1), 27–43.
Perry, M. L., & Shao, A. T. (2002). Market orientation and incumbent
performance in dynamic markets. European Journal of Marketing,
36(9/10), 1140–1153.
Pitt, L., Caruana, A., & Berthon, P. R. (1996). Market orientation and
business performance: Some European evidence. International Market-
ing Review, 13(1), 5–18.
Prasad, V. K., Ranamurthy, K., & Naidu, G. M. (2001). The influence of
internet-marketing integration on marketing competences and export
performance. Journal of International Marketing, 9(4), 82–110.
Puledran, S., Speed, R., & Widing II, R. E. (2000). The antecedents and
consequences of market orientation in Australia. Australian Journal of
Management, 25(2), 119–143.
Puledran, S., Speed, R., & Widing II, R. E. (2003). Marketing planning,
market orientation and business performance. European Journal of
Marketing, 37(3/4), 476–497.
Qu, R., & Ennew, C. T. (2003). An examination of the consequences
of market orientation in China. Journal of Strategic Marketing, 11,
201–214.
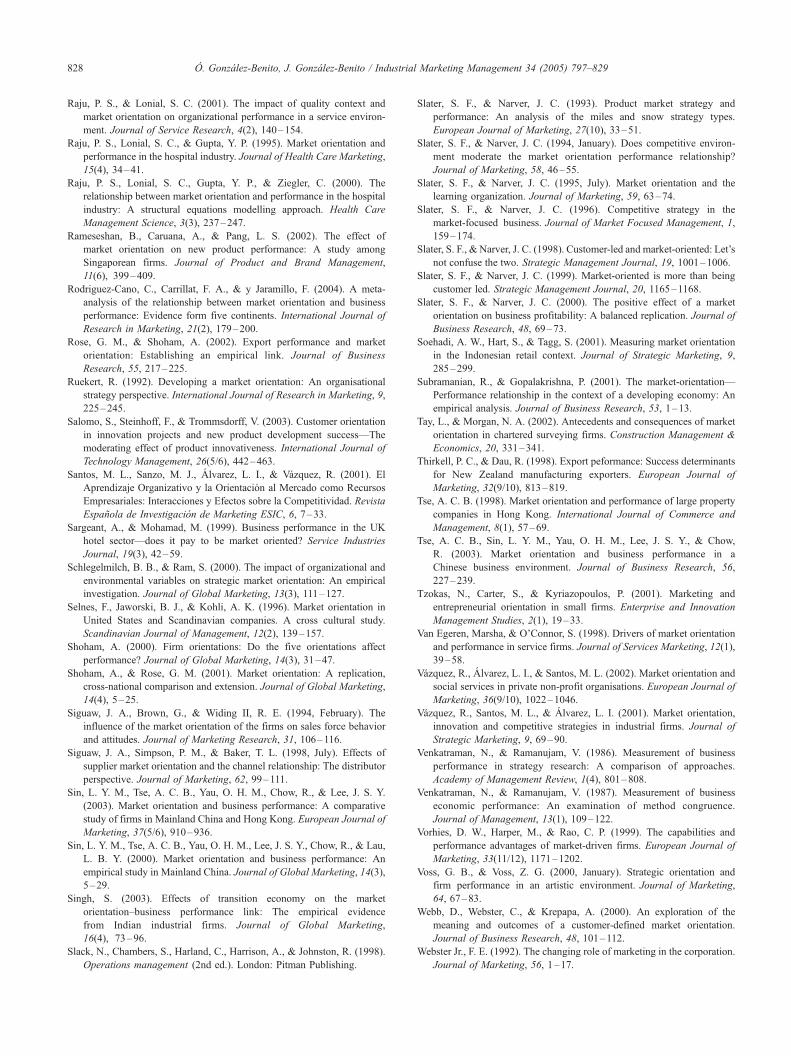
O. Gonzalez-Benito, J. Gonzalez-Benito / Industrial Marketing Management 34 (2005) 797–829828
Raju, P. S., & Lonial, S. C. (2001). The impact of quality context and
market orientation on organizational performance in a service environ-
ment. Journal of Service Research, 4(2), 140–154.
Raju, P. S., Lonial, S. C., & Gupta, Y. P. (1995). Market orientation and
performance in the hospital industry. Journal of Health Care Marketing,
15(4), 34–41.
Raju, P. S., Lonial, S. C., Gupta, Y. P., & Ziegler, C. (2000). The
relationship between market orientation and performance in the hospital
industry: A structural equations modelling approach. Health Care
Management Science, 3(3), 237–247.
Rameseshan, B., Caruana, A., & Pang, L. S. (2002). The effect of
market orientation on new product performance: A study among
Singaporean firms. Journal of Product and Brand Management,
11(6), 399–409.
Rodriguez-Cano, C., Carrillat, F. A., & y Jaramillo, F. (2004). A meta-
analysis of the relationship between market orientation and business
performance: Evidence form five continents. International Journal of
Research in Marketing, 21(2), 179–200.
Rose, G. M., & Shoham, A. (2002). Export performance and market
orientation: Establishing an empirical link. Journal of Business
Research, 55, 217–225.
Ruekert, R. (1992). Developing a market orientation: An organisational
strategy perspective. International Journal of Research in Marketing, 9,
225–245.
Salomo, S., Steinhoff, F., & Trommsdorff, V. (2003). Customer orientation
in innovation projects and new product development success—The
moderating effect of product innovativeness. International Journal of
Technology Management, 26(5/6), 442–463.
Santos, M. L., Sanzo, M. J., Alvarez, L. I., & Vazquez, R. (2001). El
Aprendizaje Organizativo y la Orientacion al Mercado como Recursos
Empresariales: Interacciones y Efectos sobre la Competitividad. Revista
Espanola de Investigacion de Marketing ESIC, 6, 7–33.
Sargeant, A., & Mohamad, M. (1999). Business performance in the UK
hotel sector—does it pay to be market oriented? Service Industries
Journal, 19(3), 42–59.
Schlegelmilch, B. B., & Ram, S. (2000). The impact of organizational and
environmental variables on strategic market orientation: An empirical
investigation. Journal of Global Marketing, 13(3), 111–127.
Selnes, F., Jaworski, B. J., & Kohli, A. K. (1996). Market orientation in
United States and Scandinavian companies. A cross cultural study.
Scandinavian Journal of Management, 12(2), 139–157.
Shoham, A. (2000). Firm orientations: Do the five orientations affect
performance? Journal of Global Marketing, 14(3), 31–47.
Shoham, A., & Rose, G. M. (2001). Market orientation: A replication,
cross-national comparison and extension. Journal of Global Marketing,
14(4), 5–25.
Siguaw, J. A., Brown, G., & Widing II, R. E. (1994, February). The
influence of the market orientation of the firms on sales force behavior
and attitudes. Journal of Marketing Research, 31, 106–116.
Siguaw, J. A., Simpson, P. M., & Baker, T. L. (1998, July). Effects of
supplier market orientation and the channel relationship: The distributor
perspective. Journal of Marketing, 62, 99–111.
Sin, L. Y. M., Tse, A. C. B., Yau, O. H. M., Chow, R., & Lee, J. S. Y.
(2003). Market orientation and business performance: A comparative
study of firms in Mainland China and Hong Kong. European Journal of
Marketing, 37(5/6), 910–936.
Sin, L. Y. M., Tse, A. C. B., Yau, O. H. M., Lee, J. S. Y., Chow, R., & Lau,
L. B. Y. (2000). Market orientation and business performance: An
empirical study in Mainland China. Journal of Global Marketing, 14(3),
5–29.
Singh, S. (2003). Effects of transition economy on the market
orientation–business performance link: The empirical evidence
from Indian industrial firms. Journal of Global Marketing,
16(4), 73–96.
Slack, N., Chambers, S., Harland, C., Harrison, A., & Johnston, R. (1998).
Operations management (2nd ed.). London7 Pitman Publishing.
Slater, S. F., & Narver, J. C. (1993). Product market strategy and
performance: An analysis of the miles and snow strategy types.
European Journal of Marketing, 27(10), 33–51.
Slater, S. F., & Narver, J. C. (1994, January). Does competitive environ-
ment moderate the market orientation performance relationship?
Journal of Marketing, 58, 46–55.
Slater, S. F., & Narver, J. C. (1995, July). Market orientation and the
learning organization. Journal of Marketing, 59, 63–74.
Slater, S. F., & Narver, J. C. (1996). Competitive strategy in the
market-focused business. Journal of Market Focused Management, 1,
159–174.
Slater, S. F., & Narver, J. C. (1998). Customer-led and market-oriented: Let’s
not confuse the two. Strategic Management Journal, 19, 1001–1006.
Slater, S. F., & Narver, J. C. (1999). Market-oriented is more than being
customer led. Strategic Management Journal, 20, 1165–1168.
Slater, S. F., & Narver, J. C. (2000). The positive effect of a market
orientation on business profitability: A balanced replication. Journal of
Business Research, 48, 69–73.
Soehadi, A. W., Hart, S., & Tagg, S. (2001). Measuring market orientation
in the Indonesian retail context. Journal of Strategic Marketing, 9,
285–299.
Subramanian, R., & Gopalakrishna, P. (2001). The market-orientation—
Performance relationship in the context of a developing economy: An
empirical analysis. Journal of Business Research, 53, 1–13.
Tay, L., & Morgan, N. A. (2002). Antecedents and consequences of market
orientation in chartered surveying firms. Construction Management &
Economics, 20, 331–341.
Thirkell, P. C., & Dau, R. (1998). Export peformance: Success determinants
for New Zealand manufacturing exporters. European Journal of
Marketing, 32(9/10), 813–819.
Tse, A. C. B. (1998). Market orientation and performance of large property
companies in Hong Kong. International Journal of Commerce and
Management, 8(1), 57–69.
Tse, A. C. B., Sin, L. Y. M., Yau, O. H. M., Lee, J. S. Y., & Chow,
R. (2003). Market orientation and business performance in a
Chinese business environment. Journal of Business Research, 56,
227–239.
Tzokas, N., Carter, S., & Kyriazopoulos, P. (2001). Marketing and
entrepreneurial orientation in small firms. Enterprise and Innovation
Management Studies, 2(1), 19–33.
Van Egeren, Marsha, & O’Connor, S. (1998). Drivers of market orientation
and performance in service firms. Journal of Services Marketing, 12(1),
39–58.
Vazquez, R., Alvarez, L. I., & Santos, M. L. (2002). Market orientation and
social services in private non-profit organisations. European Journal of
Marketing, 36(9/10), 1022–1046.
Vazquez, R., Santos, M. L., & Alvarez, L. I. (2001). Market orientation,
innovation and competitive strategies in industrial firms. Journal of
Strategic Marketing, 9, 69–90.
Venkatraman, N., & Ramanujam, V. (1986). Measurement of business
performance in strategy research: A comparison of approaches.
Academy of Management Review, 1(4), 801–808.
Venkatraman, N., & Ramanujam, V. (1987). Measurement of business
economic performance: An examination of method congruence.
Journal of Management, 13(1), 109–122.
Vorhies, D. W., Harper, M., & Rao, C. P. (1999). The capabilities and
performance advantages of market-driven firms. European Journal of
Marketing, 33(11/12), 1171–1202.
Voss, G. B., & Voss, Z. G. (2000, January). Strategic orientation and
firm performance in an artistic environment. Journal of Marketing,
64, 67–83.
Webb, D., Webster, C., & Krepapa, A. (2000). An exploration of the
meaning and outcomes of a customer-defined market orientation.
Journal of Business Research, 48, 101–112.
Webster Jr., F. E. (1992). The changing role of marketing in the corporation.
Journal of Marketing, 56, 1–17.
O. Gonzalez-Benito, J. Gonzalez-Benito / Industrial Marketing Management 34 (2005) 797–829 829
Wood, V. R., Bhuian, S., & Kiecker, P. (2000). Market orientation and
organizational peformance in not-for-profit hospitals. Journal of Busi-
ness Research, 48, 213–226.
Wren, B. M., Souder, Wm. E., & Berkowitz, D. (2000). Market orientation
and new product development in global industrial firms. Industrial
Marketing Management, 29, 601–611.
Yau, O. H. M., McFetridge, P. R., Chow, R. P. M., Lee, J. S. Y., Sin, L. Y.
M., & Tse, A. C. B. (2000). Is relationship marketing for everyone?
European Journal of Marketing, 34(9/10), 1111–1127.
Dr. O. Gonzalez-Benito has a degree in Mathematics from the Universidad
de Salamanca (1995), a MSc degree in Marketing at UMIST (UK) (1997),
and a PhD degree in Economics and Management Sciences from the
Universidad de Salamanca (1999). He is currently Assistant Professor of
Marketing at the University of Salamanca. In addition to several published
papers in some of the most recognised Spanish marketing and management
academic journals, he has published articles in international journals such as
Journal of Retailing, Journal of Business Research, Industrial Marketing
Management, International Journal of Market Research, British Journal of
Management, OMEGA, or Small Business Economics.
Dr. J. Gonzalez-Benito has a degree in Mathematics (1995) and a PhD in
Economics and Management Sciences (1999) from the Universidad de
Salamanca, where he joined as an Assistant Professor of Management after
taking the MPhil degree in Management Studies of the University of
Cambridge (UK) (1997) and the MSc degree in Operations Management of
UMIST (UK) (1998). He has published articles in journals such as:
International Journal of Production Economics, International Journal of
Operations and Production Management, International Journal of Produc-
tion Research, OMEGA, British Journal of Management, Industrial
Marketing Management, International Journal of Market Research, Euro-
pean Journal of Purchasing and Supply Management, and Management
Decision.