1-s2.0-s0921883108603738-main.pdf
TRANSCRIPT

Advanced Powder Technol., Vol. 18, No. 4, pp. 441–453 (2007)© VSP and Society of Powder Technology, Japan 2007.Also available online - www.brill.nl/apt
Original paper
Cell optimization for fast contact detection in the discreteelement method algorithm
HIROSHI MIO 1,2,∗, ATSUKO SHIMOSAKA 3, YOSHIYUKI SHIRAKAWA3
and JUSUKE HIDAKA 3
1 Kyoto Fine Particle Technology, Keihanna Interaction Plaza Inc., 1-7 Hikaridai, Seika-cho,Soraku-gun, Kyoto 619-0237, Japan
2 Research Center for Advanced Science and Technology and3 Department of Chemical Engineering and Materials Science, Doshisha University,
1-3 Tatara-miyakodani, Kyotanabe, Kyoto 610-0321, Japan
Received 29 August 2006; accepted 20 November 2006
Abstract—The objective of this paper is to find out a rule of cell optimization for fast contact detectionin the discrete element method (DEM) algorithm. The contact detection process was executed byusing the conventional cell model or distinct cell model (DCM) under several particle conditionshaving different particle size ratio and volume ratio, and its time was measured. The conventionalcell model is suitable for the conditions that particle size ratio, dlarge/dsmall, is small and its volumeratio, Vsmall/V0, is also small. The optimum cell condition of the conventional cell model is that themean number of particle in a cell is 1.0–5.0, regardless of the particle size ratio and its volume ratio.Contact detection using DCM, which has several grids for different sized particles, is much faster thanthat of the conventional model when particles have a large size ratio. The size of the larger cell doesnot affect the contact detection speed; however, the size of the smaller cell is important for the fastcontact detection and its size is determined to be about 3.0 times the particle radius. Therefore, theoptimum cell condition is estimated from the particle size ratio and its volume ratio, and a large-scaleDEM will be possible.
Keywords: DEM; fast contact detection; cell optimization; speed-up; large-scale computing
NOMENCLATURE
C cell number (–)
c cell size (mm)
d particle diameter (mm)
G grid number (–)
∗To whom correspondence should be addressed. E-mail: [email protected]
442 H. Mio et al.
n number of particles (–)
na number of cell array (–)
nc number of cells (–)
nP mean number of particles in a cell (–)
r particle radius (mm)
tc,1M contact detection time per one million particles (s)
tcr relative contact detection time (–)
U position (mm)
V volume of particles (m3)
1. INTRODUCTION
The DEM [1] is one of the most popular and reliable simulation methods for thenumerical analysis of solid particle behavior, and many research projects on powderprocessing have been carried out over the past decade [2–8]. The demand forDEMwork is increasing with the rapid development of workstations and large-scalecomputing is expected. DEM consists of an idea of determining the kinematic forceto each finite-sized particle at every discrete time step, thus the calculation timeincreases with increasing the number of particles and total time steps. Althoughseveral ideas for speeding up DEM [9–12] and some large-scale analyses have beenreported recently [13–15], there are still some important issues on DEM work inpowder processing, i.e. the effect of particle size distribution and scale-up. Mostof the calculation load in DEM is that of the contact detection process [16] and theauthors proposed two methods for fast contact detection: one was the theoreticaloptimum cell size using a conventional cell model [16] and the other was the DCM,which had several grids for different sized particles [17]. The former report saidthat this optimization method was suitable for mono-sized particles or those havinga small size distribution. The latter said that the speed-up of contact detection waspossible by using DCM when particles had a large size ratio. However, it is difficultto introduce the proper cell model, because the optimum cell model for arbitraryconditions (size ratio or volume ratio) is still unclear.In this paper, the contact detection time was measured by using the conventional
cell model or DCM to find out a rule of cell optimization for fast contact detection.Large and small particles were mixed, and the particle size ratio and volume ratiowere changed to investigate the effects of particle conditions.
2. DEM
The DEM consists of an idea of determining the kinematic force to each finite-sizedparticle. The main calculation flow of the DEM consists three steps, i.e. (i) contact

Cell optimization for fast contact detection 443
detection, (ii) calculation of force and (iii) update trajectories. The contact detectionprocess has the heaviest calculation load in the DEM [16]. There are n(n − 1)/2particle pairs in n particles and it is insignificant to check contacts for all particlepairs. Thus, the cell method [18] is used for contact detection to avoid checkingcontacts of insignificant pairs.
2.1. Contact detection using the conventional cell model
A grid of cubes is introduced and all particles are boxed in the proper cell. Eachparticle should be checked for contacts with particles in neighboring cells (from Ck,l
to Ck,m; k = x, y, z), as described in Fig. 1. Ck,l and Ck,m are cell numbers, andthey satisfy the following equations:
Uk,i − (ri + rmax)
c∈ Ck,l, (1)
Uk,i + (ri + rmax)
c∈ Ck,m, (2)
where Uk,i , ri and rmax are the position, the radius of ith particle and the maximumradius in all particles, respectively, and c denotes cell size. The particles arenumbered in order of decreasing size because the contact detection process becomesmore efficient.
Figure 1. Two-dimensional schematic diagram of the conventional cell model.

444 H. Mio et al.
2.2. Contact detection using the DCM
The DCM has several grids for contact detection to improve its efficiency whenparticles have a large size ratio [17]. The different sized grids are installed andoverlapped three-dimensionally, i.e. the optimum cell size for each size of particlescan be used. Figure 2 shows a two-dimensional schematic diagram of the DCMwhen two grids are introduced. The grids are numbered in order of decreasing sizes(G1: large grid, G2: small grid). Each particle is boxed in a proper cell, i.e. largeparticles are in G1, and small particles are in G2. The particles are also numberedin order of decreasing diameter. The contact detection process proceeds as follows.
Step 1 The contact detection between large particles is executed by using G1
(Fig. 3a).
Step 2 The small particles, which contact to large ones, are searched in G1
(Fig. 3b).
Step 3 The contact detection between small particles is carried out using G2
(Fig. 3c).
The contact detection process has three steps, when two grids are introduced.
Figure 2. Two-dimensional schematic diagram of the DCM.

Cell optimization for fast contact detection 445
(a)
(b)
Figure 3. Two-dimensional schematic diagram of contact detection process using the DCM. (a) Step1: contact detection between large particles. (b) Step 2: contact detection between a large particle anda small particle.

446 H. Mio et al.
(c)
Figure 3. (c) Step 3: contact detection between small particles.
3. SIMULATION
Small and large particles of 1.2–12.0 mm in diameter were packed randomly in acontainer by changing its size ratio and volume ratio. The size ratio, dlarge/dsmall,was changed from 2.0 to 10.0 and its volume ratio, Vsmall/V0(V0 = Vsmall + Vlarge),was changed from 0.001 to 0.667. The number of particles, n, for each conditionwas around 100 000. Table 1 shows an example of the detailed simulation conditionsof the number of particles for the case of dlarge/dsmall = 4.0. The contactdetection process was executed using the conventional cell model or the DCM ina workstation (PowerPC 970 1.6 GHz, 2.0 Gbyte of RAM and IBM XL Fortranversion 9.1), and the time was measured. The cell size was also changed in eachcondition to determine the fastest condition of cell size and the contact detectiontime for each condition was converted into the case of 1 million particles to avoidthe effect of number of particles on the time.
4. RESULTS AND DISCUSSION
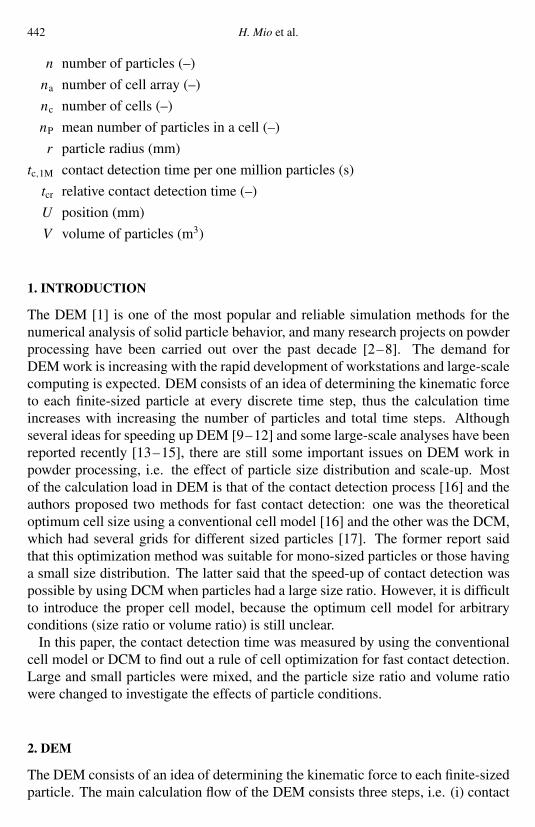
Figure 4 shows the relation between the contact detection time per 1 millionparticles, tc,1M, and the mean number of particles in a cell, np (=n/nc; nc is thetotal number of cells), with a parameter of the contact detection model under the
Cell optimization for fast contact detection 447
Table 1.Simulation condition of particles (d large/dsmall = 4.0)
nlarge nsmall nsmall/(nlarge + nsmall) Vsmall/V0
78722 19680 0.200 0.00463756 31878 0.333 0.00852129 52129 0.500 0.01536057 72114 0.667 0.03019168 76672 0.800 0.05910967 87738 0.889 0.1116425 102806 0.941 0.2001694 108428 0.985 0.500
Figure 4. Relation between contact detection time per 1 million particles and mean number ofparticles in a cell (d large/dsmall = 4.0, V small/V0 = 0.059).
conditions of dlarge/dsmall = 4.0 and Vsmall/V0 = 0.059. tc,1M give the minimumvalue at a certain condition of cell size due to the calculation load balance ofcell searching and contact checking [16]. tc,1M for each particle condition wasdetermined to be the fastest time as shown in Fig. 4. Figure 5 shows the relationbetween the number of cell array, na, and np for two cell models. na decreases withincreasing cell size and it is found that the memory usage of a cell is nearly the sameunder both models. The number of cells used in the DCM is larger than that of theconventional model; however, a lot of small particles would be boxed in a cell whenthe conventional cell model are used for the particles having a large size ratio. Thus,

448 H. Mio et al.
Figure 5. Relation between number of cell array and mean number of particles in a cell(d large/dsmall = 4.0, V small/V0 = 0.059).
the large size of array for storing particle numbers in a cell should be used. On theother hand, a cell has a couple of particles in the case of the DCM because this modelhas an advantage of being able to use the optimum cell size for all particles and theDCM needs not have large size of array for storing particle numbers. Therefore,the total usage of memory is similar between them. Figure 6 shows the relationbetween tc,1M and the volume ratio, Vsmall/V0, for two contact detection methodswhen the particle size ratio was 4.0. tc,1M increased with increasing Vsmall/V0 whenthe conventional cell model was used, i.e. the contact detection process becomesinefficient with increasing number of small particles. On the other hand, tc,1M for theDCM was independent of the volume ratio because the number of cell searches andcontact check could be minimized [17]. Thus, the contact detection process shoulduse the DCM when Vsmall/V0 is larger than 0.059. Figure 7 shows the relationbetween the speed-up of contact detection, tconventional/tDCM, and Vsmall/V0 with aparameter of particle size ratio. The speed-up increases with increasing the volumeratio of small particles, especially for cases having a large particle size ratio. It isfound that the DCM should be used for the contact detection when the particles havea large size ratio and the volume ratio of small particles is large. People might notethe number ratio between small and large particles when they calculate; however,most measured particle size distribution (e.g. sieving) are given by volume ratio (ormass ratio). Thus, the volume ratio was introduced in Figs 6 and 7, and the relationbetween the speed-up and number ratio will also be obtained by Figs 6 and 7. The

Cell optimization for fast contact detection 449
Figure 6. Relation between contact detection time per 1 million particles and volume ratio(d large/dsmall = 4.0).
Figure 7. Relation between speed-up of contact detection and volume ratio with a parameter ofparticle size ratio.
450 H. Mio et al.
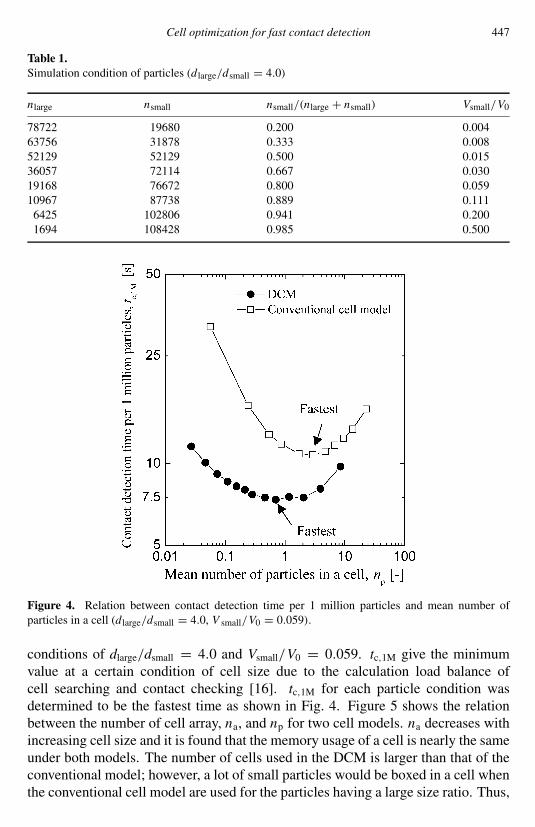
Figure 8. Relation between volume ratio and size ratio for cell optimization.
speed-up of the contact detection process using the DCM in arbitrary condition, canbe easily estimated from Fig. 7. The dashed line in Fig. 7 is tconventional/tDCM = 1.3,and Fig. 8 shows the relation between Vsmall/V0 and dlarge/dsmall with a parameterof tconventional/tDCM. It is easy to understand from Fig. 8 that contact detection underevery particle condition can be optimized by using a proper cell model and it isapplicable to the condition having a large particle size distribution.Figure 9 shows the relation between the relative contact detection time, tcr, and
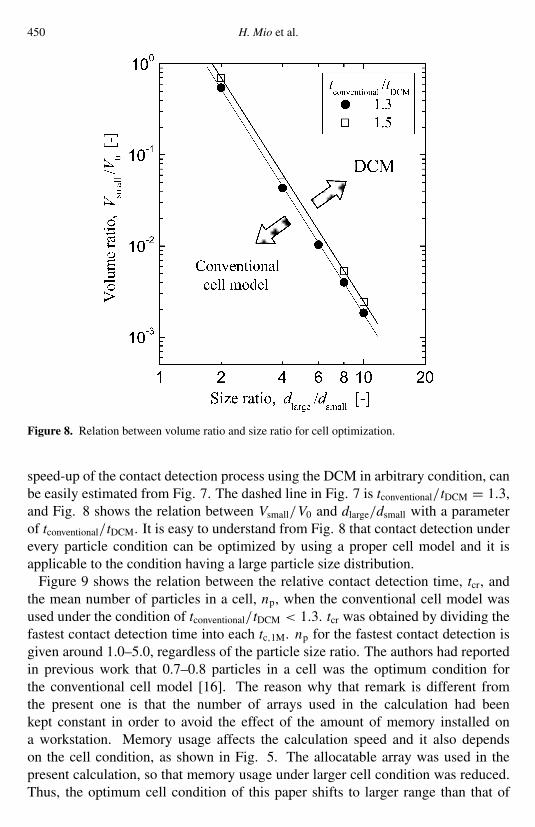
the mean number of particles in a cell, np, when the conventional cell model wasused under the condition of tconventional/tDCM < 1.3. tcr was obtained by dividing thefastest contact detection time into each tc,1M. np for the fastest contact detection isgiven around 1.0–5.0, regardless of the particle size ratio. The authors had reportedin previous work that 0.7–0.8 particles in a cell was the optimum condition forthe conventional cell model [16]. The reason why that remark is different fromthe present one is that the number of arrays used in the calculation had beenkept constant in order to avoid the effect of the amount of memory installed ona workstation. Memory usage affects the calculation speed and it also dependson the cell condition, as shown in Fig. 5. The allocatable array was used in thepresent calculation, so that memory usage under larger cell condition was reduced.Thus, the optimum cell condition of this paper shifts to larger range than that of
Cell optimization for fast contact detection 451
Figure 9. Relation between relative contact detection time and mean number of particles in a cellwhen the conventional cell model was used.
the previous paper and it can be concluded that the optimum cell size using theconventional cell model is a size in which a cell has about 1.0–5.0 particles.Figure 10 shows the relation between the relative contact detection time, tcr, and
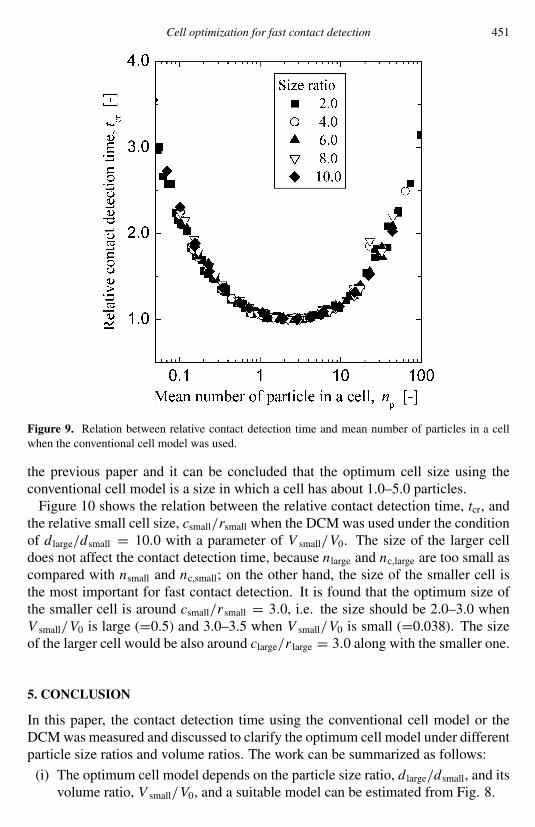
the relative small cell size, csmall/rsmall when the DCMwas used under the conditionof d large/dsmall = 10.0 with a parameter of V small/V0. The size of the larger celldoes not affect the contact detection time, because nlarge and nc,large are too small ascompared with nsmall and nc,small; on the other hand, the size of the smaller cell isthe most important for fast contact detection. It is found that the optimum size ofthe smaller cell is around csmall/rsmall = 3.0, i.e. the size should be 2.0–3.0 whenV small/V0 is large (=0.5) and 3.0–3.5 when V small/V0 is small (=0.038). The sizeof the larger cell would be also around clarge/r large = 3.0 along with the smaller one.
5. CONCLUSION
In this paper, the contact detection time using the conventional cell model or theDCMwas measured and discussed to clarify the optimum cell model under differentparticle size ratios and volume ratios. The work can be summarized as follows:
(i) The optimum cell model depends on the particle size ratio, d large/dsmall, and itsvolume ratio, V small/V0, and a suitable model can be estimated from Fig. 8.

452 H. Mio et al.
Figure 10. Relation between relative contact detection time and relative small cell size when theDCM was used (d large/dsmall = 10.0).
(ii) The optimum cell conditions of the conventional cell model is that the meannumber of particles in a cell is 1.0–5.0, regardless of the particle size ratio andits volume ratio.
(iii) The size of the larger cell does not affect the contact detection speed when theDCM is used; however, the size of the smaller cell is important for fast contactdetection. Its size is determined to be 3.0 times the particle radius.
(iv) This rule of cell optimization is applicable to the condition having a largeparticle size distribution and a large-scale DEM will be possible.
Acknowledgments
The authors are grateful to JST (Japan Science and Technology Agency) forfinancial support to this project; Kyoto Prefecture Collaboration of Regional Entitiesfor the Advancement of Technological Excellence.
REFERENCES
1. P. A. Cundall and O. D. L. Strack, A discrete numerical model for granular assemblies,Geotechnique 29, 47–65 (1979).

Cell optimization for fast contact detection 453
2. S. Agrawala, R. K. Rajamani, P. Songfack and B. K. Mishra, Mechanics of media motion intumbling mills with 3D discrete element method, Miner. Eng. 10, 215–227 (1997).
3. S. Yuu, T. Umekage and Y. Johno, Numerical simulation of air and particle motions in bubblingfluidized bed of small particles, Powder Technol. 110, 158–168 (2000).
4. J. Hidaka, Y. Sasaki, A. Shimosaka and Y. Shirakawa, Simulation of flow behavior of two-component developer in electro-photographic system, J. Soc. Powder Technol., Japan 37, 672–679 (2000).
5. H. Mio, J. Lee, T. Nakagawa, J. Kano and F. Saito, Estimation of extraction rate of yttrium fromfluorescent powder by ball milling, Mater. Trans. 42, 2460–2464 (2001).
6. H. P. Kuo, P. C. Knight, D. J. Parker, Y. Tsuji, M. J. Adams and J. P. K. Seville, The influence ofDEM simulation parameters on the particle behaviour in a V-mixer, Chem. Eng. Sci. 57, 3621–3638 (2002).
7. N. Nakayama and H. Kawamoto, Numerical simulation of magnetic bead chains in a magneticfield using 3-D distinct element method, Nihon Kikaigakkai Ronbunshu C 70, 196–203 (2004).
8. T. Nouchi, T. Sato, M. Sato, K. Takeda and T. Ariyama, Stress field and solid flow analysis ofcoke packed bed in blast furnace based on DEM, ISIJ Int. 45, 1426–1431 (2005).
9. T. Iwai, C.-W. Hong and P. Greil, Fast particle pair detection algorithms for particle simulations,Int. J. Mod. Phys. C 10, 823–837 (1999).
10. H. Sigurgeirsson, A. Stuart and W. L. Wan, Algorithms for particle-field simulations withcollisions, J. Comput. Phys. 172, 766–807 (2001).
11. C. Tokoro, K. Okaya and J. Sadaki, Fast algorithm of distinct element method with contact forceprediction method, J. Soc. Powder Technol., Japan 40, 236–245 (2003).
12. B. C. Schäfer, S. F. Quigley and A. H. C. Chan, Acceleration of the discrete element method(DEM) on a reconfigurable co-processor, Comput. Struct. 82, 1707–1718 (2004).
13. M. L. Sawley and P. W. Cleary, A parallel discrete element method for industrial granular flowsimulations, EPFL Supercomp. Rev., 11, 23–29 (1999).
14. A. R. Carrillo, J. E. West, D. A. Horner and J. F. Peters, Interactive large-scale soil modelingusing distributed high performance computing environment, Int. J. High Perform. Comp., 13,33–48 (1999).
15. P. W. Cleary, Large scale industrial DEM modeling, Eng. Comp. 21, 169–204 (2004).16. H. Mio, A. Shimosaka, Y. Shirakawa and J. Hidaka, Optimum cell size for contact detection in
the algorithm of discrete element method, J. Chem. Eng., Japan 38, 969–975 (2005).17. H. Mio, A. Shimosaka, Y. Shirakawa and J. Hidaka, Optimum cell condition for contact detection
having large particle size ratio in discrete element method, J. Chem. Eng., Japan 39, 409–416(2006).
18. B. J. Alder and T. E. Weinwright, Studies in molecular dynamics. I. General method, J. Chem.Phys. 31, 459–466 (1959).