1 sfpuc tidal / wave power feasibility studies panc presentation july 08, 2007 a bit of history......
TRANSCRIPT
1
SFPUC Tidal / Wave Power SFPUC Tidal / Wave Power Feasibility StudiesFeasibility StudiesPANC PresentationPANC PresentationJuly 08, 2007July 08, 2007
A bit of history... SFPUC In-Stream Tidal Power
Feasibility Study at Golden Gate SFPUC Wave Power Feasibility Study
Ian Austin, PhD, PEVice President, Marine ServicesOutline:
2
Wave power has arrived?Wave power has arrived?
“The possibilities of utilizing the forces of the sea’s waves will soon be manifest”
Adolph Sutro, 1887
3
Wave power has arrived?Wave power has arrived?
A number of wave-power schemes near Cliff House:
1887 Sutro’s catch-basin, a wave overtopping scheme; said that extra head could drive water wheels
1887 Sterns’ wave motor on rocks near Cliff House – possibly a pump storage scheme – ended dramatically with the explosion of a grounded schooner
1891 Henry Holland’s wave motor; pump driven by an iron buoy - another pump storage scheme
4
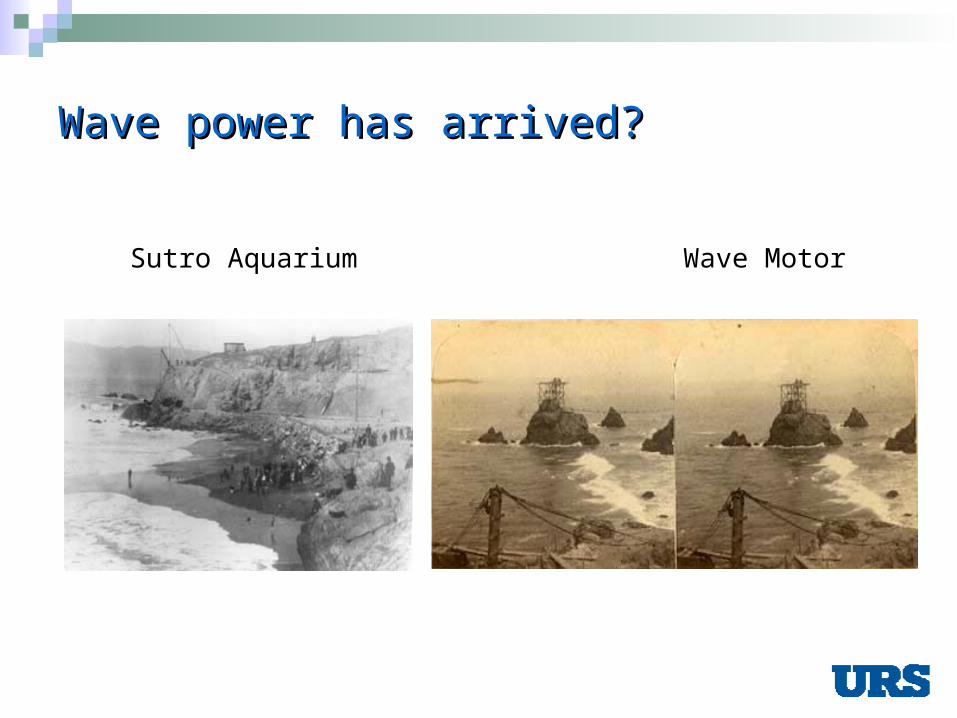
Wave power has arrived?Wave power has arrived?
Sutro Aquarium Wave Motor
5
2007-2008: San Francisco PUC Studies2007-2008: San Francisco PUC Studies San Francisco has goal of generating at
least 10% of annual average power demand from renewables - about 60 MW
In-stream tidal power through the Golden Gate appeared to be a major resource
Wave power outside the Golden Gate is likely to be a much larger resource
6
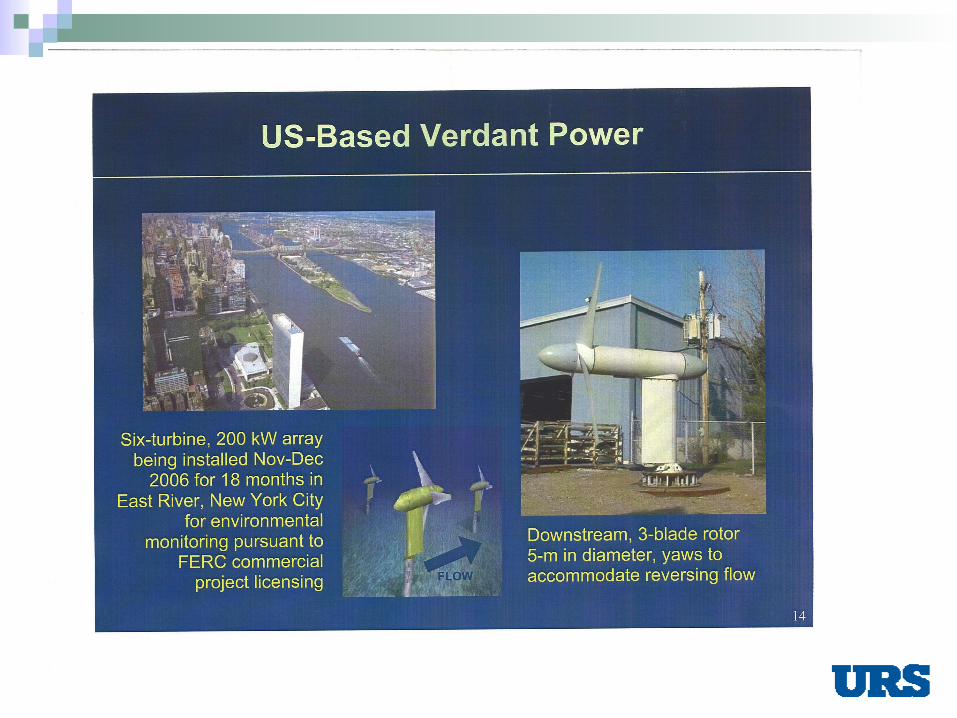
What is In-Stream Tidal Power?What is In-Stream Tidal Power?
A new technology intended to reduce costs and impacts associated with old barrage projects
Emerging technology, only 1 unit installed world-wide rated at more than 1 MW (MCT Strangford Narrows, Ireland)
UK has been technology leader; government subsidies and tidal/wave power test sites in Scotland, Cornwall and Ireland
In-stream tidal energy proportional to velocity cubed:E = 1/2 V3
7
8
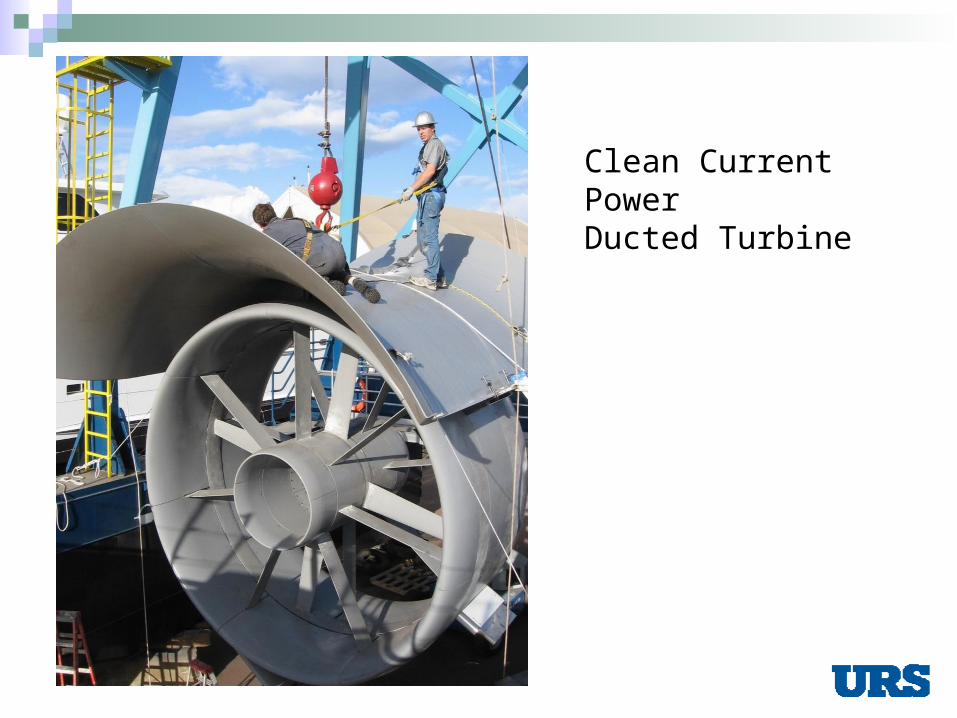
Clean Current Power Ducted Turbine
9
10
11
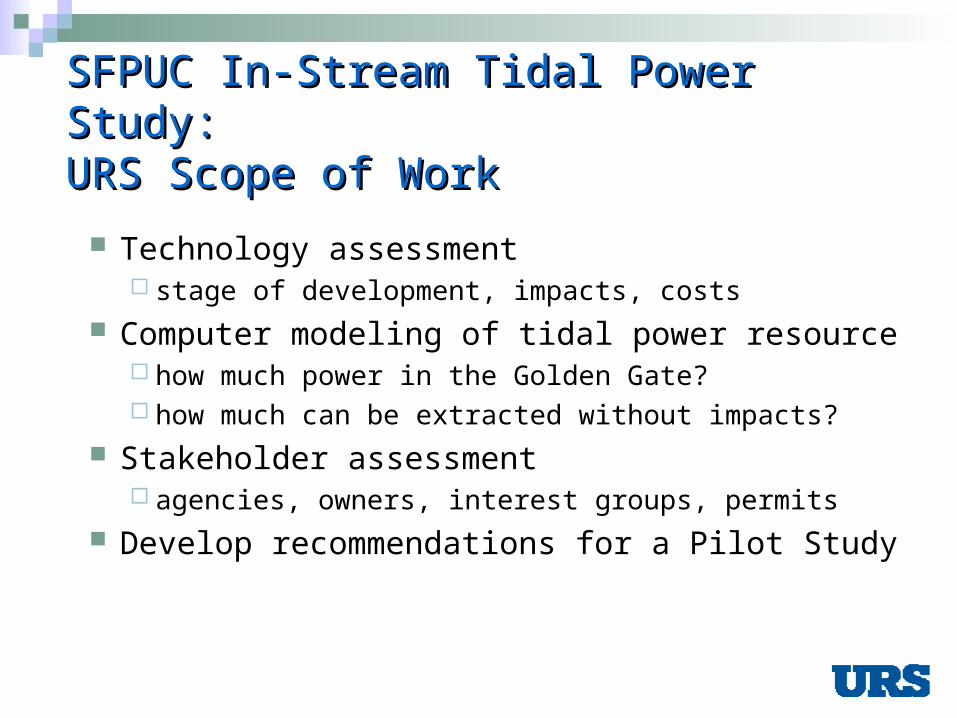
SFPUC In-Stream Tidal Power Study:SFPUC In-Stream Tidal Power Study:URS Scope of WorkURS Scope of Work
Technology assessment stage of development, impacts, costs
Computer modeling of tidal power resource how much power in the Golden Gate? how much can be extracted without impacts?
Stakeholder assessment agencies, owners, interest groups, permits
Develop recommendations for a Pilot Study
12
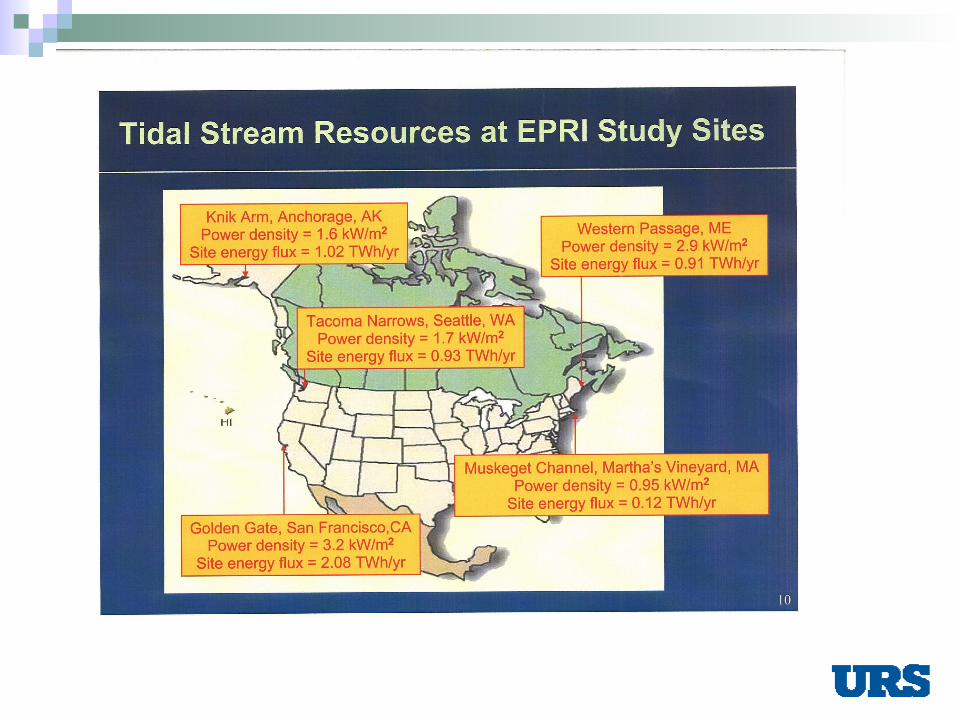
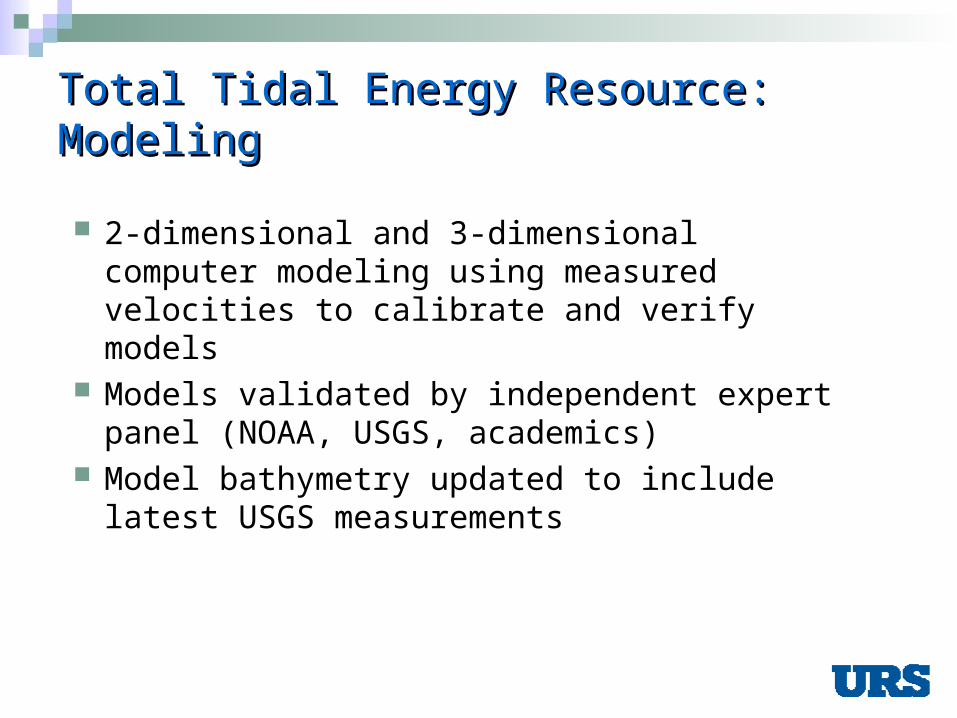
Total Tidal Energy Resource: Modeling Total Tidal Energy Resource: Modeling
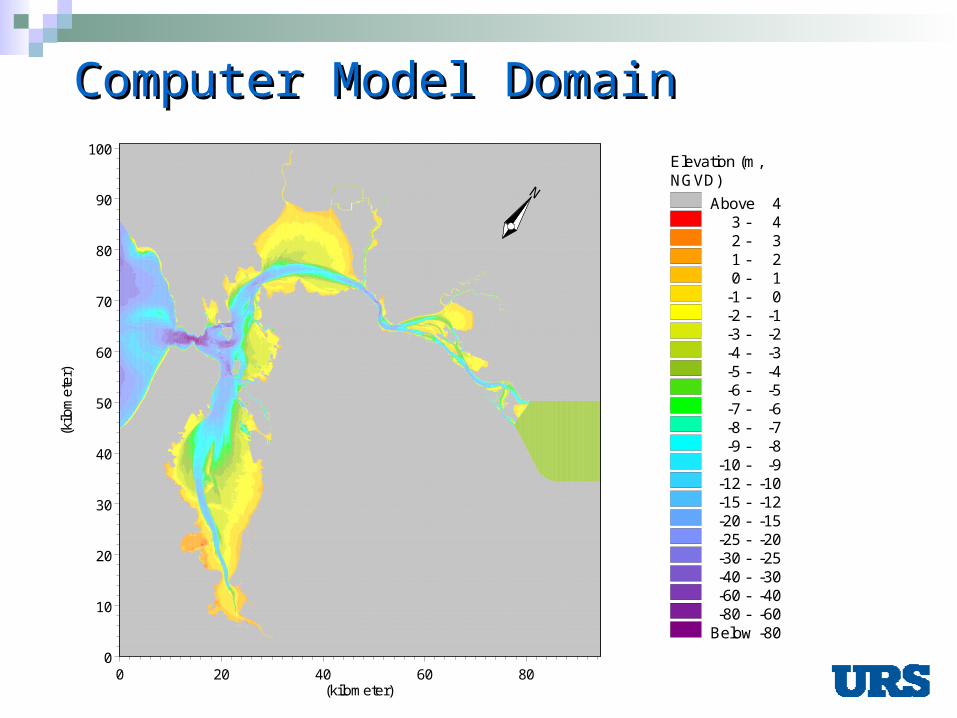
2-dimensional and 3-dimensional computer modeling using measured velocities to calibrate and verify models
Models validated by independent expert panel (NOAA, USGS, academics)
Model bathymetry updated to include latest USGS measurements
13
Computer Model DomainComputer Model Domain
N
Elevation (m,NGVD)
Above 43 - 42 - 31 - 20 - 1
-1 - 0-2 - -1-3 - -2-4 - -3-5 - -4-6 - -5-7 - -6-8 - -7-9 - -8
-10 - -9-12 - -10-15 - -12-20 - -15-25 - -20-30 - -25-40 - -30-60 - -40-80 - -60
Below -80
0 20 40 60 80(kilometer)
0
10
20
30
40
50
60
70
80
90
100
(kilo
met
er)
Elevation (m,NGVD)
Above 43 - 42 - 31 - 20 - 1
-1 - 0-2 - -1-3 - -2-4 - -3-5 - -4-6 - -5-7 - -6-8 - -7-9 - -8
-10 - -9-12 - -10-15 - -12-20 - -15-25 - -20-30 - -25-40 - -30-60 - -40-80 - -60
Below -80
0 20 40 60 80(kilometer)
0
10
20
30
40
50
60
70
80
90
100
(kilo
met
er)
14
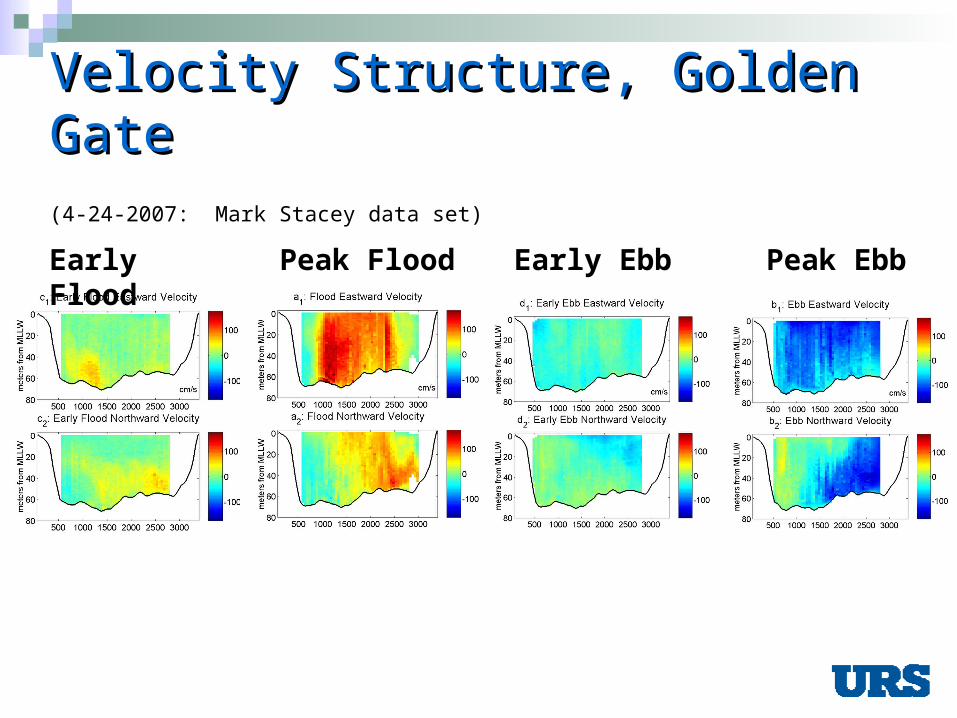
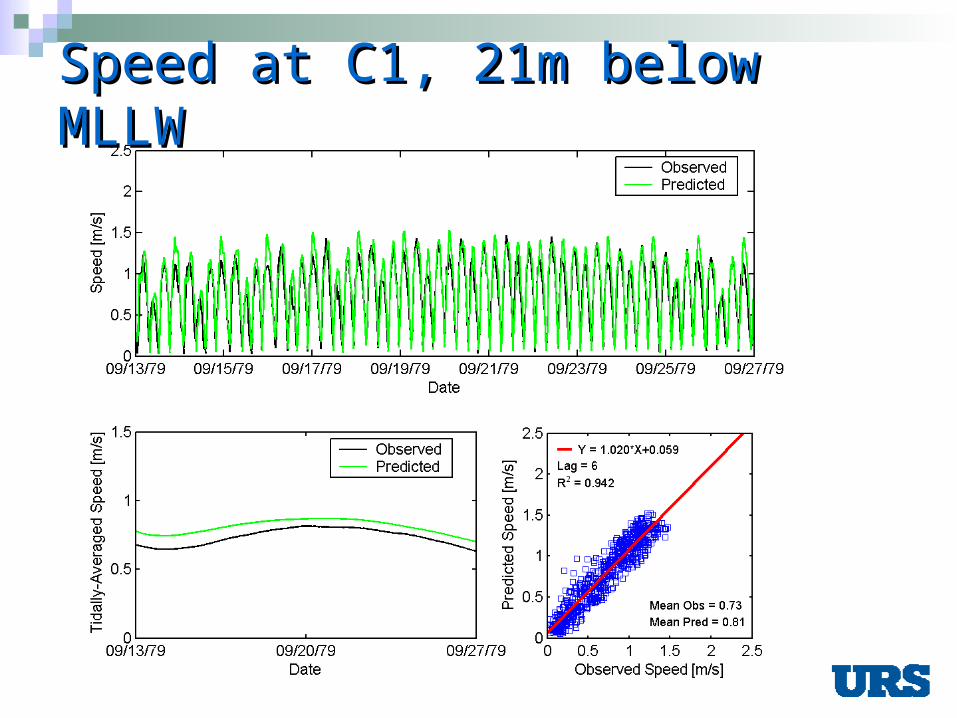
Velocity Structure, Golden GateVelocity Structure, Golden Gate(4-24-2007: Mark Stacey data set)
Early Flood Peak Flood Early Ebb Peak Ebb
15
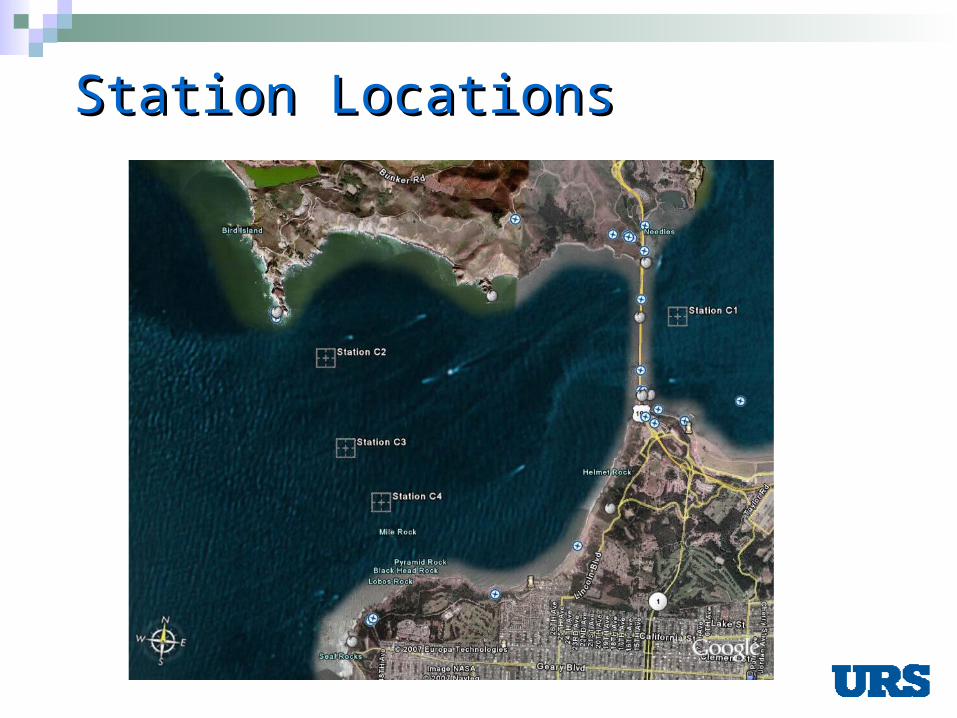
Station LocationsStation Locations
16
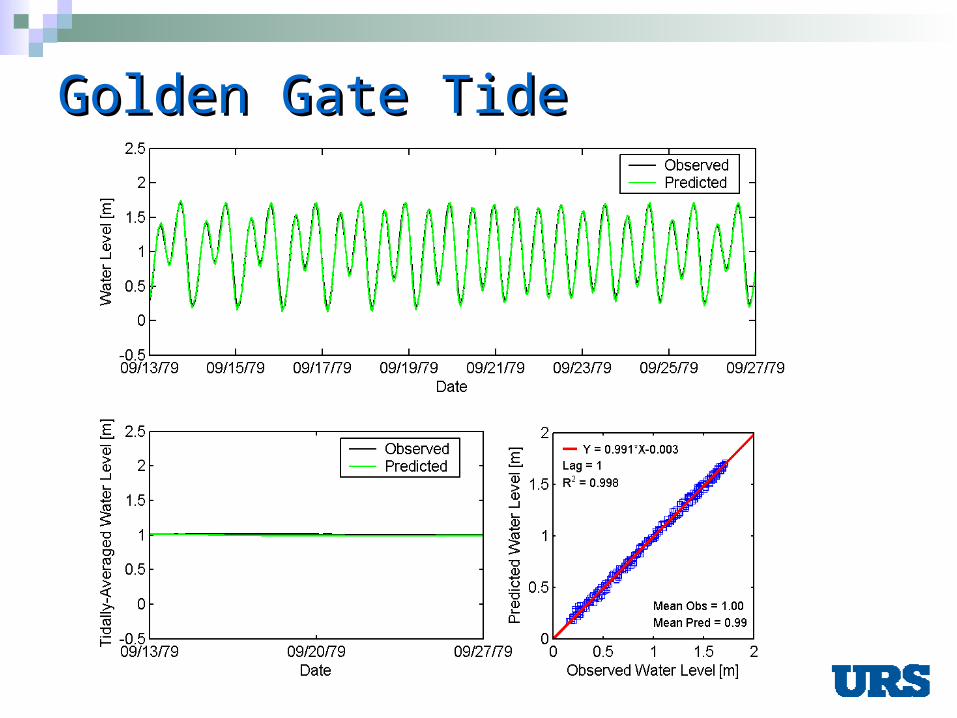
Golden Gate TideGolden Gate Tide
17
Speed at C1, 21m below MLLWSpeed at C1, 21m below MLLW
18
N
Current speed(m/s)
Above 2.22.1 - 2.2
2 - 2.11.9 - 21.8 - 1.91.7 - 1.81.6 - 1.71.5 - 1.61.4 - 1.51.3 - 1.41.2 - 1.31.1 - 1.2
1 - 1.10.9 - 10.8 - 0.90.7 - 0.80.6 - 0.70.5 - 0.60.4 - 0.50.3 - 0.40.2 - 0.30.1 - 0.2
0 - 0.1Below 0
06/11/1980 01:30:00
0 5 10 15(kilometer)
0
2
4
6
8
10
12
14
(kilo
me
ter)
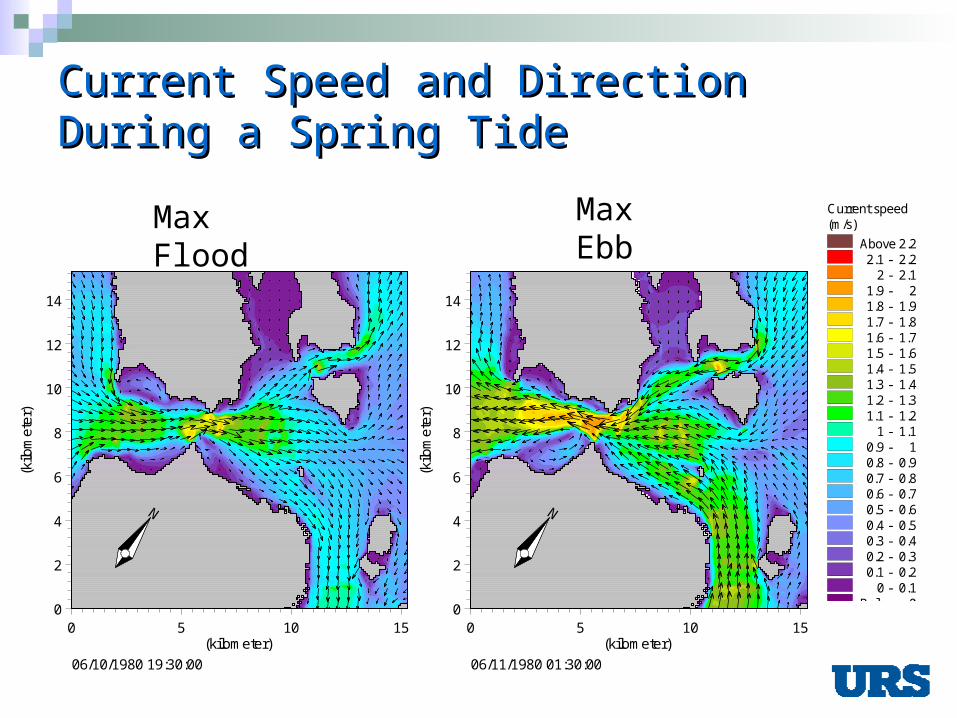
Current Speed and Direction Current Speed and Direction During a Spring TideDuring a Spring Tide
Current speed(m/s)
Above 2.22.1 - 2.2
2 - 2.11.9 - 21.8 - 1.91.7 - 1.81.6 - 1.71.5 - 1.61.4 - 1.51.3 - 1.41.2 - 1.31.1 - 1.2
1 - 1.10.9 - 10.8 - 0.90.7 - 0.80.6 - 0.70.5 - 0.60.4 - 0.50.3 - 0.40.2 - 0.30.1 - 0.2
0 - 0.1Below 0
06/11/1980 01:30:00
0 5 10 15(kilometer)
0
2
4
6
8
10
12
14
(kilo
met
er)
N
Current speed(m/s)
Above 2.22.1 - 2.2
2 - 2.11.9 - 21.8 - 1.91.7 - 1.81.6 - 1.71.5 - 1.61.4 - 1.51.3 - 1.41.2 - 1.31.1 - 1.2
1 - 1.10.9 - 10.8 - 0.90.7 - 0.80.6 - 0.70.5 - 0.60.4 - 0.50.3 - 0.40.2 - 0.30.1 - 0.2
0 - 0.1Below 0
06/10/1980 19:30:00
0 5 10 15(kilometer)
0
2
4
6
8
10
12
14
(kilo
me
ter)
Max Flood Max Ebb
19
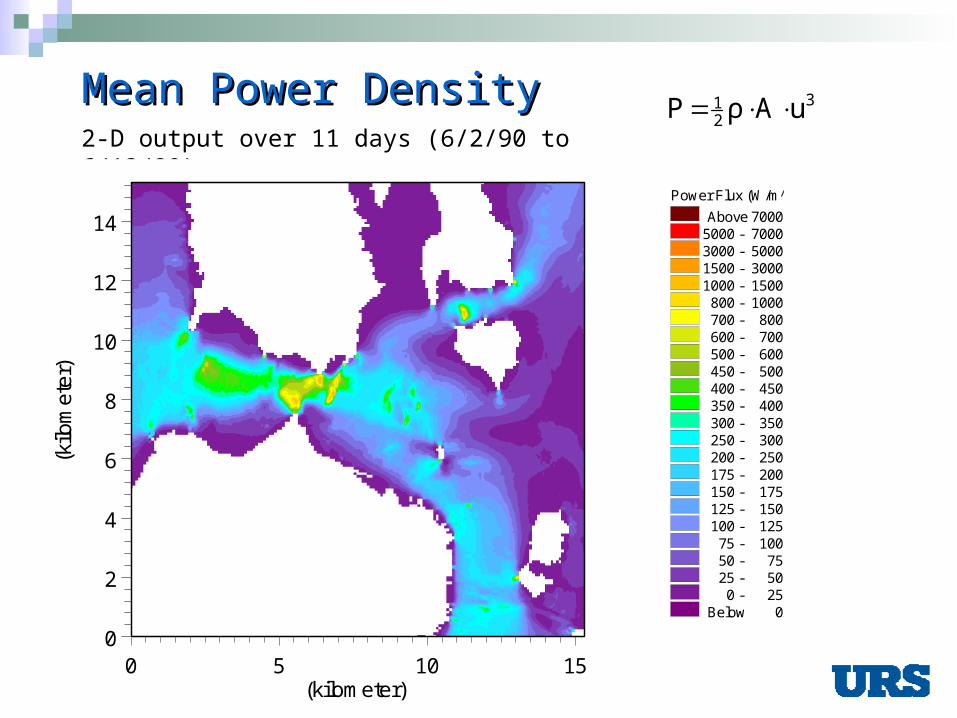
Mean Power DensityMean Power Density 2-D output over 11 days (6/2/90 to 6/13/80)
Power Flux (W/m^2)
Above 70005000 - 70003000 - 50001500 - 30001000 - 1500
800 - 1000700 - 800600 - 700500 - 600450 - 500400 - 450350 - 400300 - 350250 - 300200 - 250175 - 200150 - 175125 - 150100 - 125
75 - 10050 - 7525 - 50
0 - 25Below 0
0 5 10 15(kilometer)
0
2
4
6
8
10
12
14
(kilo
met
er)
Power Flux (W/m^2)
Above 70005000 - 70003000 - 50001500 - 30001000 - 1500800 - 1000700 - 800600 - 700500 - 600450 - 500400 - 450350 - 400300 - 350250 - 300200 - 250175 - 200150 - 175125 - 150100 - 125
75 - 10050 - 7525 - 50
0 - 25Below 0
0 5 10 15(kilometer)
0
2
4
6
8
10
12
14
(kilo
met
er)
321 uAρP
20
3D Model/Flythrough3D Model/FlythroughAnimation Creation Animation Creation (separate file)(separate file)
Collected base data from various sources (including USGS, California Spatial Information Library, NOAA, Furgo, USACE, SFEI)
Draped aerial imagery over elevation data for a realistic representation
Obtained 3D model of the Golden Gate bridge and wind turbines, then scaled and converted to useable format for import to model
Exported animation to an .avi media file
21
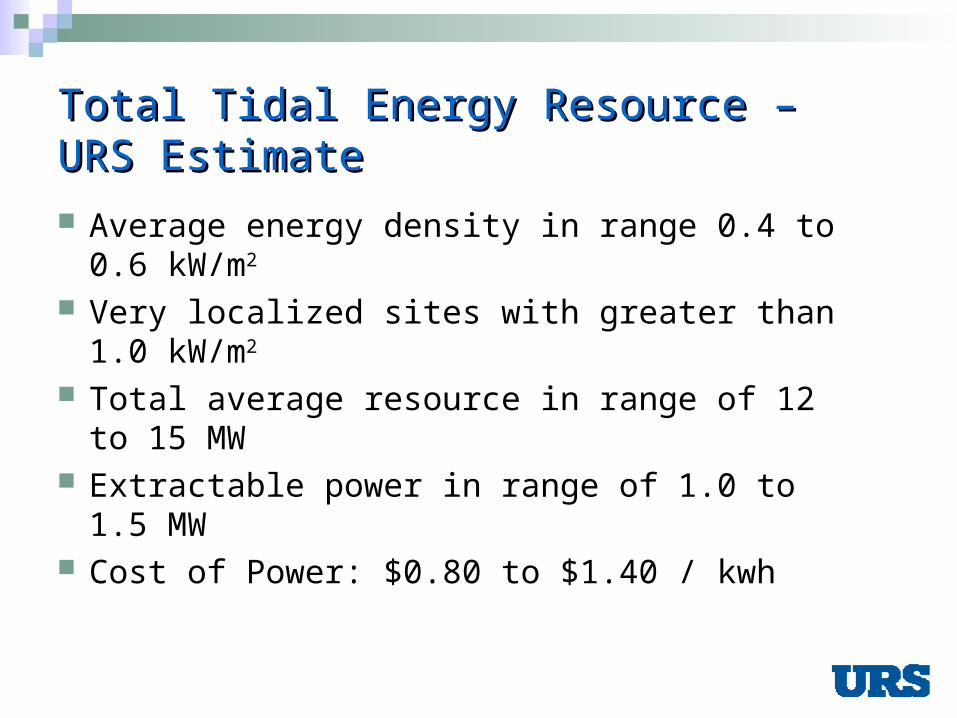
Total Tidal Energy Resource –Total Tidal Energy Resource –URS EstimateURS Estimate
Average energy density in range 0.4 to 0.6 kW/m2
Very localized sites with greater than 1.0 kW/m2
Total average resource in range of 12 to 15 MW
Extractable power in range of 1.0 to 1.5 MW Cost of Power: $0.80 to $1.40 / kwh
22
Wave power has arrived?Wave power has arrived?
SFPUC feasibility study addressing wave energy resource, extraction technologies, permitting
Plan to deploy an ADCP to confirm wave resource later this year
Goal is to identify 1 or more technologies for pilot studies
23
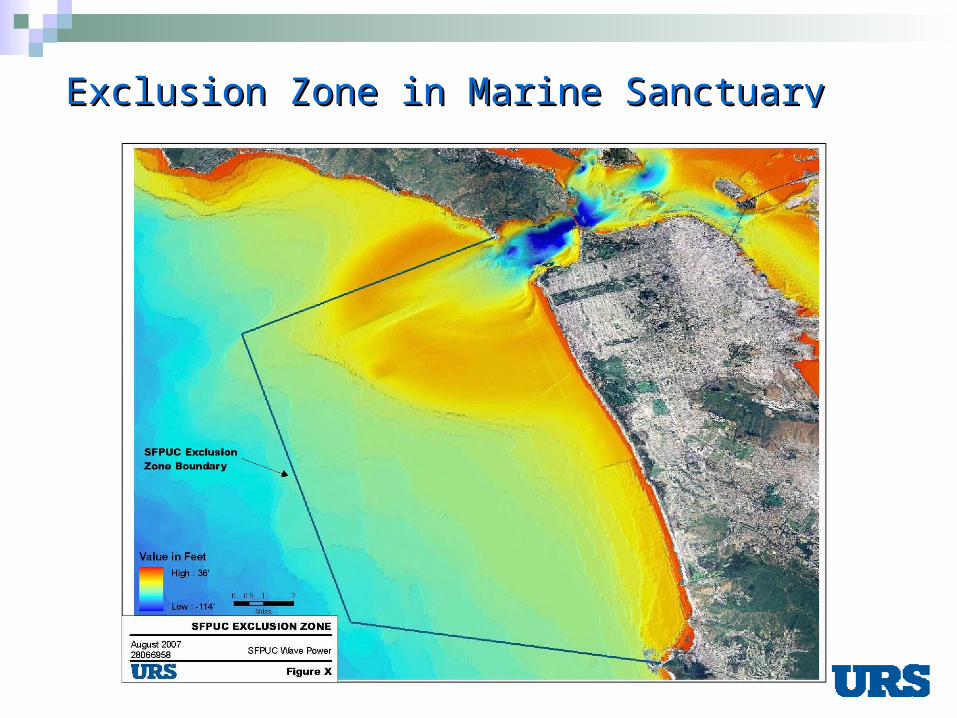
Exclusion Zone in Marine SanctuaryExclusion Zone in Marine Sanctuary
24
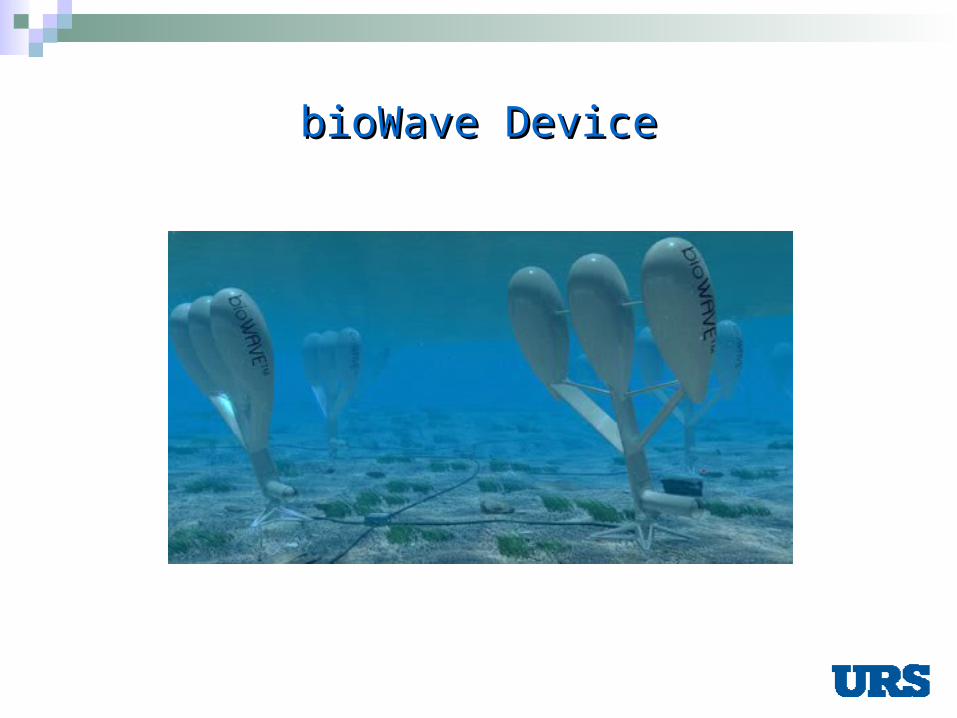
bioWave DevicebioWave Device
25
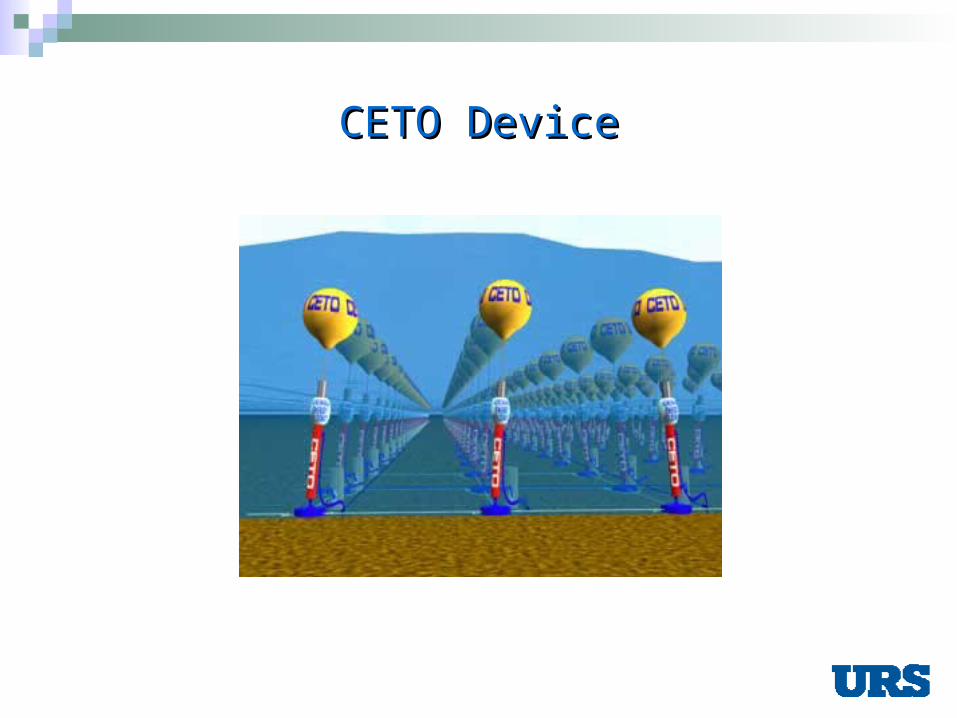
CETO DeviceCETO Device
26
Wave power has arrived?Wave power has arrived?
To be feasible: Costs need to be similar to those for solar power
- order of 25 to 30 cents/kwh Potential environmental impacts
mooring lines can snag whales submerged to minimize aesthetic concerns recreational boating / fishing / ship traffic reduced shoreline waves – less shoreline erosion and
reduced surf
Permitting – FERC / MMS, State & Local