1 simulation of climate change impact on lowland …...mekong river commission 2nd mekong climate...
TRANSCRIPT

Simulation of Climate Change Impact on Lowland Paddy Rice
Production Potential in Savannakhet Province, Laos
1
By Somkhit BOULIDAM

Mekong River Commission2nd Mekong Climate Change Forum
6 – 8 October 2014Siem Reap, Cambodia
Outline
Topic 1: IntroductionTopic 2: Literature ReviewTopic 3: Materials and MethodsTopic 4: Results and DiscussionsTopic 5: Conclusions and recommendations
2

Mekong River Commission2nd Mekong Climate Change Forum
6 – 8 October 2014Siem Reap, Cambodia
Introduction
Background The influence of global climate change on future agriculture
production as well as rice is one of the most significant issues in Asia (Araus et al., 2011).
Agriculture plays a most important role in the economy as well as for farmer’s livelihood in Laos 51 % of GDP and employs 86% of the total labor.
Low land paddy rice production in Laos has been affected by climate variability leading often to lower production
Therefore, it is an important issue to investigate how rice productivity performs in term of impacts of climate change, and to develop guide information for farmer’s adaptation options.
3

Mekong River Commission2nd Mekong Climate Change Forum
6 – 8 October 2014Siem Reap, Cambodia
Introduction Cont’
Objectives 1). To estimate the impacts of climate change to
rice production in a rice growing region of Savannakhet province
2). To explore adaption options of local farmers to climate change
4

Mekong River Commission2nd Mekong Climate Change Forum
6 – 8 October 2014Siem Reap, Cambodia
Introduction Cont’
5

Mekong River Commission2nd Mekong Climate Change Forum
6 – 8 October 2014Siem Reap, Cambodia
II. Literature Review
Countries Tem+1oC, +2oC, and +3oC
1.5 x CO2 2 x CO2 GFDL, GISS, UKMO
India (Main )
Second season
+4% per +1oC
+16% per +1oC
+28.8%
No Effect
+45.2%
No Effect
+8.8 to 40.2%
-18 to +40.2%
China -5.2 to -8.2% per +1oC incr.
--- 34 to 41% -4.5 to +16%
Philippines -4.4 to -10.3%
--- +30% -11.5 to +7.3%
6

Mekong River Commission2nd Mekong Climate Change Forum
6 – 8 October 2014Siem Reap, Cambodia
III. Materials and Methods
7
Study area
Study area: 21,774 km2- Location of study: 16o 33’ N, 104o45’E, altitude of 144 m.Rice cultivar: 194,157 ha (21.48%) of total rice cultivar in whole country (DOA, 2009)
Map of Laos (http://www.psywarrior.com/LaosPSYOP.html)

Mekong River Commission2nd Mekong Climate Change Forum
6 – 8 October 2014Siem Reap, Cambodia
Materials and Methods Cont’
Application of The Decision Support System for AgrotechnologyTransfer (DSSAT) crop model.
8

Mekong River Commission2nd Mekong Climate Change Forum
6 – 8 October 2014Siem Reap, Cambodia
Materials and Methods Cont’
Climate Change ScenariosGCMs: Commonwealth Scientific and Industrial Research Organisation (CSIRO-Mk3.0 or CSMK3), Hadley Centre Coupled Model v.3 (HadCM3), and Hadley Centre Global Environment Model (HadGEM).
9
Climate Scenarios Affiliation
CSMK3 – High Sensitivity CSHI
CSMK3 – Low Sensitivity CSLO
HadCM3 – High Sensitivity HCHI
HadCM3 – Low Sensitivity HCLO
HadGEM – High Sensitivity HGHI
HadGEM – Low Sensitivity HGLO
High: SRES A2Low: SRES B1
CO2 concentrations considering a change in every five years were data put... (current year 390 pmm 2010

Mekong River Commission2nd Mekong Climate Change Forum
6 – 8 October 2014Siem Reap, Cambodia
Materials and Methods Cont’
Simulation and Analysis Model validation… to compare with baseline (1976-
2009). There are six scenarios (CSHI, CSLO, HCHI, HCLO,
HGHI, and HGLO) of rice yield simulation for 100 years (2001 to 2100)
Three analysis periods 2001-2030, 2035-2065 and 2070-2100
The rate of N-Fertilization applied and its yield effect
10

Mekong River Commission2nd Mekong Climate Change Forum
6 – 8 October 2014Siem Reap, Cambodia
Results and Discussions
To will increase between +0.64oC and +2.40oC
The average highest maximum of 34.62oC till 2100 (HCHI) it is still in the range of air temperatures for rice growing conditions not over 36oC (Linquist et al., 2005)
11
25.00
26.00
27.00
28.00
29.00
30.00
2001
2006
2011
2016
2021
2026
2031
2036
2041
2046
2051
2056
2061
2066
2071
2076
2081
2086
2091
2096
Years
Ave
rage
tem
pera
ture
(o C)
CSHI CSLO HCHI HCLOHGHI HGLO Ave-HI Ave-LOLinear (Ave-HI) Linear (Ave-LO)
600
800
1000
1200
1400
1600
1800
2000
2001
2006
2011
2016
2021
2026
2031
2036
2041
2046
2051
2056
2061
2066
2071
2076
2081
2086
2091
2096
Years
Prec
ipita
tion
(mm
/yea
r)
CSHI CSLO HCHI HCLO HGHI HGLO Ave Linear (Ave)
- The prec.: -1.03% to +11.39% (compared with baseline)- Solar radiation were diverse range -2.99% to + 2.19%
Mekong River Commission2nd Mekong Climate Change Forum
6 – 8 October 2014Siem Reap, Cambodia
Results and Discussions Cont’
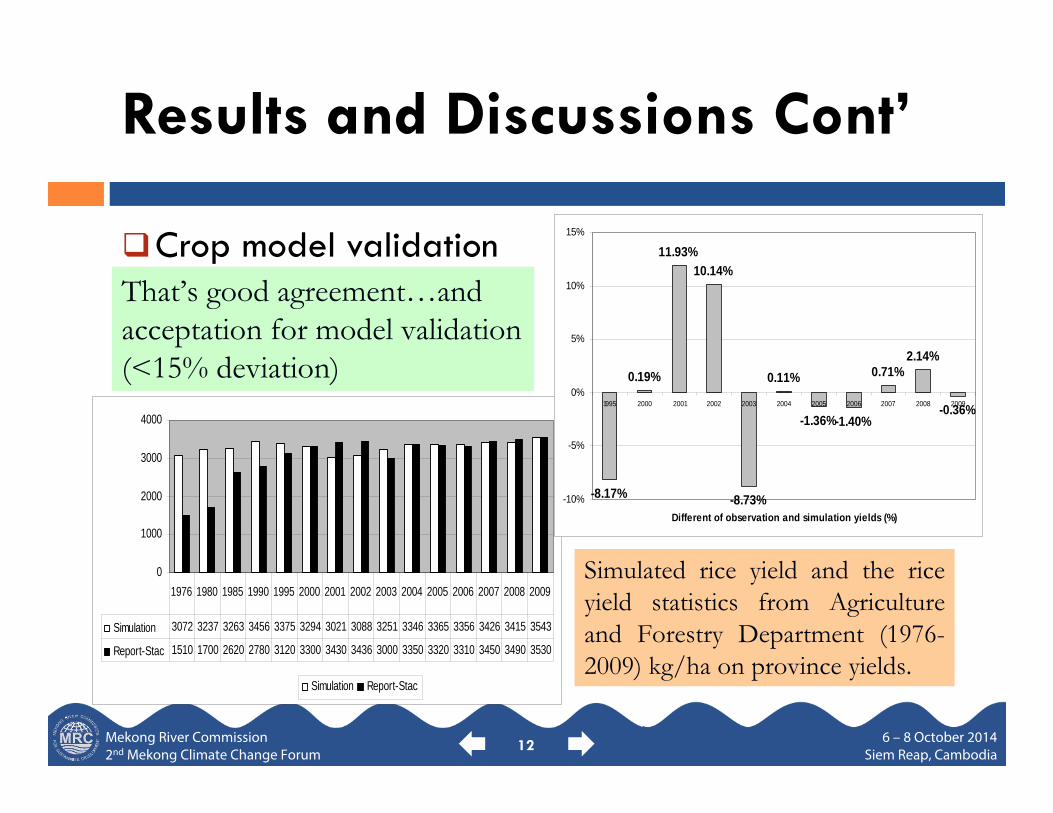
Crop model validation
12
That’s good agreement…and acceptation for model validation (<15% deviation)
0
1000
2000
3000
4000
Simulation Report-Stac
Simulation 3072 3237 3263 3456 3375 3294 3021 3088 3251 3346 3365 3356 3426 3415 3543
Report-Stac 1510 1700 2620 2780 3120 3300 3430 3436 3000 3350 3320 3310 3450 3490 3530
1976 1980 1985 1990 1995 2000 2001 2002 2003 2004 2005 2006 2007 2008 2009
-8.17%
0.19%
11.93%10.14%
-8.73%
0.11%
-1.36%-1.40%
0.71%2.14%
-0.36%
-10%
-5%
0%
5%
10%
15%
1995 2000 2001 2002 2003 2004 2005 2006 2007 2008 2009
Different of observation and simulation yields (%)
Simulated rice yield and the riceyield statistics from Agricultureand Forestry Department (1976-2009) kg/ha on province yields.

Mekong River Commission2nd Mekong Climate Change Forum
6 – 8 October 2014Siem Reap, Cambodia
Results and Discussions Cont’
The six scenarios of simulated rice yield in 21st to compare with observe years (1995 to 2009)
13
Climate factors
Rice yields (kg/ha) Average of growing (days)
% change of rice yields Max Min Mean
Obsv. year 5974 1490 3340 148 CSHI 6902 1599 3695 136 11.43CSLO 6540 1632 3541 143 6.77HCHI 6876 1579 3713 134 11.98HCLO 6470 1635 5347 143 6.95HGHI 6898 1602 3738 135 12.72HGLO 6528 1659 3548 143 7

Mekong River Commission2nd Mekong Climate Change Forum
6 – 8 October 2014Siem Reap, Cambodia
Results and Discussions Cont’
Yields levels of three different periods
14
3400
3450
3500
3550
3600
3650
3700
3750
3800
CSHI CSLO HCHI HCLO HGHI HGLO
Scenarios
Ric
e yi
elds
pro
duct
ion
(kg/
ha)
1 (2001-2030) 2 (2035-2065) 3 (2070-2100)

Mekong River Commission2nd Mekong Climate Change Forum
6 – 8 October 2014Siem Reap, Cambodia
Results and Discussions Cont’
The rate of N-fertilization applied and its yield effect
15
0
1000
2000
3000
4000
5000
6000
7000
123
124
125
126
127
128
129
130
131
132
133
134
135
136
137
138
139
Beginning of grain fill to maturity (days)
Gra
in y
ield
s (k
g/ha
)
Non NN 30kg/haN 60 kg/haN 90kg/haN 120kg/ha
NRRP experiment the rice grain yield could increase significantly when > 60kg/ha N applied…the average of effect range 0 to 38kg rice yield/1kg of N (Linquist et al., 2005). Our study range 0 to 37kg rice yield/1kg of N
TDK1 varieties increased up to about 5,000 kg/ha with applied N 120 kg/ha (Inthavong et al., 2004). Our study range between 5,937 to 6,246 kg/ha with applied 120kg/ha of N

Mekong River Commission2nd Mekong Climate Change Forum
6 – 8 October 2014Siem Reap, Cambodia
Results and Discussions Cont’
Adaptation to climate change impacts on lowland paddy rice
Adjustment of N-fertilization applied The rate of N-fertilizer applied is efficiency on grain yields… However,
differences seed varieties are different stress tolerant
Cultivar adjustment Majority of farmers have been already adapted somehow of seed variety
with high yield potential (e.g TDK1), and can be expected as well under climate change scenarios would get high yield potential as shown in our study
Farming practice adaptations Positive impact…
However, this study not cover diseases, and pet insect damage…so, it could be increased when drought appear… another problem our study not access flash flood …e.g 2011.
Sifting cultivar, and enhance mechanism in shorter times rice planting
16

Mekong River Commission2nd Mekong Climate Change Forum
6 – 8 October 2014Siem Reap, Cambodia
Results and Discussions Cont’
Discussions In comparison with previous studies by Inthavong et al. (2004)… an
increased CO2 to 720 ppm, causes a moderate decline and negative impact of TDK1 rice cultivar…
Other studies (Yoshida., 1976; Amien et al., 1999) rice still would be tolerant to an amount of CO2 between 1500 ppm to 2000 ppm.
Study from Bannayan et al (2004): the growth enhancement by elevated CO2 was less significant for low N-fertilization low to high rate (4g ,8g, and 12g/m2), the yields increased by 7%, 14% and 15%; compared with Inthavong et al. (2004) without applied NPK , and with our study with average of N-fertilization rate of 6 g/m2, our results confirm the low CO2 fertilizing effect of sub-optimum N-fertilization.
17

Mekong River Commission2nd Mekong Climate Change Forum
6 – 8 October 2014Siem Reap, Cambodia
Conclusions and Recommendations
Conclusions The trend of climate change signal will increased in
21st century due to difference climate scenarios (+0.64oC to +2.40oC)
The rice yields simulation will increase between +6.77 to 12.72% compared with the base line (1995-2009).
Adaptation alternatives: Farming themselves adaptation…
Another organizations concerned
18

Mekong River Commission2nd Mekong Climate Change Forum
6 – 8 October 2014Siem Reap, Cambodia
Conclusions and Recommendations
Limitation of the study Lack of observation data (farming practice, genotype
factors..)
Recommendations Should be included more cultivars representing also early
and medium rice varieties. Up land rice cultivation should be simulated Further long term field experiments should be established
with a selected range of cultivars to support such modeling activities with input and calibration data.
19

20
Thank you