1 species diversity of avenue trees in the...
TRANSCRIPT
1
SPECIES DIVERSITY OF AVENUE TREES IN THE COIMBATORE CITY, 1 TAMIL NADU, SOUTH INDIA. 2
3 Ramakrishnan, B1., Jisha George2., Mary Josephine, R3 & Ramkumar, K4 4
5 1. Field officer, Wildlife Trust of India, New Delhi. [email protected] 6 2. M.Sc student 7 3. Reader in Plant biology & Plant Biotechnology, Nirmala College for Women, Coimbatore, 8 [email protected] 9 4. Field officer, Wildlife Trust of India, New Delhi. [email protected] 10 11 Abstract 12 13
The purposes of avenue trees in the cities are mainly because of ornamental, shade, aesthetic 14
and medicinally valuable. Therefore species diversity and their proportion availability in a given area 15
are highly needed for the better management of urban greening. The study was carried out in 16
Coimbatore City with the following objectives, to quantity the occurrence, relative abundance and 17
regeneration and recruitment classes of various plant species. Tree species occurrence, frequency was 18
collected by foot survey. Tailoring tape was used to measure GBH and BA of each tree species. Tree 19
species and their occurrence map were developed by using map info 6.0 Software Program. 20
21
A total of 24 tree species comprising of 456 individuals were recorded from the study area. 22
The family Leguminaceae attributed more number of individuals followed by Meliaceae and 23
Bignoniaceae. The result of habitat preference of the tree species revealed that the majority of them 24
were exotic (55.92%). Three dominant tree species recorded in the study area were Peltophorum 25
inermae (n=97), Poinciana regia (n=94) and Enterolobium saman (n=69). Thespesia populnea 26
attributed highest percentage in recruitment class (33.33%). In the regeneration class Enterolobium 27
saman and Bauhinia purpurea (15%) scored more numbers in total standing trees. The result of Girth 28
at Breast Height at various class interval of trees revealed that the GBH of 51-100cm trees (n=102) 29
were more represented in the over all vegetation cover. The GBH of 400-600 cm trees were 30
represented comparatively very low numbers. Seedlings were represented only in the middle part of 31
the city. The encounter rate revealed that the tree species such as Peltophorum inermae (4.8 trees/km) 32
scored highest value followed by Poinciana regia (4.7 trees/km) and Enterolobium saman (3.4 33
trees/km). 34
35 Key words: Urban greening, Species diversity, Dominant tree species, Avenue trees 36
37
Abbreviations 38
GBH - Girth at Breast Height, BA-Basal Area 39
2 INTRODUCTION 40 41 42 India is one of the world’s twelve-mega diversity nation has almost all climatic conditions 43
(George and Varghese, 1993). India has a typical woodland climate which is favorable to the growth 44
of vegetation. The texture of soil, availability of water resources, the amount of rainfall, riverbanks 45
and the temperature play an important role in the growth of variety of trees in an area (Randhawa, 46
1965). The total geographical area in the country is around 3287263 Sq. Km. In which the forest 47
covered 678333 Sq. Km and the area of cultivable non forest is 2188688 Sq. Km (http://www.fsi 48
org.net/ fsi 2003/ states/index.asp.) 49
The vastness of the plant genetic resource available in India may be gauged from the fact that 50
238 families comprising of 16,000 species, nearly 16 percent of flowering plants of 425 families are 51
known to exist in India. Overall the plant wealth of the country was assessed about 45,000 species 52
(Joshi, 1993). 53
The geographical status of the state of Tamil Nadu consisting of 130057 Sq.Km of which 54
22699 Sq.Km was under the forests, which accumulated for 17.45% of the total geographical area of 55
the state. The cultivable non forest area (CNFA) was 98851 Sq.Km and the total tree cover was 4991 56
sq km (http://www.fsi org.net/fsi 2003/states/index .asp.). 57
Vegetation plays an aesthetic link between man and environment. Plants are enhancing the 58
quality of environment by influencing the life supporting systems (Shukla and Chandel, 1972). 59
Simpson and Pherson (1996) stated that the trees are considered as nature’s air conditioners and they 60
reduce the annual energy use for cooling by 10% to 50 % and electricity use by 23% in California. 61
The reason behind for planting avenue trees in cities and along the roadsides because we believe that 62
no road or street is dressed or furnished until it has been planted to furnish shade, frame vistas of 63
outlying beauty and prevent natural calamities. Plants are the ameliorators of summer air temperature 64
through evaporation. Vegetation playing an effective role in the urban environment, supporting many 65
fundamentals like hydrological cycles, nutrient cycles, and gas balance. So the above all play an 66
essential role in function as a whole (Ramakrishna and George, 1994). In recent days most of the 67

3 vegetation covers were severely affected by various human induced activities. This resulted increase 68
of CO2 accumulation in the atmosphere that ultimately increasing global warming across the world. 69
This kind of changes severely altered many plant species distribution, composition, genetic structure 70
and even extinction of many useful plants (Chandra and Joshi, 2002). Dattraja (1992) also stated that 71
the species diversity is an important criteria for any vegetation study. 72
73
The purposes of avenue trees in the cities are mainly because of ornamental, shade, aesthetic 74
and medicinally valuable. Homogenous stand of the plants never fulfill the above mentioned functions 75
in a given area. Species diverseness not only render the above needs as well as to withstand for long 76
run. Therefore species diversity and their proportion availability in a given area are highly needed for 77
the better management of urban greening. Species diversity is the number and variety of species 78
found in a given area in a region (Sharma, 1975). Patwardhan (2001) studied the avenue tree species 79
diversity with special reference to their habitat, nomenclature, locality and benefits of the each tree 80
species. Similar type of study was attempted by Sudha and Ravindharnath (2000) at Bangalore and 81
Randhawa (1956) in Chandigar. 82
Although vast bio-geographical areas are effectively preserved by various levels of policies 83
and intensive research studies, the micro environments such as avenue trees, social forestry were less 84
attempted for research. But these micro environments role in high carbon polluted cities are 85
remarkable. Therefore, considering the lacunae this present study was attempted to exhibit the need of 86
establishing avenue trees in the South India's Industrial City where actually the avenue trees are highly 87
warranted to absorb the pollution. 88
Objectives 89
(1) To quantity the occurrence of various plant species 90
(2) To find out the relative abundance of tree species 91
(3) To know the regeneration and recruitment classes 92
(4) To suggest management recommendations for urban greening. 93

4 94
STUDY AREA 95
Coimbatore is an inland district of the southern part of Indian Peninsula, elongates from the 96
north to south between 76° 39’ and 77°56’ of east, latitude 10°12’ and 11°57’ of the north latitude. 97
The extent of the area of the city is around 6,024sq.miles. The sample area taken for the study was in 98
Rathna Sabapathy puram (R.S. Puram) of Coimbatore City, which is one of the developed and the 99
developing areas of the city. The area has many shopping complexes, residential areas, hospitals etc. 100
101
The soil of the district is chiefly red sand and gravel with moderate area of red loam and black 102
loam or sometimes black clay. 103
During the study period the temperature was maximum (30.7°C) in the month of September 104
and minimum (17.2°C) in the month of December. The rainfall was recorded maximum in the month 105
of October (235.1mm). 106
Maximum and minimum temperature of the study area during the project period 107 108

5
109
110

6 METHODS 111 112
The short term study was undertaken in R.S.puram, which is a small portion of the Coimbatore 113
City selected as a sample area. The starting point as well as the and point of the streets were marked 114
using the GPS (Global Position System) in order to derive the length of the streets .Like wise the geo-115
coordinates position of each tree was marked. 116
The botanical name of the tree species, the family and the local name was recorded by 117
referring Mathew (1956) and Gamble (1957). 118
Total number of individuals of each tree species was noted. Of which three dominant tree 119
species were recorded based on their occurrence and frequency. Habitat preference, status, trend of 120
each tree species were categorized and tabulated. 121
The total 456 species were classified into 5 types. Namely. 122
1) Forest 123
2) Plantations 124
3) Habitations 125
4) Exotic 126
5) Forest/Exotic 127
The following simple arithmetic calculations were attempted to derive Relative proportion, 128
percentage of regeneration and Recruitment and class and encounter rate of species occurrence in the 129
study area. 130
Total number of individuals of each species 131
Relative proportion = ------------------------------------------------------------- x 100 132
Total number of trees in the study area 133
Similarly the occurrence and total number of regeneration and recruitment types of trees were 134
noted. 135

7 Regeneration - Saplings less then 1m height 136
Recruitment - Saplings less than 10 cm GBH 137
The regeneration and recruitment percentage was calculated as follows 138
The frequency of each species 139
Regeneration percentage = ----------------------------------------- x100 140
Total number of regenerated trees 141
The frequency of each species 142
Recruitment percentage = ----------------------------------------- x100 143
Total number of recruited trees 144
145
For each trees their Girth at Breast Height (GBH) (Dattaraja, 1992) and the Basal Area (BA) 146
were measured by using a tape (Agni et al., 2000). The total numbers of trees were arranged in the 147
ascending order of GBH and BA classes. And the total number of individuals occurred in each GBH 148
class and BA classes were taken and their percentage occurrence for each class was calculated from 149
the total numbers. 150
Total number of trees in each class 151
Class percentage = ------------------------------------------ x 100 152
Total number of trees in the study area 153
A graph was constructed by using the tree species on the x-axis and encounter rate/km on the 154
y-axis and also GBH map was developed to exhibit the occurrence of big trees in the study area. 155
Encounter rate of urban tree species per kilometer was estimated as follows 156
Number of individuals 157
Encounter rate/km = --------------------------------- 158

8 Total length Surveyed (Km) 159
RESULTS 160
TABLE 1. STATUS OF VARIOUS TREE SPECIES IN THE STUDY AREA 161
Local Name Family Name of the Tree Species
Total No. of Individuals
HP Status Trend Benefit
Vepan Meliaceae Azadiracta indica 35 H O D S/M
Vilvam Simarubaceae Balanites aegyptiaca 9 E R D O
Bottle brush Myrtaceae Callistemon linearis 3 P R D O
Konnai Leguminosae Cassia fistula 25 F O D O/M
Paruthi Bombaceae Chorisia speciosa St. Hill. 1 F R D F
Aechinaruvihli Boraginaceae Cordia sebestena 3 F/E R D O
Amaivagai Leguminosae Enterolobium saman 69 F/E C I O/S
Naval Myrtaceae Eugenia jambolana 1 F R D F/S
Aala maram Moraceae Ficus bengalensis 6 H R D S
Arasa maram Moraceae Ficus religiosa 7 H R D S
Jhas phanoos
Bignoniaceae
Kigelia pinnata
6
E
R
D
S/F
Mallay vembu Meliaceae Melia azedarach 5 F R D S/M
Mara malli Bignoniaceae Millingtonia hortensis 22 E R D O
Perungondrai Leguminosae Peltophorum inermae 97 E A I O/S
Nyctaginaceae Pisonia morindifolia 2 P R D S/O
Perungalli Apocynaceae Plumeria alba 1 E R D O
Mayirkondrai Leguminosae Poinciana regia 94 E A I O/S
Ashoke annonaceae Polyalthia longifolia 21 E R D O/S
Pongam Leguminosae Pongamia pinnata 18 F R D S/O
Sandanam Santalaceae Santalum album 1 F R D S
Patadi Bignoniaceae Spathodea campanulata 5 E R D O/S
Thekku Verbanaceae Tectona grandis 3 F R D S

9
Badam Combretaceae Terminalia catapa 6 F R D F/S
Kallal Malvaceae Thespesia populnea 16 H R D O/S
162 HP-Habitat preference: F-Forest, P-Plantations, H-Habitatious, E-Exotic 163 Status: A-Abundant, C-Common, O-Occasional, R-Rare 164 Trend: I-Increase, D-Decrease; Benefit: O-Ornamental, F-Fruit bearing, S-Shade, M-Medicinal 165 166
A total of 24 tree species comprising of 456 individuals were recorded from the study area 167
over a period of three months. The family Leguminosae attributed more number of individuals 168
followed by Meliaceae and Bignoniaceae. Among the tree species Peltophorum inermae (n=97), 169
Poinciana regia (n=94) and Enterolobium saman (n=69), ranked first three positions. On the other 170
hand, species such as Chorisia speciosa (n=1), Eugenia jambolana (n=10), Plumeria alba (n=1) 171
Santalam album (n=1) Pisonia morindifolia (n=2) and Tectona grandis (n=3) positioned last ranks 172
with their availability being lowest. Species such as Azadiracta indica (n=35) Cassia fistula (n=25) 173
and Millingtonia hortensis (n=22) have scored average ranks in the overall vegetation cover (Table 1). 174
Map 2. Occurrence of various tree species in the study area 175
176
177

10
The result of habitat preference of the tree species in the study area revealed that the majority 178
of them were exotic (n=255) which were introduced from both western and eastern countries. One 179
fourth of them were being cultivated near human habitations and a few of them were plantation 180
species (Table 2). 181
TABLE 2. TREE SPECIES RICHNESS AGAINST HABITAT TYPES. 182
Sl. No.
Habitat Types
Total No. of Individuals
Relative Proportion(%)
1 Forest 60 13.16
2 Plantations 5 1.10
3 Habitatious 64 14.04
4 Exotic 255 55.92
5 Forest / Exotic 72 15.79
183
Exotic tree species contributed relatively high proportion (55.92%) out of the overall 184
composition of the trees followed by Forest/Exotic (15.79%), human habitation species (14.04%) and 185
forest species (13.16%). On the contrary, plantation species (1.10%) showed the lowest proportion 186
availability in the study area (Table 2). 187
Map 3. Three dominant tree species recorded in the study area 188
189

11
190
191
TABLE 3 REGENERATION AND RECRUITMENT CLASSES OF TREES. 192
Regeneration Recruitment Sl.No. Name of the Species Frequency Percentage Frequency Percentage
1 Mangifera indica 1 2.5 0 0
2 Pongamia pinnata 4 10 1 8.33
3 Enterolobium saman 6 15 3 25
4 Plumeria alba 2 5 0 0
5 Cassia fistula 3 7.5 1 8.33
6 Thespesia populnea 4 10 4 33.33
7 Auracarea 1 2.5 0 0
8 Cordia sebestena 1 2.5 0 0
9 Spathodea campanulata 1 2.5 0 0
10 Azadiracta indica 3 7.5 0 0
Peltophorum inermae
Poinciana regia
Enterolobium saman

12
11 Terminalia catapa 3 7.5 1 8.33
12 Bauhinia purpurea 6 15 0 0
13 Poinciana regia 2 5 1 8.33
14 Melia azedarach 1 2.5 0 0
15 Santalum album 2 5 0 0
16 Dombeya sp. 0 0 1 8.33
193
Availability of the regeneration and recruitment classes of the various tree species out of the 194
total numbers were varied among the species. Thespesia populnea attributed highest percentage in 195
recruitment class (33.33%) in the regeneration class Enterolobium saman and Bauhinia purpurea 196
scored equally (15%). out of the total standing trees. Recruitment numbers were same in the species 197
such as Pongamia pinnata,Cassia fistula, Terminalia catapa, Poinciana regia and Dombeya sp. 198
(8.33%) . Similarly regeneration class was also same in some of the species of Cassia fistula, 199
Azadiracta indica and Terminalia catapa (2.5%) in the total trees category (Table 3) 200
201
Map 4. Status of seedlings and recruitments in the study area 202
203
TABLE 4. VARIOUS GBH CLASSES OF TREES. 204

13
Sl. No.
GBH Class (cm) No. of trees Percentage
(%)
1 0-50 39 8.55
2 51-100 102 22.37
3 101-150 52 11.40
4 151-200 90 19.74
5 201-250 63 13.82
6 251-300 45 9.87
7 301-350 21 4.61
8 351-400 21 4.61
9 401-450 13 2.85
10 451-500 5 1.10
11 501-550 2 0.44
12 551-600 3 0.66
205
In total 456 tree individuals Girth at Breast height (GBH) were classified into 50cm interval to 206
know the availability of different age groups of trees in the study area. The result revealed that the 207
GBH of 51-100 cm trees (n=102) represented the most in the over all vegetation cover, followed by 208
151-200 cm (n=90) and 201-250 cm (n=63). It is interesting to note that, the GBH between 400 and 209
600 trees represented comparatively very low numbers in the over all vegetation cover in the study 210
area (Table 4) 211
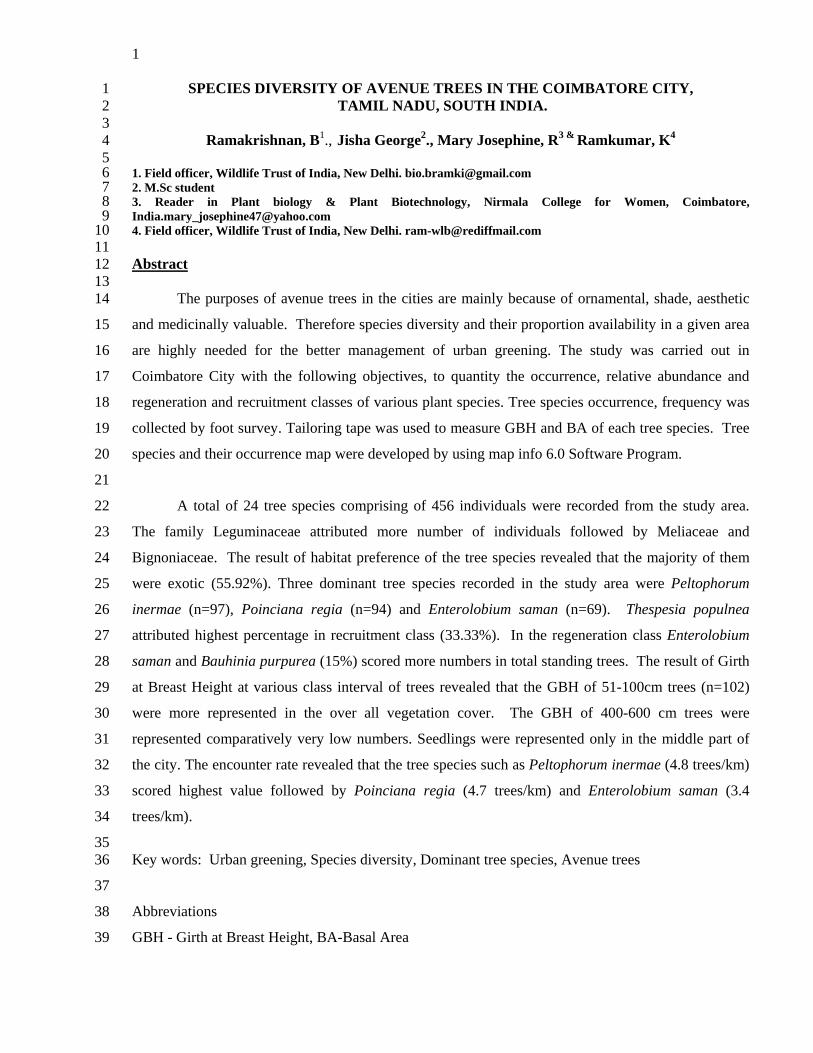
Map 5. Occurrence of big trees in the study area 212
14
213
TABLE 5. VARIOUS BASAL AREA CLASSES OF TREES. 214
Sl. No.
BA Class (cm)
No. of trees Percentage (%)
1 0-50 30 6.58
2 51-100 98 21.49
3 101-150 54 11.84
4 151-200 95 20.83
5 201-250 59 12.94
6 251-300 44 9.65
7 301-350 26 5.70
8 351-400 29 6.36
9 401-450 12 2.63
10 451-500 4 0.88
11 501-550 1 0.22
12 551-600 4 0.88
Basal Area (BA) of the various tree species in the study area was not much varied in the 215
classes between 50 cm and 400 cm (Table 5). The numbers of individuals were very low in the basal 216

15 area class between 450 cm and 600 cm. Basal area of 51-100 cm was proportionately high (21.49%) 217
in the overall vegetation cover. On the contrast, it was very low (0.22%) in the 501 –550 cm class. 218
219
Encounter Rate 220
The encounter rate revealed that the Peltophorum inermae (4.8 trees/km) scored highest value 221
followed by Poinciana regia (4.7 trees/km) and Enterolobium saman (3.4 trees/km) in the study area. 222
Other tree species such as Azadiracta indica (1.8 trees/km) and cassia fistula (1.2 trees/km) and 223
Milingtonia hortensis (1.1 trees/km) were recorded in considerable numbers. 224
225
226
227

16 DISCUSSION 228
A short term study on tree diversity of the R.S.Puram urban area was carried out from October 229
to December. A total of 456 trees were recorded comprising of 24 species. Past studies such as 230
Patwardhan (2001) quoted 380 tree species till date have been recorded, Ghate (1990) recorded 33 231
species but he could not record 57 species recorded by Vartak (1964) in the Pune urban area. Among 232
the families Leguminosae attributed more numbers than other families in the overall standing trees. 233
Among the tree species. Peltophorum inermae, Pionciana regia and Enterolobium saman ranked the 234
first three positions. Habitat preference of the tree species in the study area showed that the majority 235
of the tree species are exotic species. Patwardhan (2001) have also recorded majority of the tree 236
species of Eucalyptus or Palms in Pune urban area. Generally district administration prefers exotic 237
tree species for urban greening. This is mainly due to its survival capacity against any climatic 238
conditions as well as ornamental values of the most of the tree species in the urban area were planted 239
for ornamental purpose and to provide good shade to the public. 240
241
Forest and some human habitation tree species were also considerably recorded in the study 242
area. This could be to maintain our endemic species as gene pool in the urban area. Santapau (1958) 243
also found in habit ever green forests species in moister areas, nearest locality From Pune city from 70 244
km away. It was interesting to note that the seedlings of the urban tree species (Regeneration and 245
Recruitment class) were mainly of endemic species such as Thespesia populnea, Bauhinia purpurea, 246
Pongamia Pinnata, Cassia fistula, and Terminalia catapa. The seedlings and their growth status of 247
this urban area is another endeavor in this direction. This seemed to be an encouraging trend which 248
would definitely pave the way to the public. The needs and values of our own tree species used by our 249
ancient people, also this will reduce the invasion of exotic species into our natural ecosystem. 250
Because many of the exotic species are noxious in nature and also they bring adverse effect to the 251
natural system. Patwardhan (2001) has pointed out that the increase in population of exotic trees will 252
lead to the declining of native species. His finding has supported to my finding. 253

17 The Girth at Breast Height (GBH) of majority of the trees belongs to those between 51 cm and 254
250 cm among all the standing trees. This is an encouraging trend for having low GBH class trees in 255
the urban area. Because this standing trees population definitely support in future as green mass in the 256
study area. The low representation of trees in the GBH class between 400 and 600 cm trees are need 257
to be replaced by planting new seedlings. 258
259
The total Basal area of the urban trees growing in the study area is 88.9 sq.m. Among the tree 260
species, Peltophorum inermae covered more place in the overall sampled area (21.908 sq.m) Followed 261
by Poinciana regia and Enterolobium saman 262
263
Management Recommendations 264
1. Only tree species were found in more numbers in overall vegetation. The other species may 265
be planted in future. 266
2. The centre part of the study area alone attributed more seedlings of the tree species. This 267
indicate that future plantation is needed in the peripheral area. 268
3. Since most of the trees are matured trees. Plantation may be undertaken by the concern 269
authorities for the future wealth of green cover. 270
271
BIBLIOGRAPHY 272
Chandra,S., and Joshi,S.C.,2002. Dirunal and seasonal variation in carbon-dioxide levels in the 273 surface air of Garhwal, Himalaya. Indian.J. Fore 25(2): 205-208. 274
Dattaraja, H.S., 1992. Mannuals for vegetation study. Centre Fore Ecological Sciences, Indian 275 Institute of Science, Bangalore, India. 276
Gamble, J.S., 1957. Flora of the Presidency of madras. Botasical survey of India, Calcutta. 277 Reprinted edition. 278
Ghate,u.,1990. The Arboreal Flora of Poona corporation campus. RANWA, Pune. 279
George,M., and Varhese, G., 1993. Species diversity and structural variation of a Tropical Dry 280
http://www.fsi org.net/ fsi 2003/ states/index.asp. 281
Joshi, V.N. Kumbhojkar, M.S., and Kulkarni,D.K., 1992. Changing floristic pattern of chatushringi-282 vetal plateau near pune. A comparative study. Jr.Econ. Tax.Bot .16 (1): 133-139. 283
Mathew K.M.,1956. Illustrations of the flora of palni hills, South India. 284

18 Patwardhan, A.A., 2001 Tree Diversity of Pune urban Area: Cosmetic Increase? Abhayankar, 14 285
Nityanand society, Dhankawadi, Pune, India ankurpatwardhas @ hotmail.com. 286
.Randhawa, M.S., 1965. Flowering trees, National Book trust, India. 287
Santapau, H.,1958. The flora of Khandala Hills, Botanical survey of India, Calcutta. 288
Sharma,P.D., 1975. Ecology and Environment, Rastogi Publications, Meerut,India. 289
Shukla, R.S., and Chandel,P.S., 1972. Plant Ecology. S.Chand and company Ltd., Ramnagar, New 290 Delhi, India. 291
Simpson,J.R., and Mc Pherson, E.G., 1996. Potential of tree shade for reducing residential energy use 292
in California, J.Arboric 22 (1) :10-18. 293
Sudha,P., and Ravindranath, N.H., 2000. A study of Bangalore urban Forest, Landscape & urban 294
planning 47:47-63. 295
Tarai-Bhabhar tract of Kumaun, Central Himalaya. Indian J For 23(3) 252-261. 296
Tarun Agni; Atul Pandit., Kavita Pant., and Ashish tawari.,2000. Analysis of tree vegetation in the 297
Tarai-Bhabhar tract of Kumaun, Central Himalaya. Indian J For 23(3) 252-261. 298
Vartak,V.D.,1964. The arboreal Flora of the Poona corporation campus. Jr. Poona univ (Sci & Tech) 299
44:97-133. 300