1 structural health monitoring system with the latest information technologies
TRANSCRIPT

1
STRUCTURAL HEALTH MONITORING SYSTEM WITH THE LATEST INFORMATION TECHNOLOGIES
R. Andrew Swartz1, Andrew Zimmerman1 and Jerome P. Lynch2,3
ABSTRACT: Over the past decade, a variety of information technologies have been under development in the computer science and electrical engineering fields that have transformed all facets of our society. Adoption of these transformative information technologies for monitoring complex civil infrastructure systems can lead to safer structures that are easier to manage over their operational lives. Foremost among the information technologies explored for structural health monitoring are wireless sensors. Wireless sensors are low-cost data acquisition nodes that collocate communication and computing functionality with the sensor transducer. The result are low-cost structural monitoring systems defined by high nodal densities. To offer a scalable approach to management of the large data sets offered by wireless monitoring systems, in-network computing by the wireless sensor network is a powerful approach to automation of interrogation of structural response data for signs of structural distress. In addition, cyberinfrastructure tools are offered to provide anywhere-anytime access to response data collected by the wireless monitoring system. This paper will present the authors’ experiences with the research and development of wireless sensors designed explicitly for structural health monitoring of civil engineering structures. Recent field deployments of wireless sensor networks are described so as to illustrate the reliability and precision of the current generation of wireless sensors currently available. KEYWORDS: Wireless sensor, embedded data processing, in-network data interrogation, information technology, data streaming, MEMS, sensors. 1. INTRODUCTION Over the last 50 years, a number of catastrophic bridge failures in the United States have called attention to the disrepair of national infrastructure systems and the need for structural health monitoring. For example, the I-35W Bridge in Minneapolis, Minnesota, catastrophically failed on August 1, 2007 without warning, resulting in the death of 13 motorists (Figure 1). Constructed in 1967, the I-35W bridge was one of the busiest bridges in Minnesota carrying 140,000 vehicles daily including 5,700 commercial vehicles [1]. The bridge was designed using a steel truss system to carry traffic load over 14 independent spans; the total bridge length was over 580 m. In recent years, the bridge was rated as “structurally deficient” after annual inspections revealed corrosion, poor welding details, fatigue cracking in steel members and dysfunctional bearings [1]. At the time of the collapse, the bridge was being inspected to ensure the integrity of the bridge’s welded connections. While no conclusions can yet be drawn as to the cause of the bridge’s catastrophic failure, the I-35W Bridge underscores the need for more thorough and rational bridge management methods that are more effective in preventing similar tragedies in the future. The I-35W bridge is not the first major bridge failure in the history of the United States. For example, during the period of 1989-2000, over 134 bridges in the United States partially or totally collapsed [2]. Perhaps the most important bridge failure in the history of the civil engineering profession is the Point Pleasant Bridge spanning the Ohio River between Ohio and West Virginia [3]. The Point Pleasant
1 Department of Civil and Environmental Engineering, University of Michigan, Graduate Student 2 Department of Civil and Environmental Engineering, University of Michigan, Assistant Professor 3 Department of Electrical Engineering and Computer Science, University of Michigan, Assistant Professor
Proceedings of 5th Infrastructure & Environmental Management Symposium, Yamaguchi, Japan, September 28, 2007.

2
Bridge collapsed due to fatigue failure of load-carrying eye-bar sections; the result was the death of 46 motorists. While tragic, the failure of the Point Pleasant Bridge did lead to the initiation of the 1971 National Bridge Inspection Program (NBIP) which mandates bi-annual inspection of every highway bridge in the United States [4]. Since initiation of the rigorous NBIP program, approximately 10-20% of the national bridge inventory (which consists of over 583,000 bridges) has consistently been classified as “structurally deficient” over the years [5]. The United States in not the only developed nation to have experienced bridge failures. For example, the Seongsu Bridge located over the Han River in Seoul, Korea failed in 1994 resulting in 32 motorists killed [6]. Similar to the I-35W Bridge, the Seongsu Bridge was also a steel truss bridge with little structural redundancy. In Portugal, the Entre-os-Rios Bridge catastrophically collapsed on March 5, 2001, due to scour of a bridge masonry pier; in total 59 people lost their lives [7]. The Entre-os-Rios Bridge was 116 years old at the time of failure and carried 1,600 vehicles across the River Douro daily. Outside of natural disasters like earthquakes, the sudden collapse of bridges is an unacceptable situation to the international civil engineering community. Although most countries have vigilant measures in place (e.g. mandated inspections) to ensure bridges meet minimum safety standards, bridge failures still occur. One reason why current measures fall short is that bridge inspection is primarily conducted by visual inspection (VI). A recent study by the Federal Highway Administration (FHWA) quantified the reliability of VI methods; their study reported variability in the condition ratings assigned to bridges by highly trained bridge inspectors [8]. To add more objectivity to current inspection methods, local departments of transportation have begun to adopt nondestructive evaluation (NDE) technologies (e.g. ultrasonic testing) [4]. While adoption of NDE technologies is an important first-step in the right direction, bridge officials can more aggressively pursue advanced information technologies to revolutionize their inspection strategies. In related engineering disciplines, a plethora of new technologies are readily available that can render current structural health monitoring (SHM) methods more cost-effective and easier-to-implement. In particular, the computer science and electrical engineering fields offer revolutionary technologies for future SHM systems including high-precision microelectromechanical system (MEMS) sensors, wireless sensor networks (WSN), and cyberinfrastructure (CI) tools. The objective of this paper is to present how state-of-the-art information technologies will impact the civil engineering field’s current state-of-practice in ensuring the operational safety of complex and expensive infrastructure systems. Towards this end, the paper is delineated into five sections. First, the use of wireless sensors as low-cost data acquisition nodes for recording structural behavior under loading is described. Second, utilization of the computing power integrated within the design of wireless sensors will be presented including the embedment of modal analysis algorithms for automated execution. To validate the performance of the wireless sensors (both hardware functionality and software execution), a series of laboratory and field experiments will be presented in the third part of the paper. To protect the
Figure 1. (Left) I-35W Bridge in Minneapolis, Minnesota; (right) catastrophic failure after collapse on August 1, 2007 (source: Associated Press, 2007).

3
engineer from being inundated with data possible with a high-density WSN installed on a civil structure, cyberinfrastructure tools can be adopted for efficient management of extensive structural response data sets. The fourth section of the paper illustrates the use of cyberinfrastructure tools to stream wireless sensor data to the internet (for anywhere-anytime viewing) and the use of on-line simulation servers to update analytical models of the structure. In the last portion of the paper, the use of wireless sensor networks for real-time feedback control of a structure are described. Wireless feedback control can be used to mitigate undesired responses in structures so as to enhance their serviceability and safety. 2. WIRELESS SENSORS FOR MONITORING CIVIL INFRASTRUCTURE SYSTEMS Structural monitoring systems are often used to monitor the behavior of structures exposed to significant loading conditions including strong winds and moderate to severe seismic events. With respect to bridges, the complexities associated with modeling and managing long-span bridges encourages the use of structural monitoring systems. Response data recorded from a bridge is used to update analytical models of the bridge and to capture nonlinear structural responses during extreme loading. Towards this end, bridges have been instrumented worldwide including those in California [9], Hong Kong [10], Japan [11], China [12] and Korea [6]. A defining feature of current monitoring technologies for civil structures is the use of shielded wiring to communicate measurement data from the sensor to a centralized data server. While wiring offers a reliable communication channel for data delivery in a structural monitoring system, the installation costs of wires in a large-scale structure are high. For buildings, the cost of a new structural monitoring system can cost upwards of a few thousand dollars per sensing channel [13]. In addition, the time and labor required for installation can be extensive. These factors have been partially responsible for limiting the adoption of structural monitoring systems beyond just critical structures such as long-span bridges. Should the cost and installation time required for structural monitoring systems be substantially reduced, more engineers would install monitoring systems in their structures. Foremost among the revolutionary information technologies recently adopted for structural health monitoring are wireless sensors. Wireless sensors were first proposed for use in structural monitoring applications by Straser and Kiremidjian [14]. Motivation for the adoption of wireless sensors in structural monitoring applications originate from the fact that the installation of shielded wires in large civil structures drive system costs high and create long installation times. Therefore, replacing a wired communication channel with a wireless one renders wireless monitoring systems cheaper and easier to install. This advantage is amplified by designing wireless sensors using inexpensive, commercial off-the-shelf (COTS) technologies that keep development costs down. However, to preserve the economic advantage of adopting wireless sensors in civil structures, the sensors must also be low-power and highly reliable in harsh field conditions. Specifically, excessively frequent trips to the structure by maintenance crews to replace batteries or defective sensors would quickly erode away any up-front costs savings realized in the selection of a wireless monitoring system. Since the seminal study by Straser and Kiremidjian [14], a number of researchers have proposed the use of wireless sensors for structural health monitoring [15, 16]. Those researchers have either designed their own wireless sensor prototype or have elected to adopt a commercial wireless sensor platform (e.g. Crossbow). In this paper, the authors will present their experience in designing wireless sensor prototypes explicitly for monitoring large-scale civil structures (Figure 2). While generic wireless sensors are commercially available, they require the engineer to accept performance features that might not be ideal for civil structures. For example, most commercial wireless sensor platforms have short communication ranges (< 30 m) and low digitization resolutions (10 or 12-bits). Alternatively, by designing a wireless sensor prototype from scratch, the civil engineering community can achieve a low-power device with far reaching communication ranges (> 100 m) and high analog-to-digital resolutions (16-bits or higher).

4
(a) (b) (c)
(d) (e) (f)
Figure 2. Six generations of wireless sensor prototypes designed for structural health monitoring of civil structures: (a) Straser and Kiremidjian [14]; (b) Lynch [17]; (c) Lynch et al. [18]; (d) Lynch et al. [19]; (e) Wang et al. [20]; (f) Swartz et al. [21]. 2.1 Architectural Overview of Wireless Sensors for Structural Monitoring A wireless sensing network functionalized for structural health monitoring is constructed from wireless sensor nodes. The general architecture of a basic wireless sensing node consists of three modules: the sensing interface, the computational core, and the communication interface. Additionally, “active” wireless sensors can also be designed by including a fourth interface, the actuation interface, in their hardware design. The actuation interface would allow the wireless sensor to interact with its environment (for example, command actuators). The general architectural design of most wireless sensors can be depicted by the schematic shown in Figure 3. A discussion of the purpose, composition, and important design parameters of each these four interfaces will be presented. In particular, the design of two specific wireless sensor prototypes are then presented so as to detail the manner in which the two designs help address the specific challenges inherent in the wireless monitoring of civil structures. Sensing Interface: The sensing interface provides a means to digitizing the analog voltage outputs of sensors (e.g. accelerometers, strain gauges, geophones, etc.) that are affixed to the surface of the structure. Those signals must be converted into digital formats for either on-board processing or wireless transmission to other nodes in the network. For this task, the sensing interface will be equipped with an analog-to-digital converter (ADC). Whereas commercial wireless sensors have low resolution ADCs in their design, structural monitoring necessitates high resolution ADCs with resolutions of 16-bits or higher. In addition, to enhance the functionality of the wireless sensor, a multi-channel sensing interface that can accommodate a heterogeneous array of sensors is sought. Signal conditioning circuitry (amplifiers, anti-aliasing filters, etc.) may be contained within the sensing interface or installed separately from the wireless sensor design depending on the requirements of the individual sensors utilized and the sensing application. Important parameters to consider in the design of the sensing interface include the maximum sampling frequency, the input voltage range, electrical noise, power consumption, and cost.

5
Computational Core: The computational core contains the programming required to operate the wireless sensor hardware, communicate within the network, and perform any embedded data processing operations that might be required. Microcontrollers (µC) are used almost exclusively for the computation core of wireless sensors because they can execute complex tasks quickly and reliably, while consuming little power. Microcontrollers will coordinate the actions of the sensing and communications interfaces as well as the network as a whole. In applications where large amounts of sensor data must be made available at one time, the computational core will include an additional static random access memory (SRAM) bank to augment the memory available to the microcontroller. Important properties to consider in the design of a computational core are processor speed, power consumption, internal and external bus sizes for peripherals, memory, and cost. Wireless Communication Channel: Wireless sensors must be designed to be able to communicate their information, either in the form of raw data or the results yielded from execution of embedded algorithms, to the system end-user. Furthermore, wireless nodes may need to communicate within their network for collaborative data analysis and monitoring processes. These communication tasks are accomplished by use of a wireless modem in the communications interface. Important properties of a wireless modem to consider are transmission rate, transmission range, power consumption, operational frequency, compliance with legal communication rules, and cost. Actuation Interface: For active sensing applications, such as ultrasonic nondestructive evaluation (NDE) or feedback structural control, an actuation interface is a necessary addition to the wireless sensor design. The actuation interface provides a means for units to interact directly with their environment via command signals sent to actuators. Since actuators are commanded using analog voltage signals, the actuation interface consists of a digital-to-analog converter (DAC) for conversion of digital signals from the microcontroller . Important properties in the design of an actuation interface are number of channels, output range, settling-time, resolution, power consumption and cost. 2.2 Wireless Sensor Prototypes The wireless sensor designed by Wang et al. [20] is a state-of-the-art prototype featuring a low-cost design, low power consumption, long communications ranges, and multiple sensing channels per unit. To support data collection from different sensors, the prototype’s actuation interface consists of a Texas Instruments ADS8341 4-channel, 16-bit ADC. The ADS8341 has a maximum conversion rate of 100kHz with power dissipation of 8mW. Input voltages may vary between 0 and 5 V which is the regulated voltage provided by the device’s power supply (typically a battery pack).
Figure 3. Architectural design of wireless sensors. The design consists of three major on-board components including the sensing interface, computational core and wireless channel. An optional component is the actuation interface.

6
For the computational core of the unit, the Atmel ATMega128 8-bit microcontroller was selected. The ATMega128 is configured to operate at 8MHz; it has 128 kB of flash memory and 4 kB of EEPROM. This is an ample amount of read only memory (e.g. flash and EEPROM) that is useful for storing data interrogation schemes in the wireless sensors. An additional feature of the microcontroller is the rich set of on-board peripherals including a two-wire serial interface, two programmable serial ports, and a master/slave serial peripheral interface (SPI). The primary reason for the selection of the ATMega128 is its low-power consumption. In active mode, the ATMega128 consumes 85 mW of power when powered by a 5V power supply. Strategic use of the microcontroller’s sleep mode reduces the power consumption of the wireless sensor considerably. To augment the available on-chip memory of the microcontroller, an additional 128kB of SRAM is available externally using a Cyprus Semiconductor CY62128BLL-55SC. The communications interface is designed to be compatible with one of two different wireless modems, both manufactured by MaxStream. For domestic use (in the United States), the MaxStream 9XCite wireless modem with a maximum throughput rate of 38.4 kbps and an outdoor line-of-sight range of 300 m using a 2.1dB gain dipole antenna is the modem of choice. Although more power efficient than most commercial wireless modems, the 9XCite still consumes 275 mW during transmit and 175 mW during receive, making it the most power intensive component of the entire wireless sensor design. The 9XCite communicates on the 900 MHz band making it unsuitable for most international applications where use of the 900 MHz band for scientific purposes is restricted. For international use, the 9XCite may be replaced with the more expensive MaxStream 24XStream radio that communicates within the 2.4 GHz unlicensed industrial, scientific, and medical (ISM) band. Data transmission rates for the 24XStream are only half that of the 9XCite at 19.2 kbps. Power consumption is greater at 750 mW during transmit and 400 mW during receive. With the greater power consumption comes better range with an outdoor line-of-sight range of 5 km using a 2.1dB gain dipole antenna. The long range of this radio makes it especially well suited for use on large civil infrastructure systems. The final wireless sensor is packaged upon two printed circuits boards (one housing the sensing interface and computational core and the other for the wireless modem) and packaged in a hardened plastic container. The modem is able to be easily removed from the device; this facilitates exchanging the 9XCite for the 24XStream and vice versa. Also included in the wireless sensor design is a battery power supply consisting of 5 AA batteries. Lithium ion batteries are preferred for powering the unit to offer the longest life expectancy (roughly 40 hours of active use) [20]. A functional diagram and picture of the unit are presented in Figure 4. 2.2 Active Wireless Sensors for Actuation in Civil Structures An alternative wireless sensor design has been developed that is intended not only to sense the response of a structure, but also to physically interact with the system being monitored. Towards this end, Swartz et al. [21] developed the “Narada” wireless active sensor using many of the same
Parallel Port4-channel 16-bitAnalog-to-Digital
ConverterADS8341
4-channel 16-bitAnalog-to-Digital
ConverterADS8341
40 kbps 9XCiteWireless
Modem with 900MHz Tranceiver
8-bit Micro-controllerATmega128
Sensing Interface Computational Core WirelessCommunication
0 - 5VAnalog
Sensors
SPIPort
128kB External SRAMCY62128B
UARTPort
Figure 4. Wireless sensor prototype for structural health monitoring: (left) detailed hardware design; (right) wireless sensor fully assembled.

7
functional components as Wang et al. [20] but an actuation interface has been added (Figure 5). Utilizing the same sensing interface and computational core as the previous generation, three alterations have been made. First, the printed circuit board (PCB) had been upgraded from a 2-layer PCB to a 4-layer PCB. This change allows for the use of power and ground planes which reduce overall noise and heat dissipation issues observed in the previous wireless sensor design. For example, due to its 2-layer construction, the device designed by Wang et al. [20] was not able to properly separate a stable ground reference for analog components (e.g. ADC) away from that used by the digital components (e.g. microcontroller) resulting in mild on-board noise in the analog-to-digital conversion process; this noise degrades the performance of the ADC from 16-bits to something closer to 14-bits. By segregating the analog and digital ground planes, the on-board noise is nearly eliminated thereby allowing the ADC to perform at virtually its full theoretical 16-bit limit. Besides separate ground and power planes for the analog and digital components, the form factor of Narada using the 4-layer PCB is smaller than that of the previous unit. This size reduction was realized by utilizing surface-mounted discreet electrical components (such as capacitors) and utilizing both sides of the PCB for surface mounting components. The second major change from the previous generation unit was, as previously mentioned, the addition of the actuation interface. The actuation interface consists of a Texas Instruments DAC7612 which is a dual-channel, 12-bit DAC. Its settling time is 7µs with an output range set between 0 and 4.1 V resulting in an output resolution of 1 mV. Power consumption during actuation is 3.7 mW making it a very low power consumer. As actuators for civil engineering structures are generally not as precise as the sensors used for monitoring, a 12-bit DAC was deemed to be adequate despite the requirement for a 16-bit ADC in the actuation interface. The lower resolution requirements for actuation allowed the use of a lower-power and less expensive DAC. The final notable difference was the incorporation of an IEEE 802.15.4, Zigbee-compliant wireless modem into the unit in place of the MaxStream radios. The radio selected is the CC2420 by Chipcon, now owned by Texas Instruments. The advantages of the new radio are speed, a sophisticated packet structure, and ultra-low power consumption. For active sensing, transmission speed is very important so that units are able to communicate information to each other without delay (since delay degrades the performance of closed-loop control solutions). The CC2420 is capable of data rates of 250 kbps making it over 6 times as fast as the 9XCite and more than 12 times as fast as the 24XStream. The CC2420 is a very low-power device consuming only 57 mW during transmit and 62 mW during receive operations. In addition, by taking advantage of the IEEE 802.15.4 data packet structure, operations requiring unit-to-unit transmissions may be simplified and accelerated with automated identification of sending and receiving unit Node IDs, variable payload lengths, auto acknowledgement of packets, differing packet types (e.g. command, data, acknowledgement, etc.), and security features. A variant of the IEEE 802.15.4 medium-access control (MAC) layer and a custom designed network layer have been developed for the Narada wireless sensor to render it
Figure 5. The “Narada” wireless sensor: (left) detailed hardware design; (right) a fleet of operational Narada wireless sensors (nine Narada units shown).

8
effective in forming and operating in large, ad-hoc, peer-to-peer networks. This unique combination of robustness and flexibility in the network topology will allow for the eventual deployment of very dense networks (defined by hundreds of sensors) to monitor and collect large amounts of data related to the condition of a civil structure. However, the primary disadvantage associated with using the low-power radio is the reduction in communication range. The maximum achieved outdoor line-of-sight communication range for the unit is 50 m, requiring use of multi-hop networking to transfer date the entire length or height of a very large civil engineering structure. A functional diagram and photograph of the Narada wireless sensors are presented in Figure 5. 2.3 Sensor Conditioning Circuitry for Wireless Sensors: As previously mentioned for both wireless sensor prototypes, the sensing interface ADC is capable of reading voltage signals that span from 0 to 5 V. Upon reading the analog output of the sensor, the wireless sensor digitizes the reading into a 16-bit number for processing by the microcontroller. This 16-bit resolution can resolve differences in the analog voltage input to as small as 7.63 x 10⁻⁵ V. Unfortunately, for extremely low-level accelerations possible during ambient excitation of a civil structure, this quantization threshold might be too small. Either a higher resolution ADC is needed or the sensitivity of the sensor must be high. To address this limitation of the current sensing interface, an off-board signal conditioning circuit has been designed (Figure 6a). This signal conditioning circuit is designed to perform three tasks: 1) shift all sensor outputs to have an output mean of 2.5 V, 2) amplification of the sensor output, and 3) anti-alias filtering. The purpose of the shift operation is to allow sensors with negative and positive outputs to be compatible with the wireless sensor. The amplification feature of the circuit is to increase the sensitivity of the sensor interfaced to the wireless sensor. By way of a three-way switch, different amplification factors are provided to the user: 5, 10 and 20 times amplification. Furthermore, a 50 Hz anti-alias filter is included in the circuit design. To measure strain in a structure a Wheatstone bridge circuit is needed to convert changes in a strain gage’s resistance into a voltage signal. To interface 120 Ω metal foil strain gages to the wireless sensors’ sensing interfaces, a Wheatstone bridge circuit with an amplified bridge voltage is designed (Figure 6b). The Wheatstone bridge circuit consists of an instrumentation amplifier (Analog Devices AD623) offering an amplification factor of 50. 3. EMBEDDED DATA PROCESSING IN WIRELESS SENSOR NETWORKS All wireless sensors include microcontrollers in their design; this collocation of computing (microcontroller) with the sensor represents a major paradigm shift associated with wireless monitoring. In traditional tethered structural monitoring systems, the system architecture centralizes its computing resources to a single repository where data is warehoused and processed. In contrast, the computational resources of a wireless monitoring system are spatially distributed across the
(a) (b)
Figure 6. (a) Signal conditioning circuit for band-pass filtering and amplification; (b) Wheatstone bridge circuit with amplification for strain gages.

9
network with a small amount of computing contained with each sensor. Local execution of embedded data interrogation algorithms at the sensor node is efficient from both a system management and energy perspective. For example, centralization of continuous structural response data at a centralized repository can be overwhelming to an engineer who might have interest in processing measurement data. In addition, because the wireless transceiver requires more energy to operate than a microcontroller, the transmission of raw structural response data represents a poor use of scarce battery energy installed with each sensor. As a result, embedded software is an important design element of wireless sensors intended for structural health monitoring. The development of embedded software (also termed firmware) can be delineated into two major parts: the operating system and engineering analysis software. The operating system written for the wireless sensor prototypes previously described consists of device drivers that automate the operation of the wireless sensor hardware. For example, device drivers are needed for all communication between the microcontroller and on-board peripherals such as the ADC, DAC, memory and wireless transceiver. A unique feature of the operating system embedded in the prototypes is that it is a multi-threaded operating system. A multi-threaded operating system, much like the operating systems installed on personal computers, can simultaneously execute multiple tasks. In the case of the wireless sensor, this means it can collect data as it also communicates with other wireless sensors using the wireless modem. The operating system is written in a high-level programming language (namely, C) while some time-critical tasks are written in the microcontroller’s assembly language (e.g., the Atmel AVR RISC instruction set). With a powerful operating system in-place, the remainder of the microcontroller flash memory can be used to store data processing algorithms. In the current implementation of the wireless sensor, more than 100 kB of flash memory is available to the engineer. This is generally sufficient for the embedment of many modal analysis and damage detection algorithms in the wireless sensor computational core. Currently, the wireless sensors are programmed with an extensive library of algorithms as summarized in Table 1. Many of the embedded algorithms included in the wireless sensor computational core can be combined to offer a wireless sensor an ability to conduct modal analysis/system identification, damage detection/health monitoring, model updating, and feedback control. For example, FFT, PP, SVD computational modules can be used to implement numerous modal analyses including mode shape determination by peak-picking, frequency domain
Table 1. Library of algorithms embedded in the computational core of the wireless sensor prototypes proposed for structural health monitoring.
Algorithm Application Fast Fourier Transform (FFT) • Modal analysis Peak Picking (PP) • Modal frequency identification Wavelet Transform (WT) • Damage detection
• Decorrelation prior to data compression
Autoregressive (AR) Modeling • System identification • Damage detection
AR with Exogenous Input (ARX) Modeling • System identification • Modal analysis
Singular Value Decomposition (SVD) • Modal analysis • Principle component analysis
Kalman Filter (KF) • State estimation • System identification • Feedback control
Linear Quadratic Regulation (LQR) • Feedback control Simulated Annealing (SA) • Model updating

10
decomposition (FDD) methods, and determination of modal damping by the random decrement (RD) technique [22]. The implementation of modal analysis in a wireless sensor network is a demanding computational task partly because mode shape determination requires insight into the structural response on both temporal and spatial scales. As a result, some communication of structural response must be shared between wireless sensors. To successfully implement modal analysis methods such as FDD in a dense network of wireless sensors, the amount of data communicated between sensors is minimized so as to reduce the chance of data loss and to minimize the amount of energy consumed by each device (since wireless communication is energy-intensive). Even if it was possible for each wireless sensor in the monitoring system to communicate its response data to a single node for modal analysis, the large amount of data and complexity of the analysis would exceed the computational resources available within a single node. As a result, the implementation of modal analysis on a wireless sensor network must embrace the idea of breaking computational tasks into smaller parts that can be distributed across the wireless sensor network and executed in parallel. For example, our implementation of mode shape determination by the FDD method decomposes the problem into smaller, 2-point mode shape problems to be solved between wireless sensor pairs. Once a set of overlapping 2-point mode shapes have been determined by the wireless sensor network, mode shape information is shared so that all nodes can stitch together the global mode shapes of the structure. This approach has been shown to be highly scalable, accurate in calculating mode shapes, and energy efficient by minimizing communication requirements [22]. 4. WIRELESS SENSORS DEPLOYED IN FULL-SCALE OPERATIONAL STRUCTURES Wireless monitoring systems are highly versatile and can be installed in most large-scale structures. To present the ease of installation in different structure types, three case studies are presented in this paper. First, instrumentation of the wireless monitoring system in a wind turbine system is presented. This test verifies the accuracy and reliability of an 8-node wireless sensor network configured as a wireless monitoring system. In the second case study, a 14-node wireless sensor network is installed in the long-span Geumdang highway bridge in Korea. The wireless monitoring system is used to record the response of the bridge to highway traffic in addition to verifying the ability of the wireless monitoring system to determine mode shapes of the bridge by the peak picking method. The last case study presented is that of a building. A cantilevered balcony within a historic theatre in Detroit, Michigan is instrumented with a 21-node wireless monitoring system to measure its dynamic properties. As part of that study, a distributed implementation of the FDD method for determining mode shapes is proven highly reliable and accurate. These case studies represent a small fraction of the structures instrumented to date with the prototype wireless monitoring system. A complete listing of the structures in which the monitoring system has been installed is presented in Table 2. 4.1 Vestas Wind Turbine, Germany Wind turbines are tall slender structures that are required to undergo harsh wind loads. Considering the complexity of the loading conditions imposed on wind turbines, there is interest in monitoring their structural response to loading while in operation. Empirical evidence of turbine behavior during operation can ultimately lead to more economical and energy-efficient designs. During April 2007, an instrumentation campaign was undertaken to install wireless sensors in a Vestas V80 turbine located along the northern shore of Germany [23]. The wind turbine has a total height of 78 m. Four wireless sensors proposed by Wang et al. [20] are installed along the height of the turbine’s internal steel tower. Interfaced to each wireless sensor are two accelerometers that record the lateral acceleration response of the turbine tower in two orthogonal directions. The four levels at which two accelerometers are installed are roughly 11, 28, 52 and 76 m above the base of the turbine foundation. Crossbow CXL01 accelerometers are selected for mounting to the internal wall of the turbine tower

11
because of their high sensitivity (1 V/g). To further enhance the sensitivity of the accelerometer, signal conditioning boards set to 20 times amplification were used with each accelerometer. An additional wireless sensor was included in the monitoring system configuration to measure strain at the base of the tower using standard 120 Ω metal foil strain gages (Texas Measurements YFLA-5-5L). For comparison purposes, two additional accelerometers (PCB 3701) are installed at the top of the turbine and interfaced to a traditional tethered data acquisition system (HBM-MGC Plus) using two 100 m long shielded wires. Shown in Figure 7 are acceleration time histories taken during normal operation of the turbine. To compare the performance of the wireless monitoring system to that of the tethered monitoring system, Figure 8 presents the acceleration at the top of the tower recorded by both monitoring systems. As is evident, the wireless monitoring system is accurate with one-to-one agreement in the recorded acceleration time-histories. 4.2 Geumdang Bridge, Korea To validate the performance of the wireless monitoring system proposed, a dense network of wireless sensor prototypes are installed during July 2005 in the Geumdang Bridge located in Icheon, Korea [24]. The bridge, constructed in 2002, spans 273 m across an irrigation valley in an agricultural region of South Korea. The bridge employs two structural systems to carry two lanes of southbound highway traffic. On the northern span (151 m), the 27 cm concrete bridge deck is supported by 4 pre-cast concrete I-beam sections. The southern span (122 m) is a continuous concrete box girder supported along its length by three concrete piers and a sloped retaining wall abutment.
Table 2. Structures instrumented with the prototype wireless monitoring system
Structure Date of Testing Testing Details Alamosa Canyon Bridge
New Mexico, USA May 2002 7 wireless sensors measuring girder
accelerations. Embedded FFT validated.
Geumdang Bridge Icheon, Korea
December 2004 July 2005
14 wireless sensors measuring box girder acceleration. Embedded peak picking mode shape estimation validated.
Grove Street Bridge Ypsilanti Michigan, USA
September 2005 12 wireless sensors measuring strain, 2 wireless sensors measure girder rotation, 16 wireless sensors measuring deck acceleration. Embedded peak picking mode shape estimation validated
Gi-Lu Bridge Nantou, Taiwain
March 2005 August 2007
12 wireless sensors measuring vertical and horizontal deck acceleration as well as cable vibrations.
Voigt Bridge San Diego, CA, USA
March 2006 20 wireless sensors measuring box girder acceleration. Embedded peak picking mode shape estimation validated.
Vestas Wind Turbine Germany
April 2007 8 wireless sensors measuring lateral acceleration along turbine height.
Historic Theatre Detroit, Michigan, USA
February 2007 21 wireless sensors to measure cantilever balcony acceleration. Embedded FFT, frequency domain decomposition and random decrement modal analysis methods validated.
Wu-Yuan Arch Bridge Xiamen, China
March 2007 12 wireless sensors measuring acceleration of the bridge

12
A wireless monitoring system assembled from 14 wireless sensors proposed by Wang et al. [20] is installed within the interior of the concrete box girder. Attached to each wireless sensor is a high sensitivity PCB Piezotronics 3801 accelerometer (sensitivity is 0.7 V/g) oriented to measure the vertical acceleration of the bridge. This accelerometer is selected because of its low noise floor (0.5 mg), bandwidth (80 Hz) and broad range (± 3g). During installation, the accelerometers are fixed to mounting plates that have been aligned orthogonal to gravity. Again, a signal conditioning circuit is used with each accelerometer to amplify its output by a factor of 20. The 14 wireless sensors are distributed evenly along both sides of the box girder span. (Figure 9). A laptop computer is used to
Figure 7. Vestas 2 MW wind turbine located in northern Germany. Shown are wireless sensor recorded accelerations at four levels along the turbine height in two orthogonal directions X and Y.
Figure 8. Comparison of Level 4 (76 m above the foundation) acceleration between a wireless and wired monitoring system.

13
serve as a coordinator of the wireless monitoring system (for example, initiate data collection and received sensor data). The laptop computer is installed in the vicinity of sensor location #7. In addition to the wireless monitoring system, the bridge is instrumented with a traditional wired monitoring system. The tethered monitoring system (National Instruments) employs a seismic accelerometer to record the bridge acceleration along one side of the bridge. The PCB Piezotronics 393 piezoelectric accelerometer is interfaced to the National Instruments data acquisition system. The noise floor of the PCB393 accelerometer is 0.05 mg while its sensitivity is high (10 V/g). Prior to interfacing with the National Instruments 12-bit data acquisition system, a PCB Piezotronics 481A03 signal analyzer is used to further amplify the accelerometer output by a factor of 10. To excite the structure, three trucks with calibrated weights are selected. The trucks are loaded until their total weights are 15, 30 and 40 tons. The bridge is kept closed to normal traffic during testing to ensure the trucks can cross the bridge without interruption. The trucks are commanded to travel across the bridge at fixed speeds ranging from 40 to 80 km/hr. During forced vibration testing, the wireless and tethered monitoring systems record the vertical bridge response. As shown in Figure 10, the wireless structural monitoring system provides identical acceleration recordings when compared to the tethered monitoring system. To identify the primary modal frequencies of the instrumented bridge span, the acceleration response time histories are transformed to the frequency domain using the embedded FFT algorithm. Upon calculation of the Fourier response spectra at each sensor location, an embedded peak picking algorithm is executed to identify modal frequencies. After frequencies are identified, the wireless sensors exchange their picked frequencies and collectively decide which frequencies are probable modal frequencies. Once the modal frequencies are decided, each wireless sensor transmits the imaginary component of their Fourier spectrum to the remainder of the network. The imaginary component of the complex-valued Fourier spectrum is correlated to the mode shape of the structure if the structure is lightly damped and modes are well separated. Referred to as the peak picking approach to mode shape estimation, minimal data exchange is required between wireless sensors, yet a
Pie
r 4
Ab
utm
ent
Pie
r 5
Pie
r 6
2 4 5 6 8 9
10 13 17
31
11 12 14 15 16 18
9.5m 9.5m 9.5m 9.5m 11.5m 11.5m 11.5m 11.5m 9.5m 9.5m 9.5m 9.5m
WirelessServer 7
TetheredServer
Wireless SensorTethered Sensor
Data Server
(a)
12.6 m
2.6 m
2o
ElastomericPad
AccelerometerLocation
(b) (c) (d)
Figure 9. (a) Location of wireless sensors installed along the length of the Geumdang Bridge; (b) external view of the bridge box girder; (c) cross section of the box girder; (d) typical wireless sensor-accelerometer installation.

14
highly accurate mode shape is derived. The final modes yielded by the wireless monitoring system are presented in Figure 11.
Figure 10. Comparison of box girder vertical acceleration recorded during forced excitation using a 40-ton truck driving at 60 km/hr (wireless versus wired monitoring systems).
0 50 100 1500
5
10
15
20
25
−1
0
1
MODE 12.98 Hz
0 50 100 1500
5
10
15
20
25
−1
0
1
MODE 24.35 Hz
0 50 100 1500
5
10
15
20
25
−1
0
1
MODE 35.03 Hz
0 50 100 1500
5
10
15
20
25
−1
0
1
MODE 47.03 Hz
Figure 11. First four modes of the Geumdang Bridge (3.0, 4.4, 5.0, and 7.0 Hz).

15
4.3 Historic Theatre, Detroit, Michigan A historic landmark theatre located in Detroit, Michigan is selected as an appropriate structure to validate the performance of the wireless monitoring system. In particular, a large cantilevered balcony (roughly 50 m wide) prone to excessive vibrations is instrumented with a network of 21 wireless sensors in February 2007 [22]. The wireless monitoring system is installed in 3 rows with 7 wireless sensors along each row; each row is separated by 3 m with the first row 3 m from the balcony edge (Figure 12). Attached to each wireless sensing unit is either a PCB Piezotronics 3801 capacitive accelerometer or a Crossbow CXL02LF1Z accelerometer oriented in the vertical direction. Again, a signal conditioning circuit is integrated with each wireless sensor-accelerometer pair to amplify the accelerometer output by a factor of 10. After installation of the wireless monitoring system, an engineer intentionally impacts the balcony by dropping their body weight (80 kg) onto their heels. This type of loading is performed by quickly raising and dropping both heels simultaneously. A sample set of accelerations recorded to consecutive heel drops are presented in Figure 13. A primary objective of testing in the historic theatre is to validate the embedded modal estimation algorithms embedded with each wireless sensor. Execution of the embedded algorithms are intended to yield the modal frequency, damping ratio and mode shapes of the balcony. Specifically, the peak picking embedded algorithm is used to identify modal frequencies from Fourier spectrum calculated at each sensor using an embedded FFT. As previously mentioned, modal frequencies are decided upon by the wireless sensor network after each wireless sensor communicates the top three peaks to the
Figure 12. Historic theatre balcony with 21 wireless sensors installed throughout the front-section of the balcony.
Figure 13. Acceleration at all 21 wireless sensor locations to consecutive heel drops.

16
remainder of the wireless sensor network. As shown in Figure 14, three different wireless sensors (at location #2, 4 and 20) identify different modal frequencies in their respective Fourier spectrum. After exchanging their peaks with each other, the wireless sensors collectively decide the modal frequencies of the balcony are 2.7, 4.2, 6.3 and 8.0 Hz. The FDD mode shape estimation method is executed by the wireless monitoring system to determine mode shapes. When implemented within a wireless sensing network, this method creates a large array of overlapping two-node mode shapes that can be easily assembled by a central node or server. Figure 15 displays four mode shapes identified using this decentralized FDD technique. 5. INTEGRATION OF WIRELESS SENSORS WITHIN CYBERINFRASTRUCTURES Recent advances in the field of computer science and information technology have allowed the earthquake engineering research community to propose the formation of on-line collaboratories where geographically separated researchers can be linked by internet technology. Examples of such collaboratories include the Network for Earthquake Engineering Simulation (NEES) in the United
Figure 14. Fourier response spectra calculated by wireless sensors located at sensor location 2, 4 and 20. Each wireless sensor determines three peaks in its calculated spectrum. After communicating identified peaks, the wireless monitoring system decides 2.7, 4.2, 6.3 and 8.0 Hz to be modal frequencies.
Figure 15. Mode shapes of the theatre balcony as determined by the wireless sensor network using a distributed version of the FDD mode shape estimation algorithm.

17
States, E-defense/E-grid in Japan, and the Korea Construction Engineering Development Program (KOCED). These collaboratories are offering advanced networking and data management tools to the civil engineering community; such tools can have a positive impact on the design of future structural health monitoring systems. To illustrate the opportunities that exist for wireless sensors within cyberinfrastructures, on-line data management tools offered by the NEES research community have been leveraged to: 1) offer anytime-anywhere delivery of wireless sensor data via the internet, 2) automate the process of storing sensor data in online data repositories, and 3) execute collaborative computing tasks between wireless sensors and simulation servers distributed on the internet. Our integration of wireless sensors within the NEES cyberenvironment is presented in Figure 16 [25]. An especially powerful feature of the NEES cyberenvironment is the use of a ring-buffered data repository. Termed Data Turbine (designed by Creare), this ring buffer can be accessed remotely by a web client to view both past data and streaming live data streams. In addition, Data Turbine will time
INTERNET
Wireless Sensor NetworkMonitoring a Structural Specimen
Data Acquisition Server
Network of OpenSees Servers
Point of Presence (PoP)
Real-Time Data Viewer
Figure 16. Integration of wireless sensors with the NEES cyberenvironment.
Figure 17. Screen shot of the RDV client with data shown from 5 different wireless sensors. Wireless sensors are installed upon a slab-column connection undergoing forced cyclic displacements to measure joint rotations and strain in buried reinforcement bars. Note, the wireless sensor streams are time synchronized with a video feed of the slab-column connection.

18
synchronize data accepted from multiple sources. In integrating wireless sensors within the NEES network, a data acquisition server with access to the internet is used to serve as a bridge between the wireless sensors and NEES. This data acquisition server collects wireless sensor data and passes, via internet sockets, time-stamped data to a NEES point-of-presence (PoP) server where Data Turbine is running. Once data is passed into the Data Turbine’s ring buffer, users can access the data using the Real-time Data Viewer (RDV) client. This client offers a rich visual depiction of buffered data including time lapsed play-back features of an archived data set. A screen shot of the RDV client showing wireless sensor data streams synchronized to a video feed of a large-scale test specimen is shown in Figure 17. 6. EXTENSION OF WIRELESS SENSORS FOR REAL-TIME FEEDBACK CONTROL Besides passively monitoring a structure for potential problems during operation, wireless networks may also actively control a structural system so as to eliminate undesirable effects. Such a permanently installed wireless control system could be used to mitigate damage to the structure during an extreme loading event such as a large earthquake. The combination of sensing, computation, and actuation capabilities in a wireless sensor allow the functionality of the controller to be replicated. A benefit of using wireless sensors for real-time feedback control is elimination of wiring typically employed for communication between sensors, actuators and the control system’s centralized controller. In this section of the paper, a summary of the authors’ experiences with real-time wireless feedback control for seismic disturbance rejection in civil structures is briefly presented.
6.1 Validation of Wireless Structural Control Experimental validation of embedded seismic structural control using wireless sensors was provided by Wang, et al. [26-28]. In this work, the wireless sensing unit designed by Wang, et al. [20] are modified to add an external actuation interface (Figure 18) and used to sense, compute control forces, and command collocated magnetorheological (MR) dampers to control a 3-story experimental shear structure excited on a laboratory shaking table. The experimental setup is illustrated in Figure 19. The structure is a half-scale, lumped-mass structure measuring 3m from floor to floor and is located at the National Center Research on Earthquake Engineering (NCREE) at National Taiwan University in Taipei, Taiwan. The lumped-mass structure is modeled using the equations of motion: )()()()()( ttttt puKzzCzM d +=++ &&& (1) where M, Cd, and K are 3×3 mass, damping, and stiffness matrices, respectively, z(t) is the 3-dimensional vector of lateral displacement, u(t) is the 3-dimensional control force vector, and p(t) is the 3-dimensional lateral force vector resulting from ground motion. The continuous-time state-space expression of the model is: wEpBuAxx +++=& , [ ]Tzzx &= (2) where
⎥⎦
⎤⎢⎣
⎡−−
= −−dCMKM
I0A 11
, ⎥⎦
⎤⎢⎣
⎡−
= −1M0
B , ⎥⎦
⎤⎢⎣
⎡=
10
E , (3)

19
x is the 6-dimensional state vector of story drifts and velocities and w is the 6-dimensional vector of process noise. The shaking table is 5m x 5m and is capable of actuation in 6 degrees-of-freedom though for these tests, only uniaxial longitudinal excitation is used. Three wireless sensing units are converted into control units and are placed on floors that are equipped with MR-dampers: the base, Floor 1, and Floor 2. The sensing unit on Floor 3 is responsible for data collection only; therefore it is not altered to enable actuation. All floors, including the base are outfitted with velocity meters that feedback absolute velocity signals to each unit. A centralized computer serves as the command server to coordinate the actions of the wireless network with the shaking table and to collect experimental data
Figure 18. Wireless Sensing unit designed by Wang, et al. [20] modified for real-time feedback control. An external actuation interface has been added to the unit.
Ci: Wireless control unit (with one wireless transceiver included)
Si: Wireless sensing unit (with one wireless transceiver included)
Ti: Wireless transceiver
Di: MR Damper
Vi: Velocity meter
S3
C1
C0T0Lab experiment
command server D0
C2
D2
Floor-0
Floor-1
Floor-2
Floor-3
V0
V1
V2
V3
D1
Figure 19. Experimental set-up for wireless feedback control of a 3-story lumped-mass structure. Control units command 3 collocated MR-Dampers.

20
at the end of every test. This computer however, does not participate in the feedback control process in any way during the test. Centralized, partially-decentralized, and fully-decentralized control models are explored in this study. Under the centralized model, each wireless unit transmits its measured data to the network and then waits to receive the data from the remaining units in order to calculate a control force. This process can be very slow with the time required to transmit and process a packet being nearly 18 ms thereby reducing the sampling/actuation frequency to 12.5Hz. The control force calculated is the result of a linear-quadratic regulator (LQR) controller weighted to minimize interstory drifts during the seismic disturbance. The primary objective of the LQR problem is to minimize a global cost function, J(u), by selecting an optimal control force trajectory:
[ ] [ ] [ ] [ ]∑∞
=
+=1
TT )()(n
kkkkJ RuuQxxu (4)
where Q and R are positive definite matrices that provide weight to competing goals: minimize control force using larger relative elements of R, and maximize control performance using larger corresponding relative elements of Q. The control force vector, u(t), is proportional to the state vector, x(t); the two are related by the control gain matrix: Gxu −= (5) where G is calculated by: )()( T1T SABRSBBG −+= (6) and S is the solution of the Riccati equation: 0)())(( T1TTT =++−− − QSABRSBBSBASSAA (7) with the limitations that the pair (A,B) is stabilizable and Q and A have no unobservable modes on the unit circle. But because of the practical difficulties in measuring displacement of a real structure, that data is not provided to the sensing units. Therefore the LQR derived control gain must be constrained such that it is only dependent upon the observed quantities, y(t) Gyu −= . (8) In the case of the centralized model, the observed quantities are the floor velocities at every level, including the base or Cxy = (9) where [ ] [ ][ ]I0C = . (10) In addition to the centralized control case, a partially-decentralized control model is tested in which sensing units no longer transmit their data to the entire network but instead, to local area sub-networks. This limit in information will further constrain the LQR control formulation resulting in a less optimal control solution. However, the decrease in transmissions and receptions required under this model allow for faster control steps and a higher sampling/actuation rate, up to 16.67Hz thus, improving control performance.
21
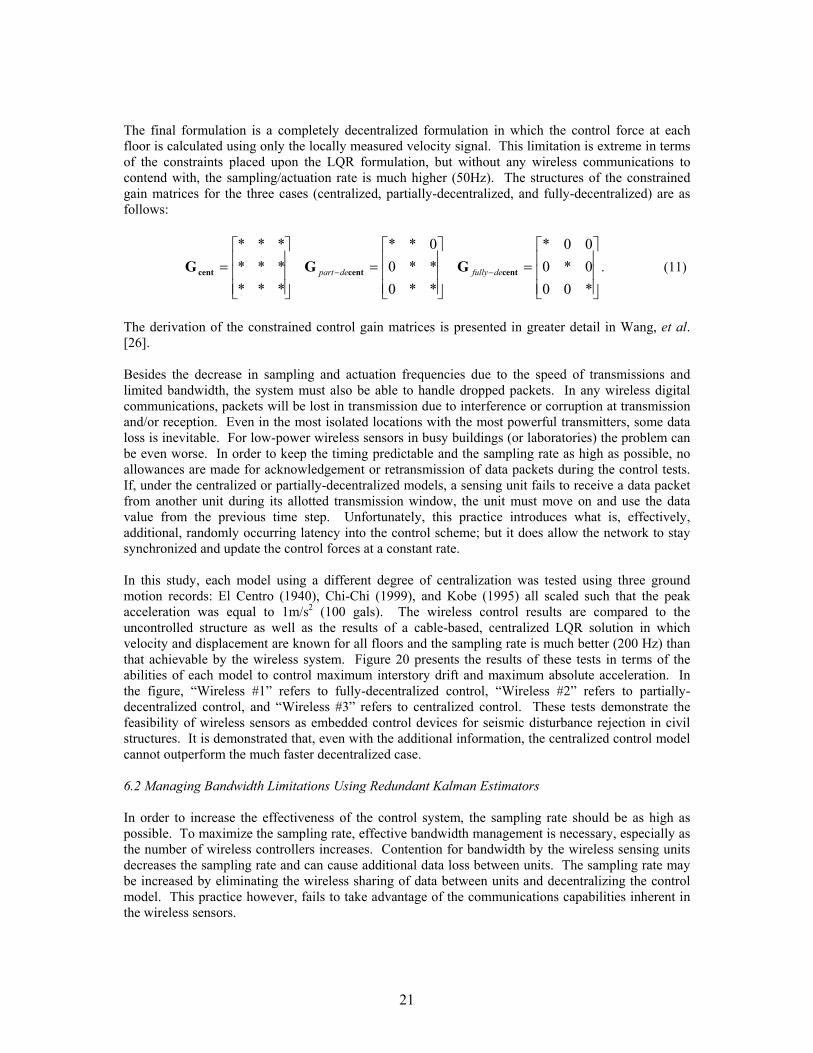
The final formulation is a completely decentralized formulation in which the control force at each floor is calculated using only the locally measured velocity signal. This limitation is extreme in terms of the constraints placed upon the LQR formulation, but without any wireless communications to contend with, the sampling/actuation rate is much higher (50Hz). The structures of the constrained gain matrices for the three cases (centralized, partially-decentralized, and fully-decentralized) are as follows:
⎥⎥⎥
⎦
⎤
⎢⎢⎢
⎣
⎡=
⎥⎥⎥
⎦
⎤
⎢⎢⎢
⎣
⎡=
⎥⎥⎥
⎦
⎤
⎢⎢⎢
⎣
⎡= −−
*000*000*
**0**00**
*********
centcentcent GGG defullydepart . (11)
The derivation of the constrained control gain matrices is presented in greater detail in Wang, et al. [26]. Besides the decrease in sampling and actuation frequencies due to the speed of transmissions and limited bandwidth, the system must also be able to handle dropped packets. In any wireless digital communications, packets will be lost in transmission due to interference or corruption at transmission and/or reception. Even in the most isolated locations with the most powerful transmitters, some data loss is inevitable. For low-power wireless sensors in busy buildings (or laboratories) the problem can be even worse. In order to keep the timing predictable and the sampling rate as high as possible, no allowances are made for acknowledgement or retransmission of data packets during the control tests. If, under the centralized or partially-decentralized models, a sensing unit fails to receive a data packet from another unit during its allotted transmission window, the unit must move on and use the data value from the previous time step. Unfortunately, this practice introduces what is, effectively, additional, randomly occurring latency into the control scheme; but it does allow the network to stay synchronized and update the control forces at a constant rate. In this study, each model using a different degree of centralization was tested using three ground motion records: El Centro (1940), Chi-Chi (1999), and Kobe (1995) all scaled such that the peak acceleration was equal to 1m/s2 (100 gals). The wireless control results are compared to the uncontrolled structure as well as the results of a cable-based, centralized LQR solution in which velocity and displacement are known for all floors and the sampling rate is much better (200 Hz) than that achievable by the wireless system. Figure 20 presents the results of these tests in terms of the abilities of each model to control maximum interstory drift and maximum absolute acceleration. In the figure, “Wireless #1” refers to fully-decentralized control, “Wireless #2” refers to partially-decentralized control, and “Wireless #3” refers to centralized control. These tests demonstrate the feasibility of wireless sensors as embedded control devices for seismic disturbance rejection in civil structures. It is demonstrated that, even with the additional information, the centralized control model cannot outperform the much faster decentralized case. 6.2 Managing Bandwidth Limitations Using Redundant Kalman Estimators In order to increase the effectiveness of the control system, the sampling rate should be as high as possible. To maximize the sampling rate, effective bandwidth management is necessary, especially as the number of wireless controllers increases. Contention for bandwidth by the wireless sensing units decreases the sampling rate and can cause additional data loss between units. The sampling rate may be increased by eliminating the wireless sharing of data between units and decentralizing the control model. This practice however, fails to take advantage of the communications capabilities inherent in the wireless sensors.

22
In a novel partially-decentralized control scheme first proposed by Yook et al. [29] for mechanical systems, wireless controllers each running identical Kalman estimators compare their measured output to the estimated state value calculated during the previous control step. Should that error exceed a predetermined threshold, the unit replaces the estimated value with the measured value for use in control force and future estimation computations. At the same time, the unit broadcasts the measured value for the rest of the network to use. The redundant, identical Kalman estimators ensure that the control units remain synchronized with the same state vector estimates and that the errors on all units
Figure 20. Maximum interstory drift and acceleration of the 3-story structure as a function of control model for three earthquake records: (a) El Centro NS (1940), (b) Chi-Chi NS (1999), and (c) Kobe NS (1997).

23
remain bounded by the same error threshold. By broadcasting only when the estimation error is relatively large, bandwidth is traded for accuracy and control performance. As the error threshold is reduced, more and more transmissions are required and the performance of the system converges on that of a centralized control system. On the other end, as the error threshold increases, fewer and fewer packets are sent and the performance approaches that of a decentralized control system. A further advantage of this approach is, in the case of dropped packets, the estimated state values are still available to the units which are preferable to recycling data from previous control steps. In the study by Swartz and Lynch [30], this concept was adapted for seismic disturbance rejection in civil engineering structures. Using the Narada wireless sensing unit, the partially-decentralized control solution was implemented on the half-scale three-story test structure at NCREE (Figure 21). Narada units are located on the base, first floor, and second floor and are set to measure interstory velocity. The wireless sensing units then command their collocated MR-Dampers based on an LQR derived control gain using the full state-vector, x, as in equation 5. The units measure local interstory velocity and calculate estimates of the full interstory state-vector based on identically derived estimator models. The structure of the estimator is: ][][ˆ]1[ˆ kkk yBxAx estest +=+ (12) where k is the current time step, )( LDGLCBGAAest +−−= LBest = (13)
Figure 21. Experimental set-up for wireless control using interstory drift and redundant Kalman estimators.

24
and L is the steady-state Kalman estimation gain matrix, in this case, derived using the Matlab kalman.m command for the discrete-time system. The error threshold that triggers data transmission on each unit is then varied over repeated runs of the El Centro (1940) record (normalized to a peak acceleration of 1m/s2). The response of the structure is recorded over that range of error thresholds and normalized by the uncontrolled response of the structure. Cost functions based on the normalized structural response are used to measure the performance of the controller in reducing undesirable seismic responses. These cost functions are adapted from Ohtori, et al. [31]. J1 is based on maximum drift:
|)(|max
|)(|max
,
,
eduncontrolltFloor
controlledtFloor
d
dJ1 = , (14)
J2 on normed drift:
|)norm(|
|)norm(|2
eduncontroll
controlled
dd
=J , (15)
J3 maximum acceleration:
|)(|max
|)(|max3
,
,
eduncontrolltFloor
controlledtFloor
z
zJ
&&
&&= , (16)
J4 normed acceleration:
|)norm(|
|)norm(|4
eduncontroll
controlled
zz&&
&&=J , (17)
J5 maximum base shear:
|)max(|
|)max(|5
WzWz
eduncontroll
controlled
&&
&&=J , (18)
J6 normed base shear:
|)norm(|
|)norm(|Wz
Wz
eduncontroll
controlled
&&
&&=J6 , (19)
J7 control force, u(t), (normalized to the seismic weight of the building, W, as the uncontrolled building has zero control force applied):

25
)(
|))(max(|7W
u tJ = , (20)
J8 average kinetic and strain energy:
eduncontroll
N
iii
controlled
N
iii
N
NJ
⎥⎦
⎤⎢⎣
⎡⎥⎦
⎤⎢⎣
⎡
⎥⎦
⎤⎢⎣
⎡⎥⎦
⎤⎢⎣
⎡
=
∑
∑
=
=
1
T
1
T
1
1
8x
M00K
x
xM00K
x, (21)
and J9 is based on number of data transmissions (normalized to the number of transmission that would be sent in a centralized control test of the same length):
))(#(#)(#
UnitsWirelessStepsTimeSentonsTransmissiDataJ8 = , (22)
The cost functions are used to show the transition between centralized and decentralized performance. In very recent work on a new 6-story structure (Figure 22), the redundant Kalman estimator system was tested on a larger network using velocity relative to ground for feedback. The speed of the network, even with 7 nodes, is 30 Hz due to adoption of the IEEE802.15.4 wireless modem. The
10−5
100
105
0.6
0.8
1Cost Function, J1
J
Error Threshold10
−510
010
50.4
0.6
0.8Cost Function, J2
J
Error Threshold10
−510
010
51
1.5
2Cost Function, J3
J
Error Threshold
10−5
100
105
0.70.80.9
Cost Function, J4
J
Error Threshold10
−510
010
5
0.6
0.8
1Cost Function, J5
J
Error Threshold10
−510
010
50.5
0.6
0.7Cost Function, J6
J
Error Threshold
10−5
100
105
0
0.5
1Cost Function, J7
J
Error Threshold10
−510
010
50
0.5
1Cost Function, J8
J
Error Threshold10
−510
010
5
0
0.5
1
Cost Function, J9
J
Error Threshold
(a) (b)
Figure 22. (a) Test structure with 6 DOFs. Narada wireless sensing units run identical Kalman estimators and command collocated MR-Dampers. (b) Experimental cost function as a function of error threshold (m/s) of the 6 DOF system. Results obtained using El Centro NS (1940) scaled to 1.0 m/s2 (gals).

26
resulting cost functions for the 6-story structure are presented in Figure 22(b) showing a decrease in performance as the error threshold is increased and the network transmits less data from unit to unit. These results confirm the plausibility of using an error threshold and redundant Kalman estimators as a rational means of utilizing the available bandwidth to improve control performance over what can be accomplished using a fully-decentralized control scheme. 7. CONCLUSIONS From the results presented in this paper, is can be seen that wireless sensors, with their on-board computational capacities function as more than merely a low-cost alternative to traditional cable-based sensors (though they do function well in that capacity). Leveraging the collocated computational capacity of the sensors allows the wireless sensors to perform automatic data interrogation tasks that may otherwise require extensive hours by a trained professional. Low cost wireless sensors allow for the implementation of very dense sensor networks for monitoring civil engineering assets generating what can become overwhelming amounts of data. The automated, on-board interrogation of this data can make it more manageable and give officials and the public an immediate warning in the case of possible damage or deficiency in a civil infrastructure system such as a bridge, skyscraper, or levee. The extension of wireless sensing to wireless real-time feedback control allows the structure to react to external stimuli such as earthquakes in order to reduce the effects of undesirable vibrations. By working to increase the capabilities, reliability, and economy of wireless monitoring technology for civil infrastructure systems, it is the authors’ hope that they will become available for asset owners to widely adopted so as to protect those civil assets and the public at large. 8. ACKNOWLEDGEMENT The work presented in this paper has been supported by the National Science Foundation (NSF) through grant numbers CMMI 0421180, CMMI 0528867, and CMMI 0633982, and the Office of Naval Research (ONR) through the Young Investigator Program. Additional support has been offered by the Horace H. Rackham School of Graduate Studies at the University of Michigan. The authors would like to acknowledge the assistance offered by the graduate students of the Laboratory for Intelligent Structural Technology (LIST) at the University of Michigan including Tsung-Chin Hou, Kenneth J. Loh and Junhee Kim. The design of the wireless sensors presented in this work was done in close collaboration with Prof. Kincho H. Law (Stanford University) and Prof. Yang Wang (Georgia Institute of Technology). Mr. Michihito Shiraishi (Institute of Technology, Shimizu Corporation) has contributed to the development of embedded data interrogation algorithms (namely, system identification algorithms) for the wireless sensor prototypes. The authors are indebted to Prof. C. H. Loh (National Taiwan University) and Prof. Chung-Bang Yun (Korea Advanced Institute for Science and Technology) for providing opportunities to conduct laboratory and field testing of our wireless sensors on numerous occasions. Close collaboration with Dr. Chuck Farrar (Los Alamos National Laboratory), Prof. Hoon Sohn (Korea Advanced Institute for Science and Technology), Prof. Dawn Tilbury (University of Michigan), Prof. Ahmed Elgamal (University of California San Diego), Dr. Micheal Fraser (University of California San Diego), and Prof. Ying Lei (Xiamen University) have all been beneficial to the advancement of wireless sensing technology for civil structures. Finally, the second author would like to thank Prof. Ayaho Miyamoto of Yamaguchi University for extending the invitation to attend the 5th Infrastructure and Environmental Management Symposium as a guest lecturer. 10. REFERENCES [1] MnDOT, Interstate 35w Mississippi River Bridge Fact Sheet,
http://www.dot.state.mn.us/i35wbridge/pdfs/factsheet.pdf (accessed on: August 13, 2007). [2] Wardhana, K. and Hadipriono, F. C., "Analysis of Recent Bridge Failures in the United States",
Journal of Performance of Constructed Facilities, Vol. 17, No. 3, 2003, pp. 144-150.

27
[3] Dicker, D., "Point Pleasant Bridge Collapse Mechanism Analyzed", Civil Engineering, Vol. 41, No. 7, 1971, pp. 61-66.
[4] Rolander, D. D., Phares, B. M., Graybeal, B. A., Moore, M. E. and Washer, G. A., "Highway Bridge Inspection: State-of-the-Practice Survey", Transportation Research Record, Vol. 1749, No. 1, 2001, pp. 73-81.
[5] FHWA, Status of the Nation's Highways, Bridges, and Transit: Conditions & Performance, Report # FHWA-PL-03-004, Federal Highway Administration, Washington, D. C., 2003.
[6] Chang, S.-P., "Application of the Structural Health Monitoring System to the Long Span Cable-Supported Bridges", Third International Conference on Bridge Maintenance, Safety and Management (IABMAS06), Porto, Portugal, 2006.
[7] Hansfard, M., Fleming, D., Paranhos, P. and Chrimes, M., "Portuguese Bridge Disaster Blamed on Illegal Dredging", Portuguese Bridge Disaster Blamed on Illegal Dredging, http://www.nceplus.co.uk/news/fast_news/?pid=2&aid=13009&sid=47&ChannelID=4 (accessed on: September 1, 2007).
[8] Moore, M., Phares, B., Graybeal, B., Rolander, D. and Washer, G., Reliability of Visual Inspection for Highway Bridges, Report # FHWA-RD-01-020, Federal Highway Administration, Washington D. C., 2001.
[9] Hipley, P., "Caltrans’ Current State-of-Practice", Proceedings of Instrumental Systems for Diagnostics of Seismic Response of Bridges and Dams, Richmond, CA, 2001.
[10] Ko, J. M. and Ni, Y. Q., "Technology Developments in Structural Health Monitoring of Large-Scale Bridges", Engineering Structures, Vol. 27, No. 12, 2005, pp. 1715-1725.
[11] Tamura, K., "Instrument Systems of Major Bridges in Japan", Proceedings of Instrumental Systems for Diagnostics of Seismic Response of Bridges and Dams, Richmond, CA, 2001.
[12] Ou, J., Zhao, X., Li, H., Zhou, Z., Zhang, Z. and Wang, C., "Health Monitoring of Binzhou Yellow River Highway Bridge Using Fiber Bragg Gratings", Proceedings of SPIE - The International Society for Optical Engineering, San Diego, CA, 2005.
[13] Celebi, M., Seismic Instrumentation of Buildings with Emphasis on Federal Buildings, Report # 0-7460-68170, United States Geological Survey, Menlo Park, CA, 2002.
[14] Straser, E. and Kiremidjian, A. S., Modular, Wireless Damage Monitoring System for Structures, Report # 128, John A. Blume Earthquake Engineering Center, Stanford, CA, 1998.
[15] Lynch, J. P. and Loh, K., "A Summary Review of Wireless Sensors and Sensor Networks for Structural Health Monitoring", Shock and Vibration Digest, Vol. 38, No. 2, 2006, pp. 91-128.
[16] Spencer, B. F., Ruiz-Sandoval, M. E. and Kurata, N., "Smart Sensing Technology: Opportunities and Challenges", Journal of Structural Control and Health Monitoring, Vol. 11, No. 4, 2004, pp. 349-368.
[17] Lynch, J. P., Decentralization of Wireless Monitoring and Control Technologies for Smart Civil Structure, Report # 140, John A. Blume Earthquake Engineering Center, Stanford, CA, 2002.
[18] Lynch, J. P., Sundararajan, A., Law, K. H., Kiremidjian, A. S., Kenny, T. and Carryer, E., "Embedment of Structural Monitoring Algorithms in a Wireless Sensing Unit", Structural Engineering and Mechanics, Vol. 15, No. 3, 2003, pp. 285-297.
[19] Lynch, J. P., "Design of a Wireless Active Sensing Unit for Localized Structural Health Monitoring", Journal of Structural Control and Health Monitoring, Vol. 12, No. 3-4, 2004, pp. 405-423.
[20] Wang, Y., Lynch, J. P. and Law, K. H., "A Wireless Structural Health Monitoring System with Multithreaded Sensing Devices: Design and Validation", Structure and Infrastructure Engineering, Vol. 3, No. 2, 2007, pp. 103-120.
[21] Swartz, R. A., Jung, D., Lynch, J. P., Wang, Y., Shi, D. and Flynn, M. P., "Design of a Wireless Sensor for Scalable Distributed in-Network Computation in a Structural Health Monitoring System", 5th International Workshop on Structural Health Monitoring, Stanford, CA, 2005.
[22] Zimmerman, A., Swartz, R. A., Saftner, D. A., Lynch, J. P., Shiraishi, M. and Setareh, M., "Parallel Data Processing Architectures for Identification of Structural Modal Properties Using Dense Wireless Sensor Networks", Proceedings of the World Forum on Smart Materials and Smart Structures Technology, Chongqing, China, 2007.

28
[23] Rolfes, R., Zerbst, S., Haake, G., Reetz, J. and Lynch, J. P., "Integral SHM-System for Offshore Wind Turbines Using Smart Wireless Sensors", 6th International Workshop on Structural Health Monitoring Stanford, CA, 2007.
[24] Lynch, J. P., Wang, Y., Loh, K., Yi, J. H. and Yun, C. B., "Performance Monitoring of the Geumdang Bridge Using a Dense Network of High-Resolution Wireless Sensors", Smart Materials and Structures, Vol. 15, No. 6, 2006, pp. 1561-1575.
[25] Zimmerman, A. T. and Lynch, J. P., "Data Driven Model Updating Using Wireless Sensor Networks", Proceedings of the 3rd Annual ANCRiSST Workshop, Reno, NV, 2006.
[26] Wang, Y., Swartz, R. A., Lynch, J. P., Law, K. H., Lu, K. C. and Loh, C. H., "Decentralized Civil Structural Control using Real-time Wireless Sensing and Embedded Computing," Smart Structures and Systems, Vol. 3, No. 3, 2006, pp. 321-340.
[27] Wang, Y., Swartz, R. A., Lynch, J. P., Law, K. H., and Loh, C. H., "Performance Evaluation of Decentralized Wireless Sensing and Control in Civil Structures," SPIE 14th Annual International Symposium on Smart Structures and Materials, San Diego, CA, 2006.
[28] Wang, Y., Swartz, R. A., Lynch, J. P., Law, K. H., Lu, K. C. and Loh, C. H., "Decentralized Real-time Velocity Feedback Control of Structures using Wireless Sensors," Proceedings of the 4th International Conference on Earthquake Engineering, Taipei, Taiwan, 2006.
[29] Yook, J.K., Tilbury, D.M. and Soparkar, N.R., “Trading computation for bandwidth: reducing communication in distributed control systems using state estimators,” IEEE Transactions on Control Systems Technology, Vol. 10, No. 4, 2002, pp. 503-518.
[30] Swartz, R. A. and Lynch, J. P., "Redundant Kalman Estimation for a Distributed Wireless Structural Control System," Proceedings of the US-Korea Workshop on Smart Structures Technology for Steel Structures, Seoul, Korea, 2006.
[31] Ohtori, Y., Christenson, R. E., and Spencer, B. F., Jr., “Benchmark control problems for seismically excited nonlinear buildings,” Journal of Engineering Mechanics, Vol. 130, No. 4, 2004, pp. 366-385.