1 student success plans regional meeting february 9, 2007 youngstown state university office of...
TRANSCRIPT
1
Student Success PlansRegional MeetingFebruary 9, 2007
Youngstown State University
Office of Assessment
Sharon Stringer [email protected]
Heather DiGregorio [email protected]

2
Structure of the Assessment Process at YSU
3
Assessment Process Overview Step One: Fall 2003
Design and Review Student Learning Outcomes Step Two: Spring 2004
Design, Review, and Revise Assessment Plans Step Three: 2004-2005
Implementation of Assessment Plans:
Monitor Progress and Visit/Assist Departments
4
Assessment Process Overview cont’d
Step Four: 2005-2006 & on an annual basis Review of Data on Student Learning
in Departmental Assessment Reports and
Provision of Feedback to Academic Departments

5
Step One: Design and Review Student Learning Outcomes During the Fall semester of 2003, departments
submitted their learning outcomes for each of their degree programs
Assessment Council members reviewed each submission, using a rubric to evaluate whether the learning outcomes are clear, distinct, and measurable for each degree program
Council provided written feedback to each department by the end of February 2004

6
Step Two: Design, Review, and Revise Assessment Plans
Spring semester of 2004 departments submitted assessment plans
Assessment Council reviewed and provided feedback on assessment plans by May 2004

7
Step Two: Design, Review, and Revise Assessment Plans cont’d
Plans were to include: A minimum of four program learning outcomes Links between the learning outcomes and
departmental Mission and Goals Tools for measuring student learning outcomes Timeline for implementing the assessment plan Methods for data aggregation Descriptions of the feedback loop for program
improvement
8
Step Three: Implementation of Assessment Plans The primary goal was to help all departments
revise (if improvements were needed) and implement their assessment plans
Office of Assessment collated examples of planning tools and data aggregation on student learning at YSU
9
Step Three: Implementation of Assessment Plans An example of a planning tool (PASS Map) An example of a data aggregation form
(Excerpt from Spring 2004 Assessment Plan, Department of Psychology)

10
Step Three: Implementation of Assessment Plans cont’d
Sharing models, the Assessment Council continued to send feedback and periodic reminders of deadlines so that data on student learning would be collected on an ongoing basis
These data would be summarized in the assessment reports due September 30 of every academic year
11
Primary Goal for 2005-2006 Implemented Step Four: Reviewed data on student
learning in departmental assessment reports and provided feedback to academic departments
Assessment Council performed a careful review of incoming departmental reports that provided aggregate data on student learning in undergraduate and graduate programs
The Assessment Council continued to improve the ongoing feedback cycle
12
Background Information Every department used the same standard
template to write assessment reports Departments that undergo accreditation
review by their primary discipline were asked to provide relevant sections of their most recent accreditation report to the Council
Assessment Council members worked with one of five teams to review the departments’ reports using a standard rubric
13
Examples from YSU Assessment Reports
14
Presentation of Data
15
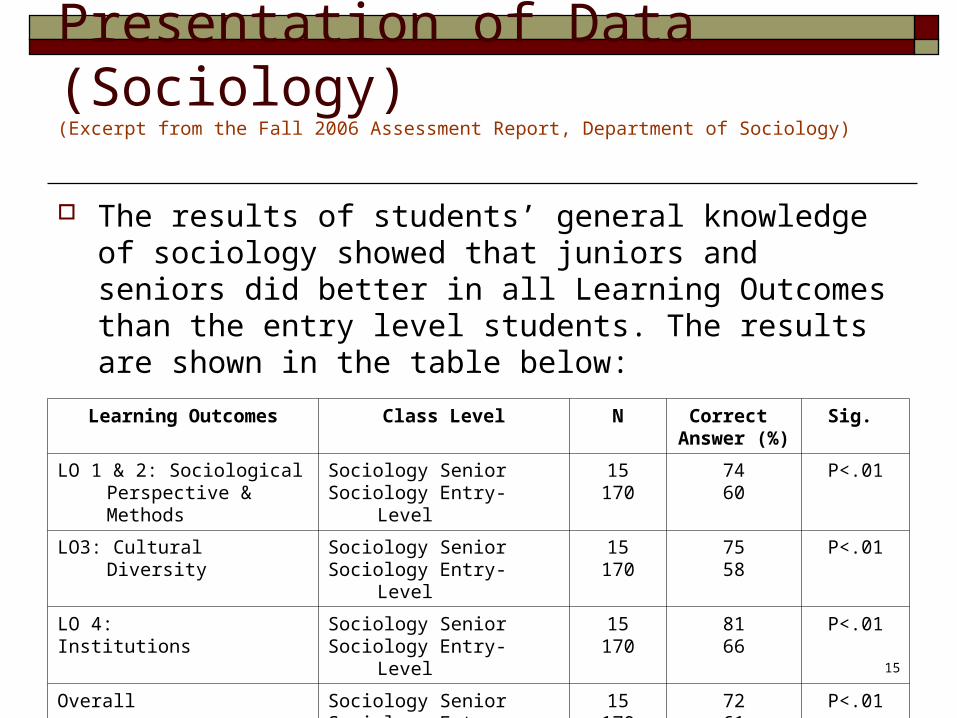
Learning Outcomes Class Level N Correct Answer (%)
Sig.
LO 1 & 2: Sociological Perspective & Methods
Sociology SeniorSociology Entry-Level
15170
7460
P<.01
LO3: Cultural Diversity Sociology SeniorSociology Entry-Level
15170
7558
P<.01
LO 4: Institutions
Sociology SeniorSociology Entry-Level
15170
8166
P<.01
Overall Sociology SeniorSociology Entry-Level
15170
7261
P<.01
Presentation of Data (Sociology)(Excerpt from the Fall 2006 Assessment Report, Department of Sociology)
The results of students’ general knowledge of sociology showed that juniors and seniors did better in all Learning Outcomes than the entry level students. The results are shown in the table below:
16
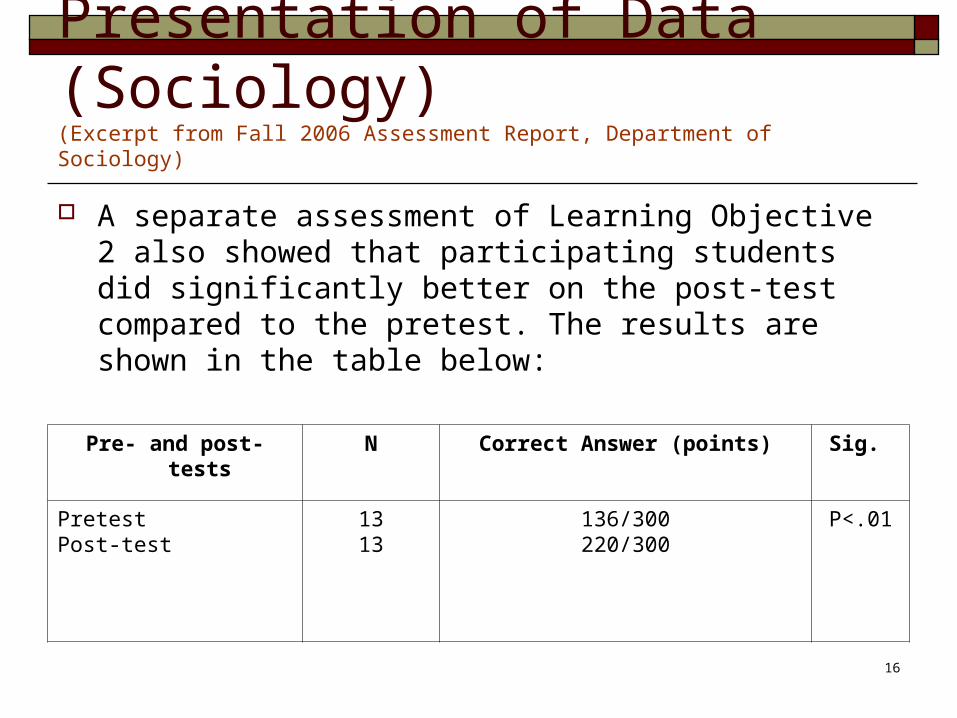
Pre- and post-tests N Correct Answer (points) Sig.
PretestPost-test
1313
136/300220/300
P<.01
Presentation of Data (Sociology)(Excerpt from Fall 2006 Assessment Report, Department of Sociology)
A separate assessment of Learning Objective 2 also showed that participating students did significantly better on the post-test compared to the pretest. The results are shown in the table below:
17
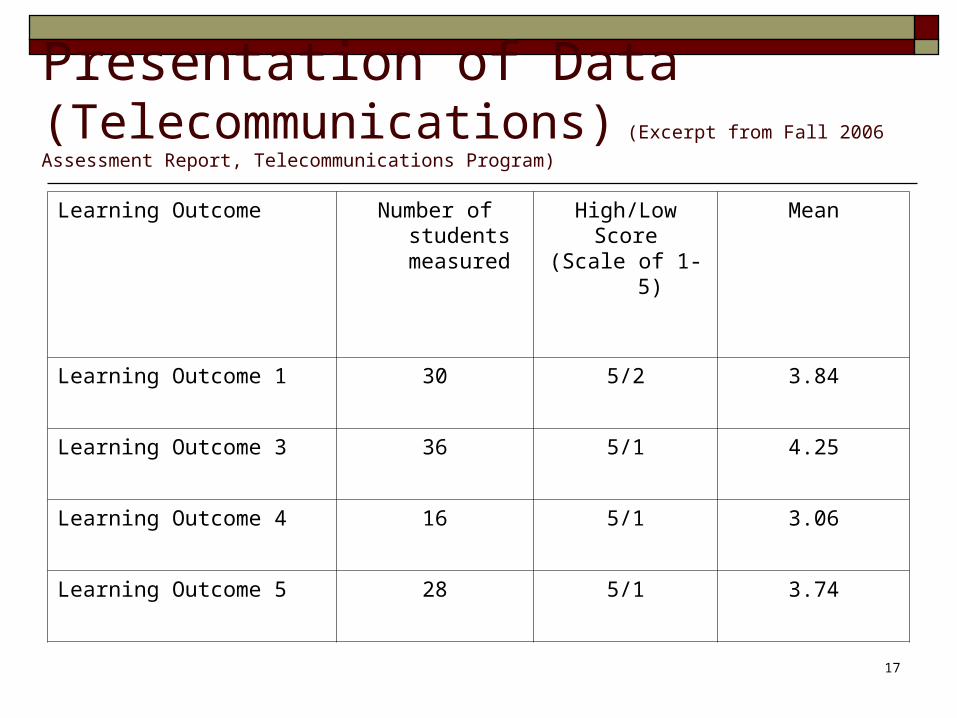
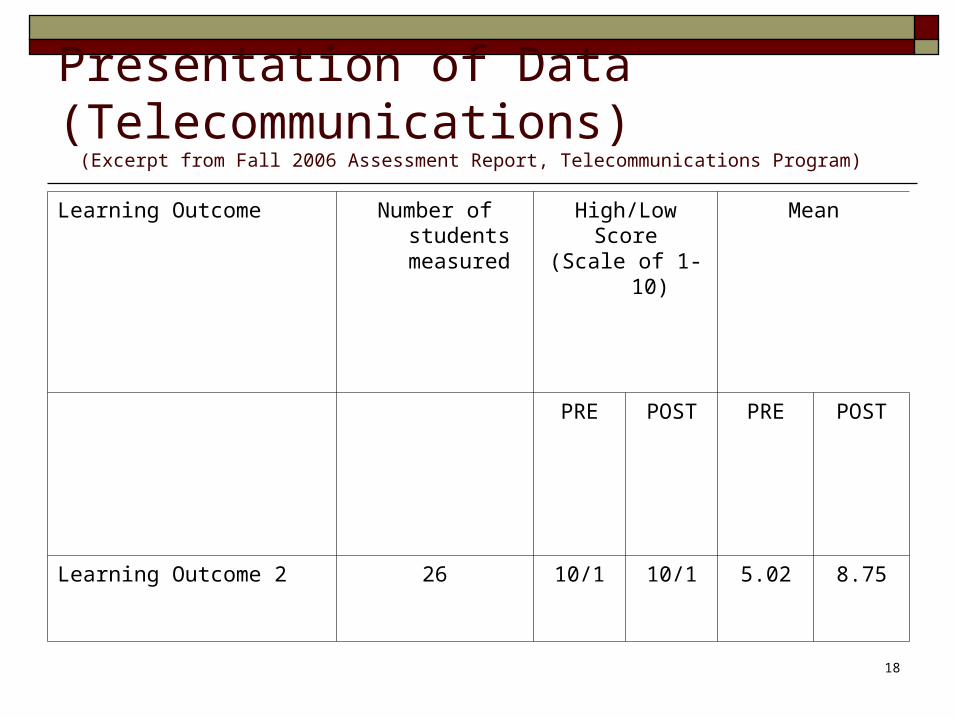
Presentation of Data (Telecommunications)
(Excerpt from Fall 2006 Assessment Report, Telecommunications Program)
Learning Outcome Number of students measured
High/LowScore
(Scale of 1-5)
Mean
Learning Outcome 1 30 5/2 3.84
Learning Outcome 3 36 5/1 4.25
Learning Outcome 4 16 5/1 3.06
Learning Outcome 5 28 5/1 3.74
18
Learning Outcome Number of students measured
High/LowScore
(Scale of 1-10)
Mean
PRE POST PRE POST
Learning Outcome 2 26 10/1 10/1 5.02 8.75
Presentation of Data (Telecommunications) (Excerpt from Fall 2006 Assessment Report, Telecommunications Program)
19
Evaluation of Data

20
Presentation of Strengths (Dietetics)(Excerpt from Fall 2006 Assessment Report, Dietetic Technology Program)
As identified from student/graduate surveys and course evaluations: Curriculum University facilities and faculty Seamless articulation from the 2 year program to the 4 year program Program fills a need for the non-traditional student Supervised practice sites and preceptors Credit for prior learning and work experience
As identified by faculty/preceptors: University support of the programs Dedicated preceptors Varied supervised practice sites University support of the preceptors
As identified by employers: The program fills the community workforce needs Graduates have a good base of knowledge Graduates display professionalism
21
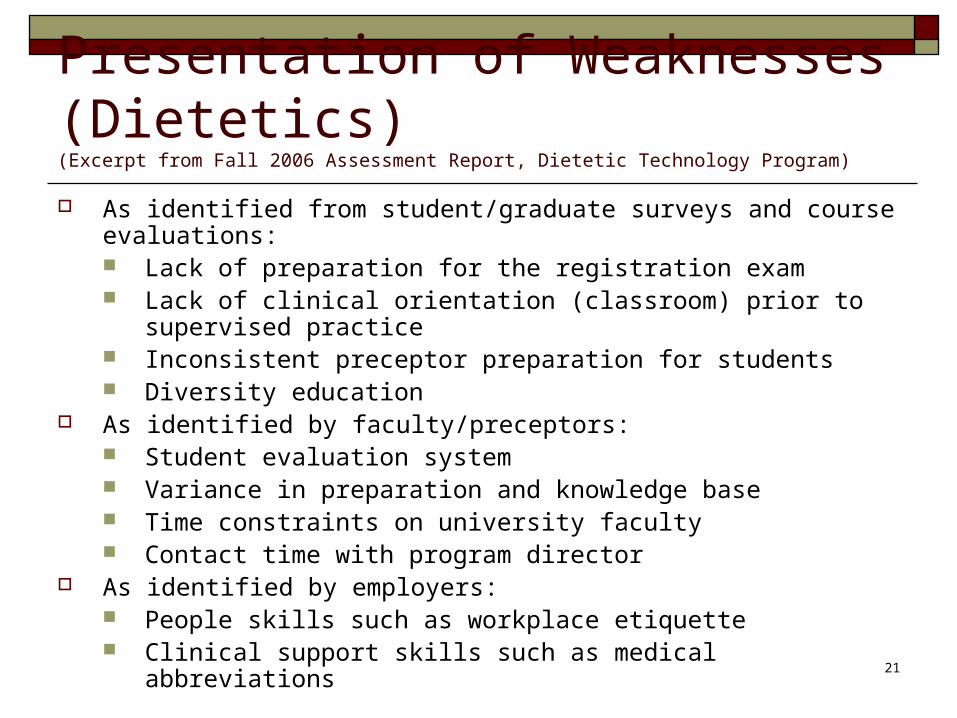
Presentation of Weaknesses (Dietetics)(Excerpt from Fall 2006 Assessment Report, Dietetic Technology Program)
As identified from student/graduate surveys and course evaluations: Lack of preparation for the registration exam Lack of clinical orientation (classroom) prior to supervised practice Inconsistent preceptor preparation for students Diversity education
As identified by faculty/preceptors: Student evaluation system Variance in preparation and knowledge base Time constraints on university faculty Contact time with program director
As identified by employers: People skills such as workplace etiquette Clinical support skills such as medical abbreviations
22
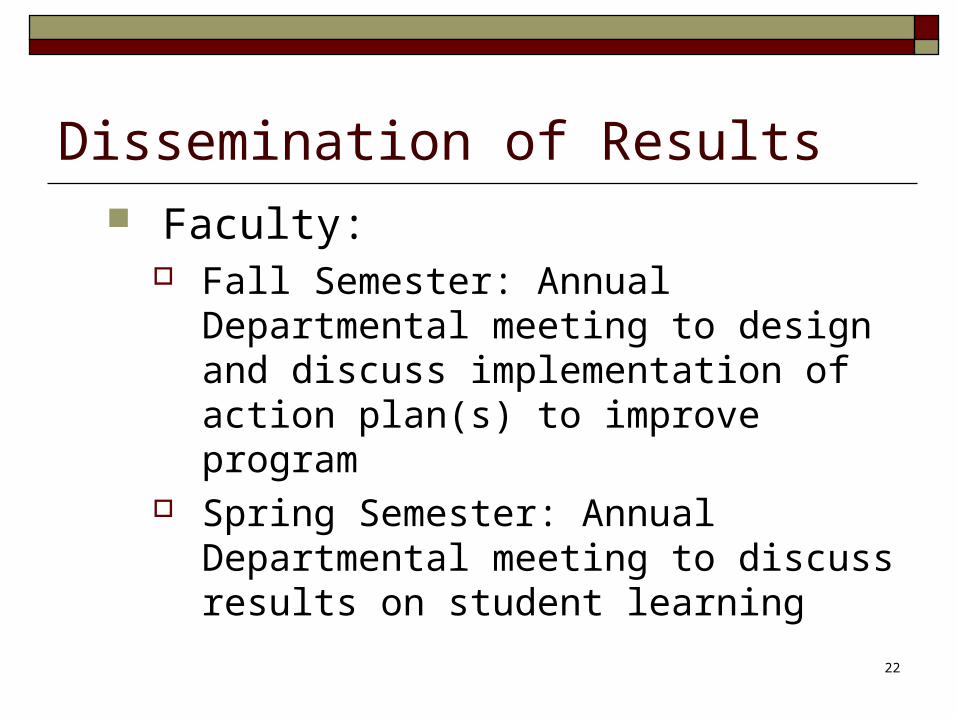
Dissemination of Results Faculty:
Fall Semester: Annual Departmental meeting to design and discuss implementation of action plan(s) to improve program
Spring Semester: Annual Departmental meeting to discuss results on student learning

23
Dissemination of Results Students:
Shared during particular courses (such as the capstone) as appropriate
Shared in the department newsletter Shared during advisement with information on
curriculum sheets
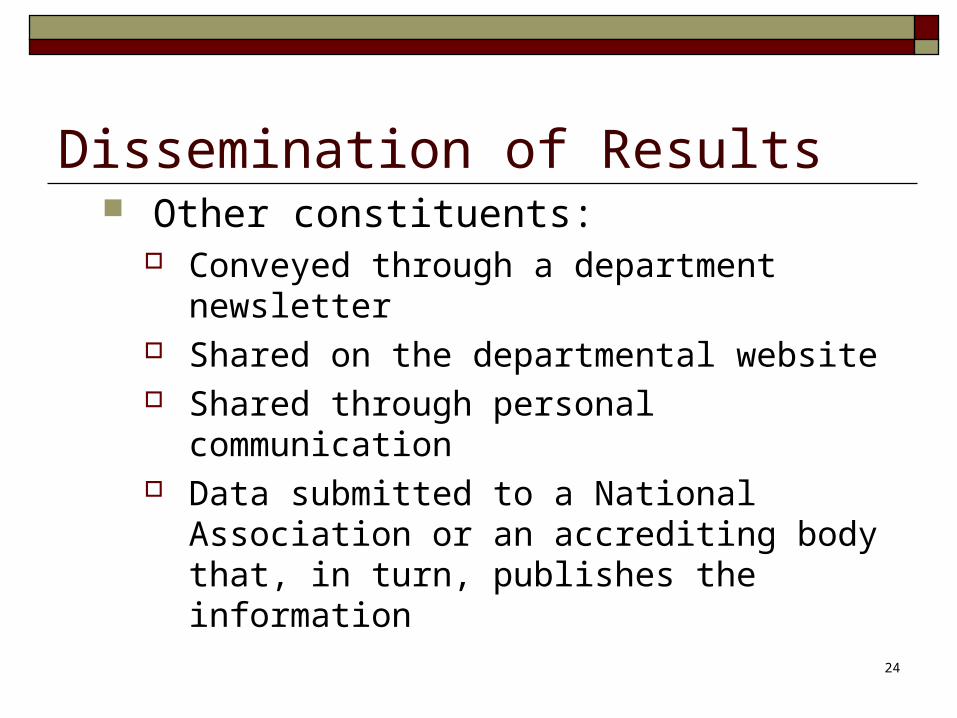
24
Other constituents: Conveyed through a department newsletter Shared on the departmental website Shared through personal communication Data submitted to a National Association or an
accrediting body that, in turn, publishes the information
Dissemination of Results
25
Closing the Loop
26
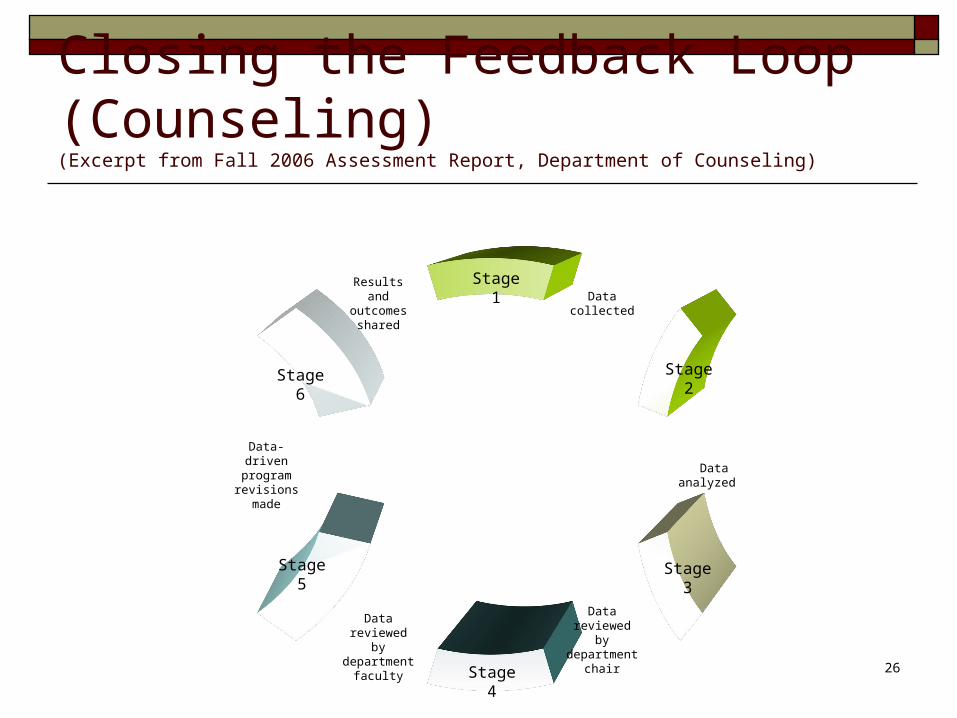
Data reviewed by department
chair
Data collected
Data analyzed
Data reviewed by department
faculty
Data-driven program revisions
made
Results and outcomes
shared
Stage 1
Stage 2
Stage 3
Stage 4
Stage 5
Stage 6
Closing the Feedback Loop (Counseling)(Excerpt from Fall 2006 Assessment Report, Department of Counseling)

27
Closing the Feedback Loop (Counseling)(Excerpt from Fall 2006 Assessment Report, Department of Counseling)
Course additions and revisions identified in last year’s report have substantially enhanced program quality
The hiring of two tenure-track faculty has significantly reduced the percentage of courses taught by part-time instructors and enhanced opportunities for student learning

28
Conclusion A learning process A shared collaboration An emphasis on continual improvement