1 supporting information10.1038...119 were collected from n = 1 biological replicate. * t = 0min t =...
TRANSCRIPT
Supporting Information 1
Modeling Environmentally-Induced Motor neuron Degeneration in Zebrafish 2
Jessica R Morrice1, Cheryl Y Gregory-Evans1-3 and Christopher A Shaw1-3* 3
4
5
1Department of Experimental Medicine 6
2Graduate Program in Neuroscience 7
3Department of Ophthalmology and Visual Sciences 8
10
11
12
13
14
15
16
17
18
19
20
21
22
23

Supplementary data 24
25
26
Supplementary Figure S1. Neurotoxic effect of time-dependent exposure to BPA. 27
Wild type embryos were exposed to control, vehicle control or BPA at 6 hpf and fixed at 28
a) 24 hpf (N= 2 – 5 biological replicates) and b) 48 hpf (P = 0.0001; N = 7-10 biological 29
replicates). Error bars represent ± s.d., P values were determined by Mann-Whitney U 30
test. 31
32
Supplementary Table S1. Lethality of delayed exposure at 12 hpf. Delayed exposure 33
to BPA at 12 hpf did not increase embryonic lethality at 24 hpf or 48 hpf (% morality of 34
total embryos). N = 11 biological replicates. 35
24 hpf 48 hpf
Vehicle Control* 0% 0%
50 μM BPA 0% 0%
Embryos were subject to chronic non-static exposure starting at 12 hpf in vehicle control 36
and treatment groups. 37
*1% DMSO dissolved in E3 media 38
Abbreviations: BPA – Bisphenol A; hpf – hours post fertilization 39
BisphenolA(BPA)-exposedembryosat48hpf
ControlVehicle1 5 15 50Control BPA(μM)
P=0.0001NS
BisphenolA(BPA)-exposedembryosat24hpf
ControlVehicle1 5 15 50Control BPA(μM)
Aver
age A
xon
Len
gth
(µm
)
Aver
age A
xon
Len
gth
(µm
)
160
140
120
100
80
60
40
20
0
NS
A
AverageAx
onLen
gth(μm)
b
BisphenolA(BPA)-exposedembryosat48hpf
ControlVehicle1 5 15 50Control BPA(μM)
P=0.0001NS
BisphenolA(BPA)-exposedembryosat24hpf
ControlVehicle1 5 15 50Control BPA(μM)
Aver
age A
xon
Len
gth
(µm
)
Aver
age A
xon
Len
gth
(µm
)
160
140
120
100
80
60
40
20
0
NS
B
AverageAx
onLen
gth(μm)
a a b
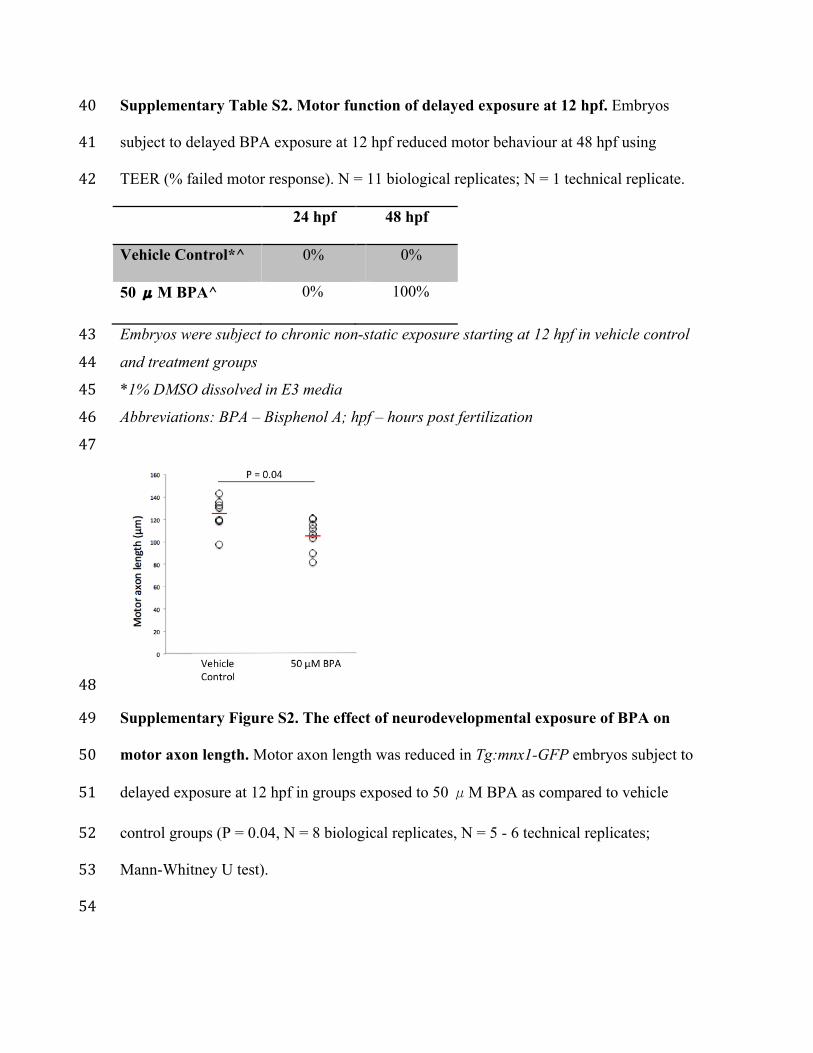
Supplementary Table S2. Motor function of delayed exposure at 12 hpf. Embryos 40
subject to delayed BPA exposure at 12 hpf reduced motor behaviour at 48 hpf using 41
TEER (% failed motor response). N = 11 biological replicates; N = 1 technical replicate. 42
24 hpf 48 hpf
Vehicle Control*^ 0% 0%
50 μM BPA^ 0% 100%
Embryos were subject to chronic non-static exposure starting at 12 hpf in vehicle control 43
and treatment groups 44
*1% DMSO dissolved in E3 media 45
Abbreviations: BPA – Bisphenol A; hpf – hours post fertilization 46
47
48
Supplementary Figure S2. The effect of neurodevelopmental exposure of BPA on 49
motor axon length. Motor axon length was reduced in Tg:mnx1-GFP embryos subject to 50
delayed exposure at 12 hpf in groups exposed to 50 μM BPA as compared to vehicle 51
control groups (P = 0.04, N = 8 biological replicates, N = 5 - 6 technical replicates; 52
Mann-Whitney U test). 53
54
Table 3.1 Embryonic mortality
Table 3.2 Embryos with a failed motor

Supplementary Table S3. Motor Function of delayed exposure at 3 dpf. Embryos 55
subject to delayed exposure to BPA starting at 3 dpf. Values indicate percent of Tg:mnx1-56
GFP embryos with failed motor response at 5 dpf. N = 15 biological replicates in 3 dpf, 57
N = 8 biological replicates in 5 dpf group; N = 1 technical replicate. 58
59
60
61
62
Embryos were subject to chronic non-static exposure of treatment starting at 3 dpf in all 63
groups. 64
Ψ Motor function of randomly selected embryos grown normally in embryo media was 65
analyzed prior to either treatment exposure 66
*1% DMSO dissolved in E3 media 67
Abbreviations: BPA – Bisphenol A; dpf – days post fertilization 68
69
Supplementary Table S4. Lethality of delayed exposure at 3 dpf. Delayed exposure to 70
BPA at 3 dpf increased embryonic lethality at 5 dpf (% morality of total embryos). N = 71
120 biological replicates. Embryos subject to delayed exposure to BPA starting at 3 dpf 72
instead of 6 hpf. 73
74
75
76
77
Embryos were subject to chronic non-static exposure of treatment starting at 3 dpf in all 78
groups. 79
*1% DMSO dissolved in E3 media 80
3 dpf ψ Exposure at 3 dpf 5 dpf
6.7% Vehicle Control* 12.5%
50 μM BPA 100%
4 dpf 5 dpf
Vehicle Control* 0% 0%
50 μM BPA 3.3% 93.7%

Abbreviations: BPA – Bisphenol A; dpf – days post fertilization 81
82
83
84
Supplementary Figure S3. Exposure to BPA at 3 dpf on motor axon length at 5 dpf. 85
Tg:mnx1-GFP embryos subject to 42 hours of treatment exposure at 3 dpf instead of 6 86
hpf showed reduced motor axon length at 5 dpf as compared to vehicle controls. (P = 87
0.03, N = 8 biological replicates, N = 3 - 4 technical replicates). Error bars represent ± 88
s.d., P value was determined by a student’s t-test using Welch’s correction. 89
90
91
Vehicl
e Contro
l
50 µ
M BPA
0
50
100
150
200
250
Delayed BPA exposure at 3 dpf
Ave
rage
Axo
n Le
ngth
(µ
m)
P = 0.03
92
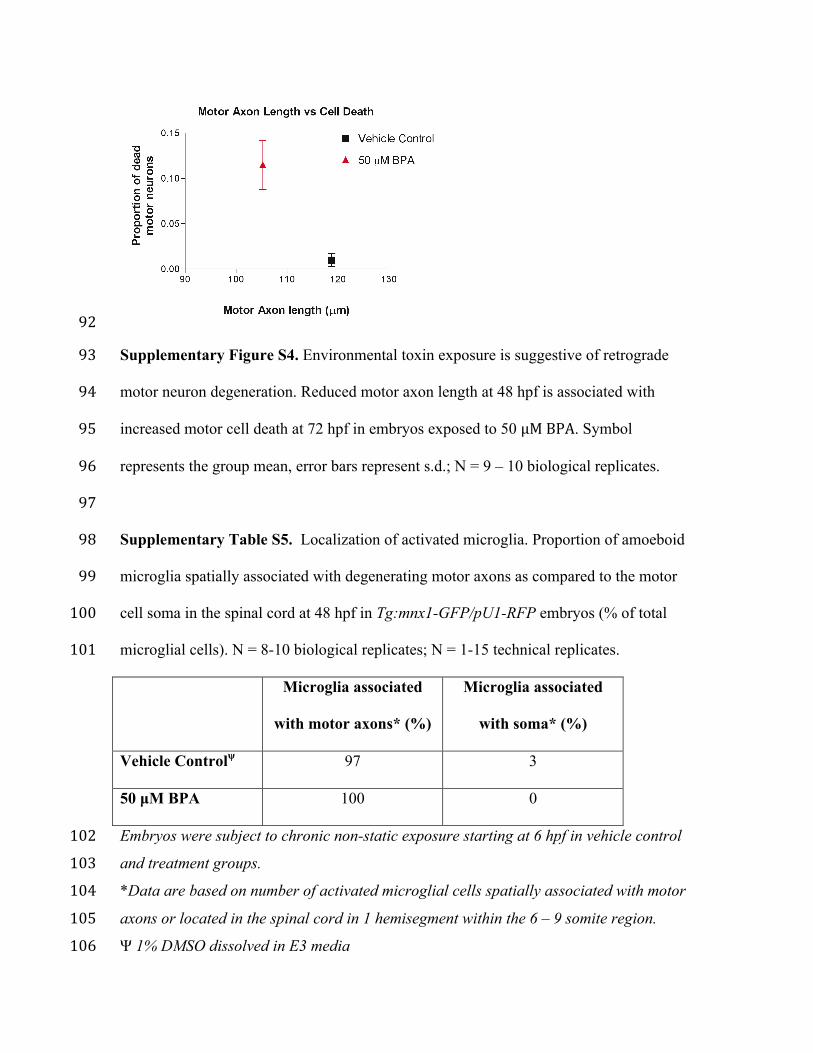
Supplementary Figure S4. Environmental toxin exposure is suggestive of retrograde 93
motor neuron degeneration. Reduced motor axon length at 48 hpf is associated with 94
increased motor cell death at 72 hpf in embryos exposed to 50 μMBPA. Symbol 95
represents the group mean, error bars represent s.d.; N = 9 – 10 biological replicates. 96
97
Supplementary Table S5. Localization of activated microglia. Proportion of amoeboid 98
microglia spatially associated with degenerating motor axons as compared to the motor 99
cell soma in the spinal cord at 48 hpf in Tg:mnx1-GFP/pU1-RFP embryos (% of total 100
microglial cells). N = 8-10 biological replicates; N = 1-15 technical replicates. 101
Microglia associated
with motor axons* (%)
Microglia associated
with soma* (%)
Vehicle Controlψ 97 3
50 µM BPA 100 0
Embryos were subject to chronic non-static exposure starting at 6 hpf in vehicle control 102
and treatment groups. 103
*Data are based on number of activated microglial cells spatially associated with motor 104
axons or located in the spinal cord in 1 hemisegment within the 6 – 9 somite region. 105
Ψ 1% DMSO dissolved in E3 media 106

107
108
Supplementary Figure S5. Microglial engulfment of apoptotic neurons at 72 hpf. 109
Representative static images from live imaging of a microglial cell engulfing an apoptotic 110
neuron in the spinal cord at 72 hpf following BPA exposure in a double transgenic 111
Tg:pU1:Gal4-UAS-RFP/NBT:DLexPR-secA5-TagBFP embryo, which have pU1+ 112
microglia cells labeled in red and apoptotic neurons labeled in blue. Asterisks denotes 113
pU1+ cell (in red) in the process of engulfing a neuron undergoing apoptosis (in blue) in 114
the spinal cord and its subsequent migration away from this site. White arrow denotes an 115
apoptotic neuron being removed from the spinal cord over a time course of 20 minutes. 116
Note that specific microglia were not followed from 48 hpf to 72 hpf, and cells imaged in 117
this figure illustrate the general microglial response in the spinal cord at 72 hpf. Images 118
were collected from N = 1 biological replicate. 119
*
t=0min t=14min t=20minOverla
yNBT
-Ann
exinV
pU1
*
*

120
121
122
Supplementary Figure S6. Quantification of muscle birefringence (a-b) Birefringence 123
of skeletal muscle at 48 hpf in wild type embryos exposed to vehicle control or BPA at 6 124
hpf. c) Wild type embryos exposed to vehicle control or 50 μM BPA had similar skeletal 125
muscle birefringence at 48 hpf (P=0.27; N=5 biological replicates, N=1 technical 126
replicate). Birefringence values represent the mean intensity of the total trunk normalized 127
to the area of trunk analyzed. Scale bar = 500 µm. Data was analyzed by students t-test 128
using Welch’s correction. 129
Vehicl
e Contro
l
50 µ
M BPA
0.00
0.01
0.02
0.03
0.04
Bir
efri
ngen
ce
c
b
Vehicle
Control
50μMBPA
b
a

130
Supplementary Figure S7. Cell death caused by BPA is not specific to motor 131
neurons. Representative images of non-specific cell death following BPA exposure. PI 132
staining in spinal cord and musculature of embryos exposed to 50 µM BPA or vehicle 133
control. Images represent one hemisegment within the 6 – 9 somite region of Tg:mnx1-134
GFP embryos at 3dpf. Inset images show that the neurotoxic effect of BPA is not motor 135
neuron-specific in the spinal cord. Spinal cord (SC) is indicated by the white capped bar. 136
Scale bar = 20 µm. 137
138
139
140
mnx1PI
VehicleCo
ntrol
50μMBPA
SC SC
SC SC
SCSCSC
α-Bungarotoxin An1-synaptotagmin2 overlay
Control
SCSCSC
SCSCSC
VehicleControl
50μMBPA
α-Bungarotoxin An/-synaptotagmin2 overlay
Control
VehicleControl
50μMBPA
overlay

Supplementary Video S1. Activated microglia spatially interact with degenerating 141
motor neurons. Representative 3D reconstruction of microglia interacting with motor 142
axons in a double transgenic Tg:mnx1-GFP/pU1-RFP BPA-exposed embryo, which have 143
pU1+ microglia cells shown here in magenta and motor neurons labeled in green, 144
extending from the spinal cord. Image collected at 30 hpf by confocal microscopy and 145
reconstructed in ImageJ. X, Y and Z axes are labeled in green. Z-stack images were 146
collected and reconstructed from N=1 biological replicate. 147
148
149