1 survival analysis biomedical applications halifax sas user group april 29/2011
TRANSCRIPT

11
Survival Analysis Survival Analysis Biomedical ApplicationsBiomedical Applications
Halifax SAS User GroupHalifax SAS User Group
April 29/2011April 29/2011

22
Why do Survival AnalysisWhy do Survival Analysis
Aims :Aims : How does the risk of event occurrence How does the risk of event occurrence
vary with time?vary with time? How does the distribution across states How does the distribution across states
change with time?change with time? How does the risk of event occurrence How does the risk of event occurrence
depend on explanatory variables?depend on explanatory variables?
• Paul Allison, 2002 Lecture. University of Pennsylvania at Paul Allison, 2002 Lecture. University of Pennsylvania at PhiladelphiaPhiladelphia

33
Survival DataSurvival Data
Time from randomization until time of the Time from randomization until time of the event of interestevent of interest
Classified as event time dataClassified as event time data
Generally not symmetrical distributionGenerally not symmetrical distribution
Positive skew (tails to right)Positive skew (tails to right)
44
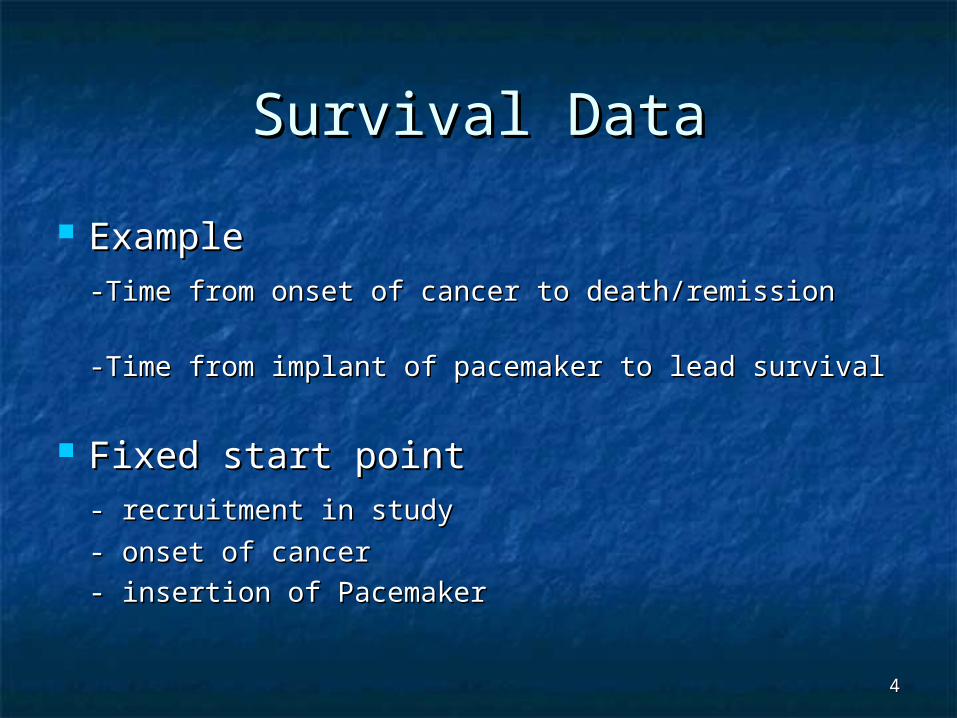
Survival DataSurvival Data
ExampleExample -Time from onset of cancer to death/remission -Time from onset of cancer to death/remission
-Time from implant of pacemaker to lead survival-Time from implant of pacemaker to lead survival
Fixed start pointFixed start point- recruitment in study- recruitment in study
- onset of cancer- onset of cancer
- insertion of Pacemaker- insertion of Pacemaker
55
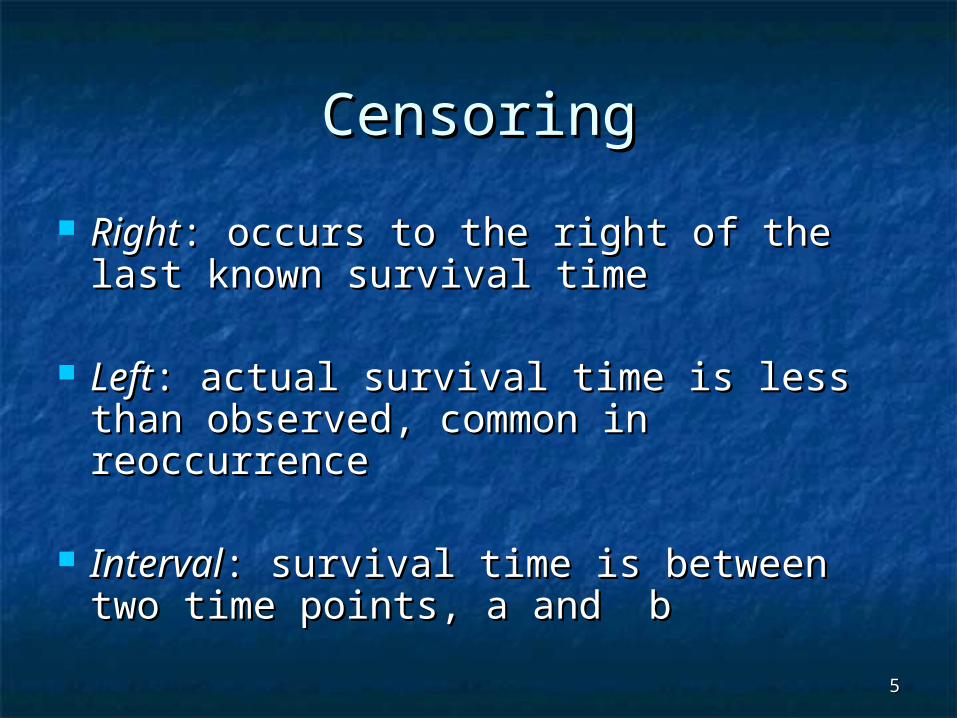
CensoringCensoring
RightRight: occurs to the right of the last : occurs to the right of the last known survival timeknown survival time
LeftLeft: actual survival time is less than : actual survival time is less than observed, common in reoccurrenceobserved, common in reoccurrence
IntervalInterval: : survival time is between two survival time is between two time points, a and btime points, a and b

66

77
Kaplan-MeierKaplan-Meier
Non-parametric methodNon-parametric method
Assumes events depend only on time, Assumes events depend only on time, and censored and non-censored and censored and non-censored subjects behave the samesubjects behave the same
Descriptive method primarily used for Descriptive method primarily used for exploratory analysisexploratory analysis

88
Kaplan–Meier EstimateKaplan–Meier Estimate
Based on life-table methodsBased on life-table methods
Arbitrarily small intervals, continuous Arbitrarily small intervals, continuous functionfunction
Expressed as a probabilityExpressed as a probability
99
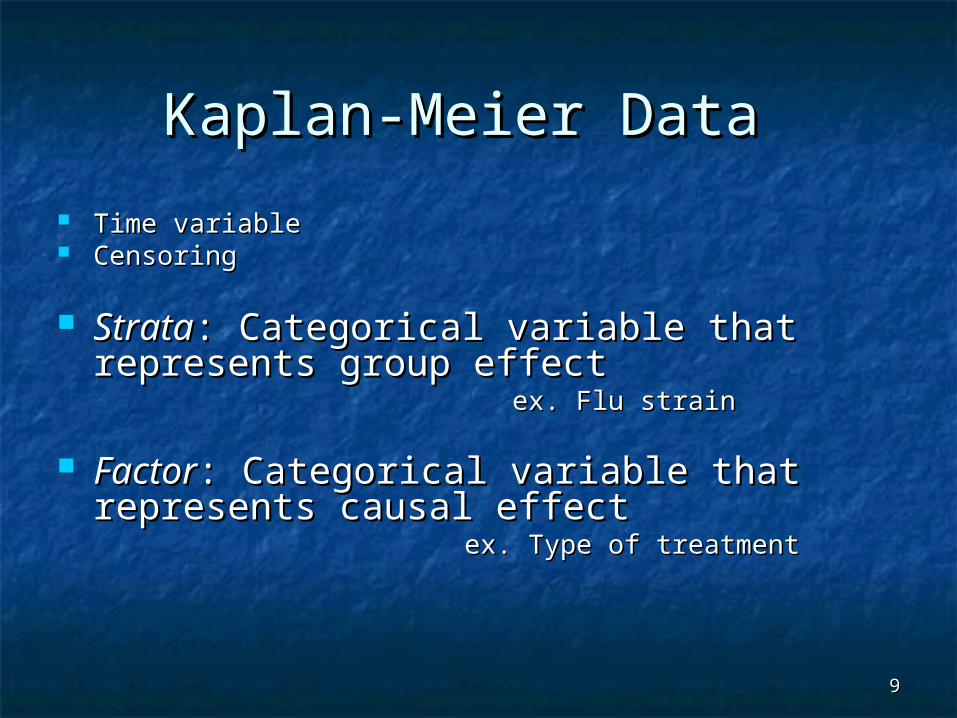
Kaplan-Meier Data Kaplan-Meier Data
Time variableTime variable CensoringCensoring
StrataStrata: Categorical variable that : Categorical variable that represents group effectrepresents group effect
ex. Flu strainex. Flu strain
FactorFactor: Categorical variable that : Categorical variable that represents causal effectrepresents causal effect
ex. Type of treatmentex. Type of treatment

1010
SAS Proc LifetestSAS Proc Lifetest
1111
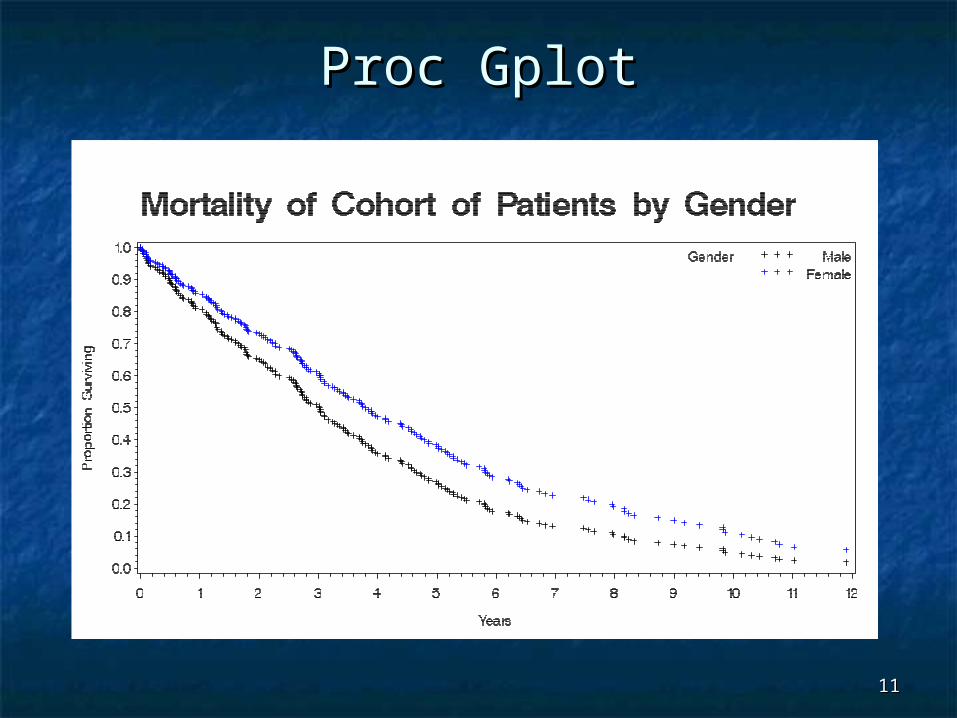
Proc GplotProc Gplot
1212
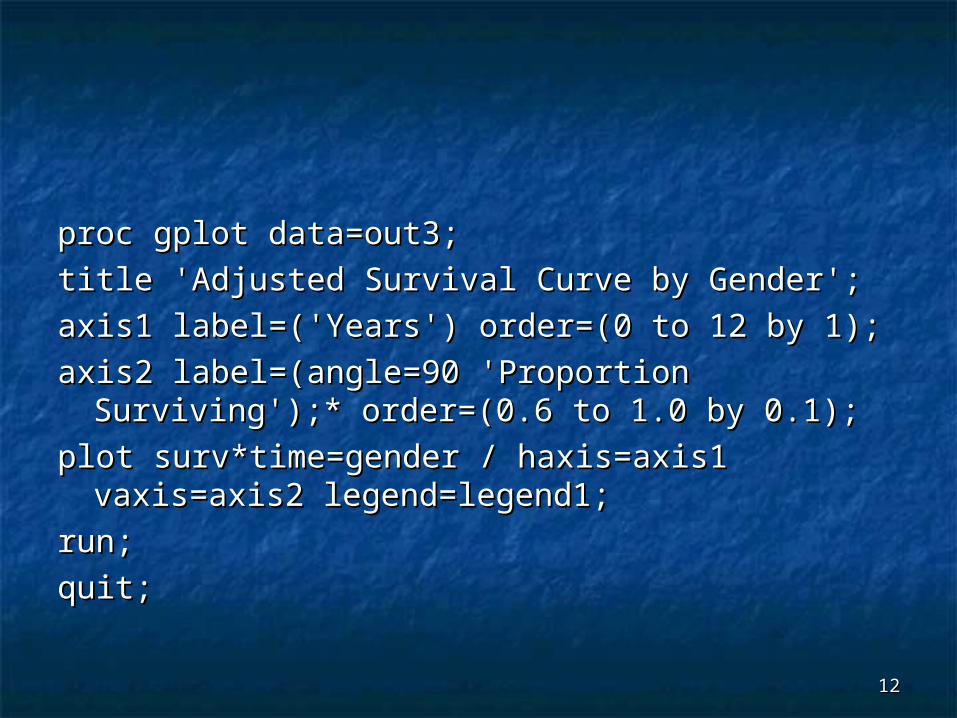
proc gplot data=out3;proc gplot data=out3;
title 'Adjusted Survival Curve by Gender';title 'Adjusted Survival Curve by Gender';
axis1 label=('Years') order=(0 to 12 by 1);axis1 label=('Years') order=(0 to 12 by 1);
axis2 label=(angle=90 'Proportion Surviving');* axis2 label=(angle=90 'Proportion Surviving');* order=(0.6 to 1.0 by 0.1);order=(0.6 to 1.0 by 0.1);
plot surv*time=gender / haxis=axis1 vaxis=axis2 plot surv*time=gender / haxis=axis1 vaxis=axis2 legend=legend1;legend=legend1;
run;run;
quit;quit;
1313
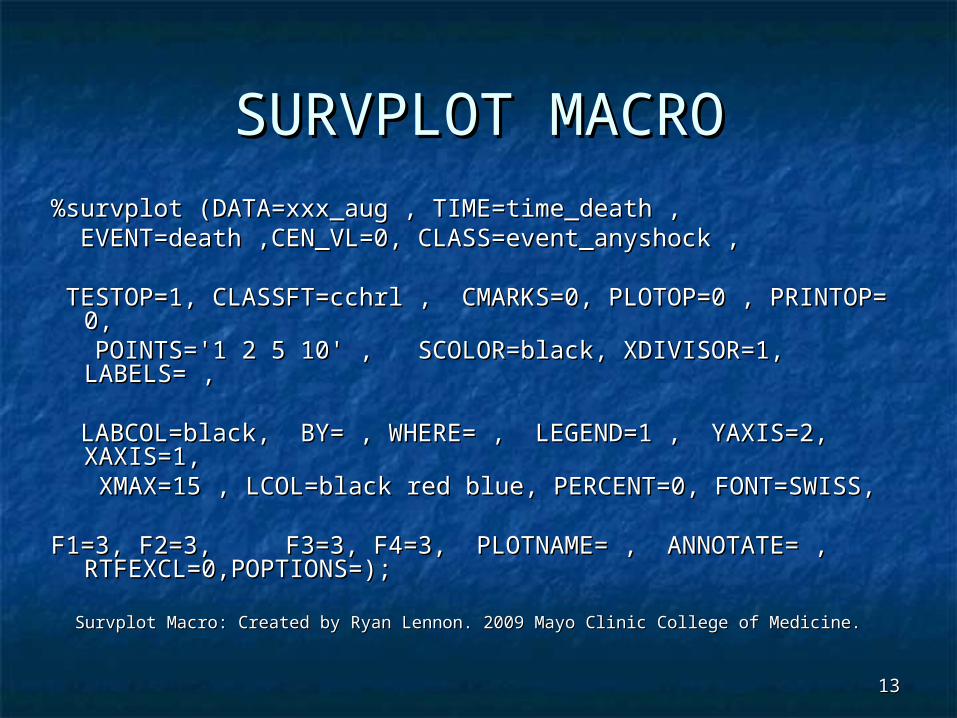
SURVPLOT MACROSURVPLOT MACRO%survplot (DATA=xxx_aug , TIME=time_death , %survplot (DATA=xxx_aug , TIME=time_death , EVENT=death ,CEN_VL=0, CLASS=event_anyshock ,EVENT=death ,CEN_VL=0, CLASS=event_anyshock ,
TESTOP=1, CLASSFT=cchrl , CMARKS=0, PLOTOP=0 , TESTOP=1, CLASSFT=cchrl , CMARKS=0, PLOTOP=0 , PRINTOP= 0,PRINTOP= 0,
POINTS='1 2 5 10' , SCOLOR=black, XDIVISOR=1, LABELS= , POINTS='1 2 5 10' , SCOLOR=black, XDIVISOR=1, LABELS= ,
LABCOL=black, BY= , WHERE= , LEGEND=1 , YAXIS=2, LABCOL=black, BY= , WHERE= , LEGEND=1 , YAXIS=2, XAXIS=1,XAXIS=1, XMAX=15 , LCOL=black red blue, PERCENT=0, XMAX=15 , LCOL=black red blue, PERCENT=0, FONT=SWISS, FONT=SWISS,
F1=3, F2=3, F3=3, F4=3, PLOTNAME= , ANNOTATE= , F1=3, F2=3, F3=3, F4=3, PLOTNAME= , ANNOTATE= , RTFEXCL=0,POPTIONS=);RTFEXCL=0,POPTIONS=);
Survplot Macro: Created by Ryan Lennon. 2009 Mayo Clinic College of Medicine.Survplot Macro: Created by Ryan Lennon. 2009 Mayo Clinic College of Medicine.
1414

1515
Kaplan–Meier EstimateKaplan–Meier Estimate
Product-Limit Survival Estimates Timelist Survival Failure Error # Failed # Left 365.00 365.00 0.5634 0.4366 0.0206 258 292
Point 95% Confidence Interval Percent Estimate [Lower Upper) 50 1323.00 720.00 1905.00 Mean Standard Error 1398.44 54.91
The estimated probability that a patient will survive for 365 The estimated probability that a patient will survive for 365 days or more is 0.56days or more is 0.56

1616
Kaplan – Meier EstimateKaplan – Meier Estimate
Test of Equality over Strata
Test Chi-Square DF Pr > Chi-Square
Log-Rank 6.8529 1 0.0088
Wilcoxon 3.9626 1 0.0465

1717
Sur
viva
l Dis
trib
utio
n F
unct
ion
0.00
0.25
0.50
0.75
1.00
time_death
0 2 4 6 8 10 12

1818
Modeling Survival DataModeling Survival Data
Model the survival “experience” of the Model the survival “experience” of the patient and the variablespatient and the variables
Focus on the risk or hazard of death at Focus on the risk or hazard of death at anytime after the time origin of the studyanytime after the time origin of the study
How explanatory variables affect “FORM” How explanatory variables affect “FORM” of the hazard functionof the hazard function
1919
Modeling Survival DataModeling Survival Data
Obtain an estimate of hazard Obtain an estimate of hazard function for individualfunction for individual
Estimate the median survival time Estimate the median survival time for current or future patientsfor current or future patients

2020
Cox Regression ModelingCox Regression Modeling
Proportional hazard assumptionProportional hazard assumption
Semi- Parametric modelSemi- Parametric model
Coefficient is the log of the ratio of hazard Coefficient is the log of the ratio of hazard of death at time tof death at time t
No assumption about shape but restrained No assumption about shape but restrained to be proportional across covariate levelsto be proportional across covariate levels
2121
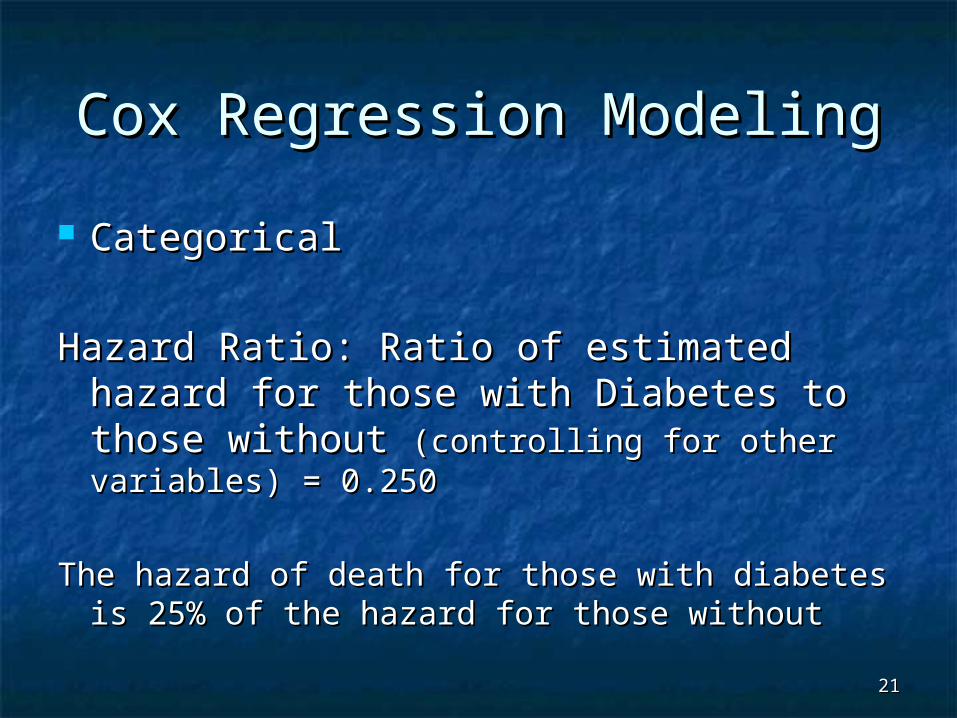
Cox Regression ModelingCox Regression Modeling
CategoricalCategorical
Hazard Ratio: Ratio of estimated hazard Hazard Ratio: Ratio of estimated hazard for those with Diabetes to those without for those with Diabetes to those without (controlling for other variables) = 0.250(controlling for other variables) = 0.250
The hazard of death for those with diabetes is The hazard of death for those with diabetes is 25% of the hazard for those without25% of the hazard for those without

2222
Hazard Ratio = 2Hazard Ratio = 2
“ The treatment will cause the patient to progress more quickly, and that a treated patient who has not yet progressed by a certain time has twice the chance of having progressed at the next point in time compared with someone in the control group.”
What are hazard ratios?. Duerden, M. What is series by Hayward Group Ltd, 2009.

2323
Violations of PH AssumptionViolations of PH Assumption
PH assumes effect of each covariate PH assumes effect of each covariate is same at all time pointsis same at all time points
1.1. Time dependant covariates Time dependant covariates
2.2. Stratification Stratification

2424
Sur
viva
l Dis
tribu
tion
Func
tion
0.00
0.25
0.50
0.75
1.00
time_death_after439
0 1 2 3 4 5 6 7 8

2525
Time dependent covariatesTime dependent covariates
Variables whose value change over timeVariables whose value change over time
No longer proportional hazard modelNo longer proportional hazard model
Method to deal with violation of PH assumptionMethod to deal with violation of PH assumption
Positive Coefficient: Effect of covariate increases linearly with Positive Coefficient: Effect of covariate increases linearly with timetime
Example: GVHD in model to look at leukemia relapseExample: GVHD in model to look at leukemia relapse

2626
Surviving Survival Analysis – An Applied Introduction. NESUG 2008. Williams, Surviving Survival Analysis – An Applied Introduction. NESUG 2008. Williams, C.C.
2727
Survival PredictionSurvival Prediction
Baseline survivor functionBaseline survivor function
Estimate survivor function for any set of Estimate survivor function for any set of covariates = Mean of covariate methodcovariates = Mean of covariate method
Adjusted survival curve methodAdjusted survival curve method

2828
Mean of Covariate MethodMean of Covariate Method
Mean value of covariate inserted into survival Mean value of covariate inserted into survival function of PH modelfunction of PH model
Limitations regarding mean value and Limitations regarding mean value and dichotomous variablesdichotomous variables
Calculated for ‘average’ personCalculated for ‘average’ person
Easily generated from SAS using baseline Easily generated from SAS using baseline statementstatement

2929
Corrected Group Prognosis Corrected Group Prognosis MethodMethod
Survival curve generated for each unique Survival curve generated for each unique combination of covariatescombination of covariates
Actual averaging of survival curvesActual averaging of survival curves
Can be computer intensiveCan be computer intensive
Comparison of 2 Methods for Calculating Adjusted Survival Curves from Proportional Comparison of 2 Methods for Calculating Adjusted Survival Curves from Proportional Hazard models. Ghali, W.A., Quan, H., Brant, R., et al. JAMA. 2001; 286(12):1494-Hazard models. Ghali, W.A., Quan, H., Brant, R., et al. JAMA. 2001; 286(12):1494-1497.1497.
http://people.ucalgary.ca/~hquan/Weight.htmlhttp://people.ucalgary.ca/~hquan/Weight.html
3030
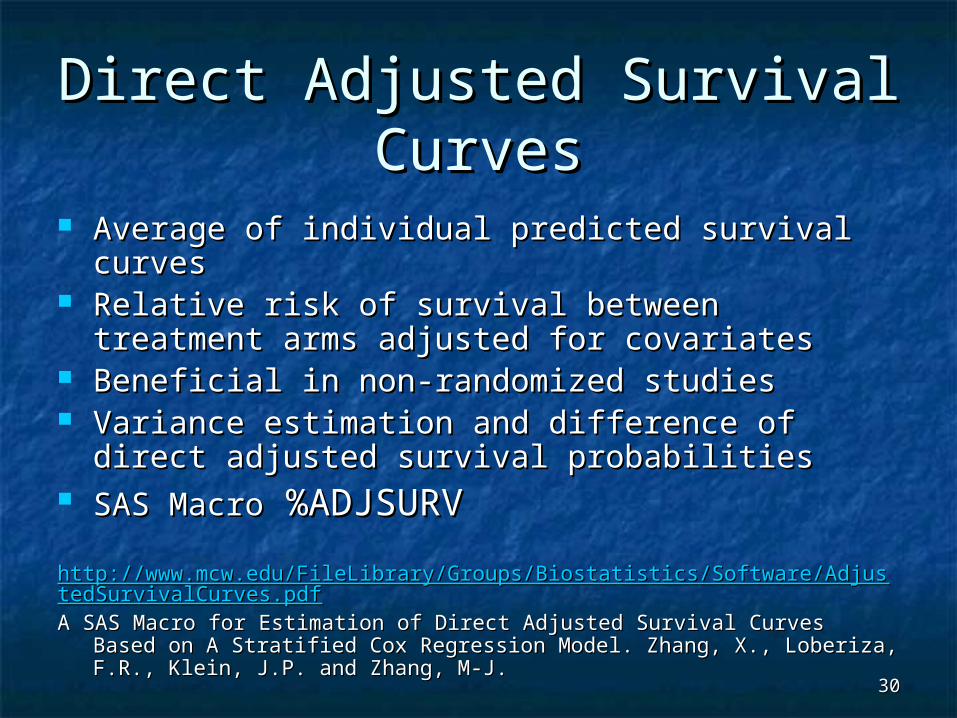
Direct Adjusted Survival Direct Adjusted Survival CurvesCurves
Average of individual predicted survival curvesAverage of individual predicted survival curves Relative risk of survival between treatment arms Relative risk of survival between treatment arms
adjusted for covariates adjusted for covariates Beneficial in non-randomized studiesBeneficial in non-randomized studies Variance estimation and difference of direct Variance estimation and difference of direct
adjusted survival probabilitiesadjusted survival probabilities SAS MacroSAS Macro %ADJSURV %ADJSURV
http://www.mcw.edu/FileLibrary/Groups/Biostatistics/Software/AdjustedSurvivahttp://www.mcw.edu/FileLibrary/Groups/Biostatistics/Software/AdjustedSurvivalCurves.pdflCurves.pdfA SAS Macro for Estimation of Direct Adjusted Survival Curves Based on A A SAS Macro for Estimation of Direct Adjusted Survival Curves Based on A
Stratified Cox Regression Model. Zhang, X., Loberiza, F.R., Klein, J.P. and Stratified Cox Regression Model. Zhang, X., Loberiza, F.R., Klein, J.P. and Zhang, M-J.Zhang, M-J.
3131
Competing Risks ModelsCompeting Risks Models
Occurrence of one type of event removes Occurrence of one type of event removes individual from risk of all other typesindividual from risk of all other types
Ignoring other event can lead to bias in Ignoring other event can lead to bias in Kaplan-Meier estimatesKaplan-Meier estimates
Assumption of independence of the Assumption of independence of the distribution of the time to the competing distribution of the time to the competing events does not holdevents does not hold

3232
Competing Risks ModelsCompeting Risks Models
FunctioningShunt
Shunt FailureInfection
Shunt FailureBlockage
Shunt FailureOther Cause

3333
Cumulative Incidence Cumulative Incidence AnalysisAnalysis
Create data set with multiple strata per ‘failure’Create data set with multiple strata per ‘failure’ If K competing risks, then K rows of dataIf K competing risks, then K rows of data
%CumInc Macro%CumInc Macro %CumIncV Macro%CumIncV Macro Allows some covariates to have same effect on Allows some covariates to have same effect on
several types of outcome eventseveral types of outcome event
Rosthoj, S., Anderson, P. and Adildstrom, S. SAS macros for estimation of the cumulative incidence Rosthoj, S., Anderson, P. and Adildstrom, S. SAS macros for estimation of the cumulative incidence functions based on a Cox regression model for competing risks survival data. Computer Methods functions based on a Cox regression model for competing risks survival data. Computer Methods and Programs in Biomedicine, (2004) 74,69-75. and Programs in Biomedicine, (2004) 74,69-75.