1 swarm acc data: physical signal and temperature dependence swarm 4th data quality workshop, gfz...
TRANSCRIPT

1
Swarm ACC data: physical signal and temperature dependence
Swarm 4th DATA QUALITY WORKSHOP, GFZ Potsdam, 2–5 December 2014
Aleš BezděkJosef SeberaJaroslav Klokočník
Astronomical Institute,Academy of Sciences of theCzech Republic
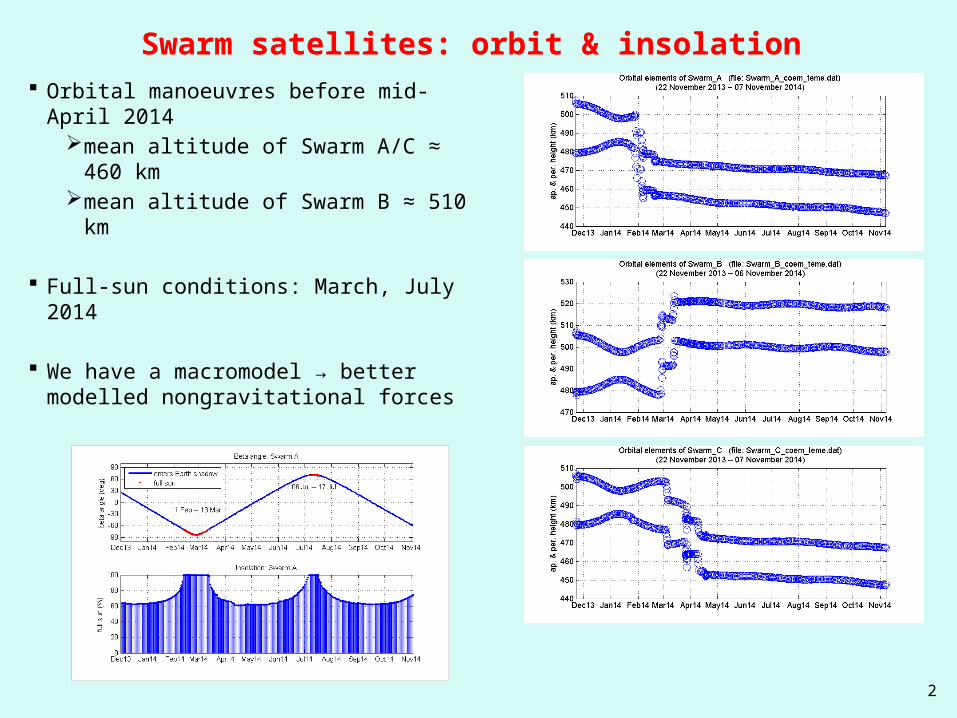
2
Swarm satellites: orbit & insolation Orbital manoeuvres before mid-April 2014
mean altitude of Swarm A/C ≈ 460 kmmean altitude of Swarm B ≈ 510 km
Full-sun conditions: March, July 2014
We have a macromodel → better modelled nongravitational forces

3
Swarm satellites: temperature Long-term temperature behaviour more stable since
mid-April 2014 We have new GPS kinematic orbits
time step 10 sec: 25 Nov – 14 Jultime step 1 sec: 15 Jul – 9 Oct
We selected a study period with a stable mean temperature behaviour & GPS data available:
15 Apr – 9 Oct 2014we estimated new gravity field modelswe studied temperature & ACC data
4
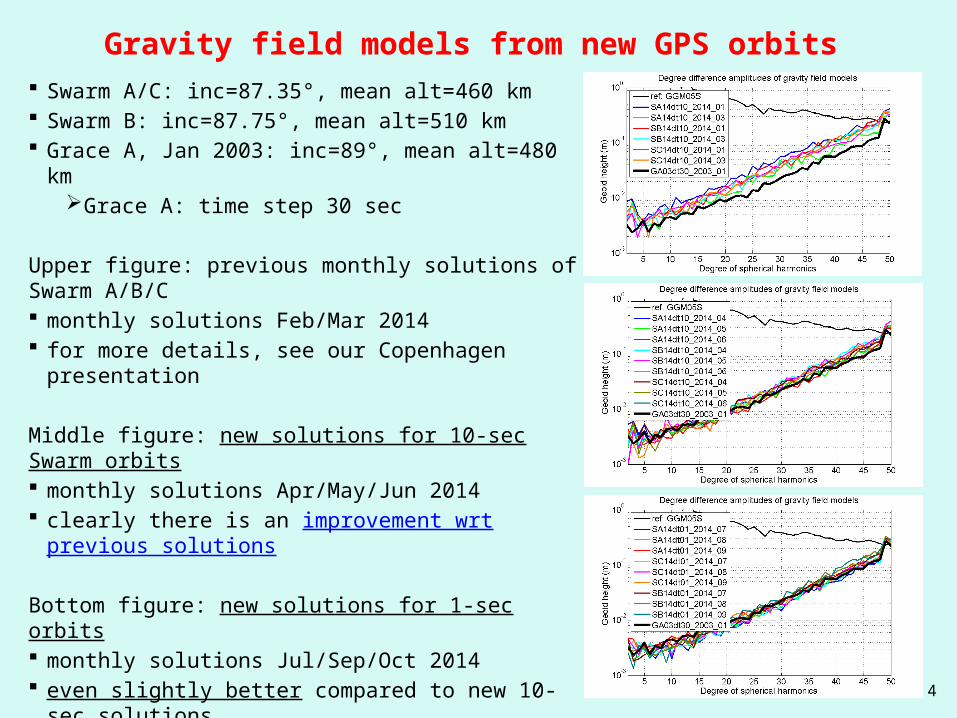
Gravity field models from new GPS orbits Swarm A/C: inc=87.35°, mean alt=460 km Swarm B: inc=87.75°, mean alt=510 km Grace A, Jan 2003: inc=89°, mean alt=480 km
Grace A: time step 30 sec
Upper figure: previous monthly solutions of Swarm A/B/C monthly solutions Feb/Mar 2014 for more details, see our Copenhagen presentation
Middle figure: new solutions for 10-sec Swarm orbits monthly solutions Apr/May/Jun 2014 clearly there is an improvement wrt previous solutions
Bottom figure: new solutions for 1-sec orbits monthly solutions Jul/Sep/Oct 2014 even slightly better compared to new 10-sec solutions
Better Swarm solutions are favourable both for: gravity field solutions derived from Swarm GPS orbits GPS-based calibration of Swarm ACC data

5
Swarm satellites: nongravitational signal (NG)
Upper figure shows the temperature on Swarm A: left axis: mean temperature (22—24 °C) right axis: amplitude of temperature variation around
the mean (std dev) (0.2–0.5 °C) Orbit in the full sun: around 15 July
Bottom figure: magnitude of NG accelerations: Physical NG signal in along-track (A-T) direction
is approx. ten times stronger compared to those in cross-track (C-T) and radial (RAD) directions
Similar behaviour for Swarm B, Swarm C NG signal in A-T direction dominated by
atmospheric drag
Measured physical signal for ACC ten times stronger in A-T direction compared to other directions

6
Recall: Temperature dependence of ACC data: Swarm A/B Example: Swarm A, 15 May 2014 Large temperature dependence of ACC readouts
the same applies to ACC data of Swarm B Shown is an arc of 4 revolutions Orbital arc = specified part of satellite trajectory (e.g. ½ revolution, multiple revolutions, 1 day)
7
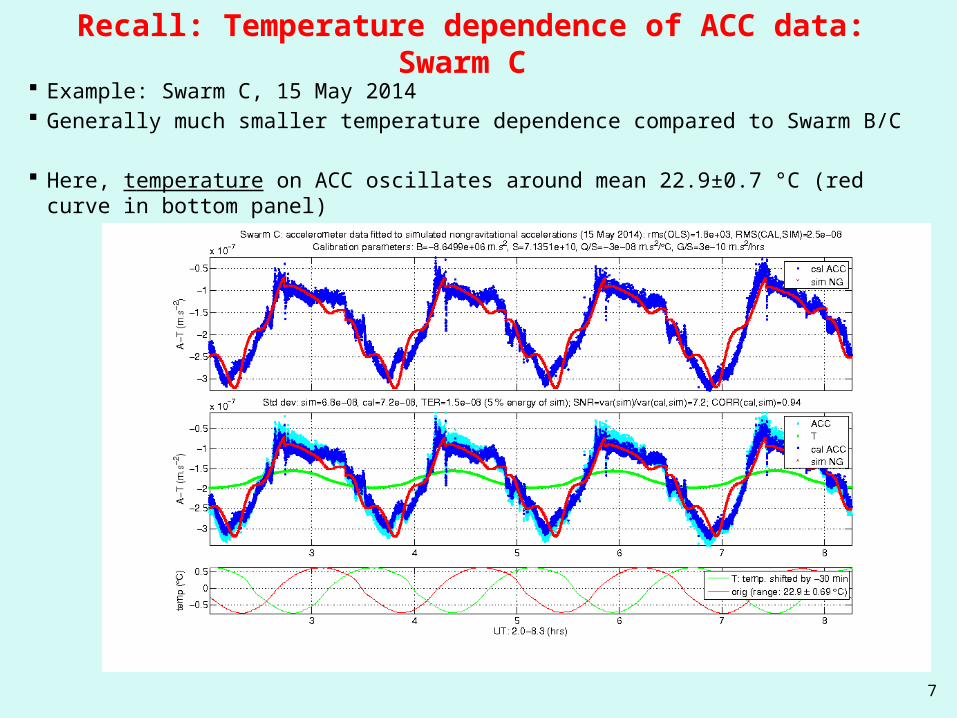
Recall: Temperature dependence of ACC data: Swarm C Example: Swarm C, 15 May 2014 Generally much smaller temperature dependence compared to Swarm B/C
Here, temperature on ACC oscillates around mean 22.9±0.7 °C (red curve in bottom panel)

8
Validation of ACC data by means of simulated NG signal
UNCAL = B + S×SIM + Q×T(t+F) + G×(t–t0) + ε
CAL = [UNCAL – B – Q×T(t+F) – G×(t–t0)]/S
UNCAL..uncalibrated ACC data; B..bias; S..scale factor; SIM..modelled NG signal; Q..temperature factor; T(t+F)..temperature with phase shift F; t..time; G×(t–t0)..trend; ε..noise
CAL..calibrated ACC signalthis pair of equations is defined for each linear ACC channellocal reference frame (LRF) is used: along-track (A-T); cross-track (C-T); radial (RAD)
Swarm C (2 Dec 2013) T(t+F): F=-30 min CORR=0.93 (match CAL&SIM) TER=7%
(temperature-energy-ratio=energy in T divided by energy in SIM)
If CORR is “high” & RMS “low”:→ waveform of CAL validated by SIM (SIM-validated)
→ for SIM-validated arcs TER quantifies the contribution of temperature T
9
Testing of temperature correction by SIM-validation ACC waveform is compared with simulated physical NG signal To the comparison, optionally the temperature variation signal can be added Linear temperature correction (LTC):
temperature variation signal Q.T(t+F) is subtracted from observed ACC data readoutsone needs to know the amplitude Q and phase Fso far, the phase F appears to be constant
SIM-validated arcs are defined: good agreement of (un)corrected ACC waveform with physical nongravitational signal quantitatively: orbital arcs having high CORR(CAL,NG) and low RMS (std. error of the fit)
Two basic reasons for an arc not to be SIM-validated:
(1) arcs with substantial ACC anomalies (steps, jumps, spikes, …)
(2) arcs with important temperature dependence (Swarm A/B, Swarm C less)
When applying a temperature correction (LTC or VZLU) to ACC signal: An increase in the number of SIM-validated arcs is expected:
because reason (2) should be removed by correction;however, reason (1) is still present even for temperature-corrected ACC signal.

10
Increase in #SIM-validated arcs by temperature correction
Tables show percentage of SIM-validated arcs
Systematic results for all satellites: ACC data with no temperature correction do not
correspond well to physical NG signal Correlation of temperature corrected ACC data
with NG is improved substantially
Especially important for A-T direction, where atmospheric density signal is present at most
This test is easy to perform for any temperature correction (LTC, VZLU01, VZLU02, …)
Specific choice of SIM-validated criteria is essential for specific results.
Radial Swarm A Swarm B Swarm Ctemperature not corrected
0 % 0 % 1 %
temperature corrected 33 % 70 % 69 %
Along-track Swarm A Swarm B Swarm Ctemperature not corrected
7 % 6 % 54 %
temperature corrected 59 % 48 % 85 %
Cross-track Swarm A Swarm B Swarm Ctemperature not corrected
6 % 8 % 8 %
temperature corrected 41 % 28 % 49 %
SIM-val criteria along-track cross-track radial
correlation coefficient >0.85 >0.8 >0.7
RMS (std error of fit) 7000 7000 7000

11
Increase in #SIM-validated arcs by temperature correction
Correlation of ACC and NG signals (upper figs: no temp correction; lower figs: temp corrected)
Red points: correlation coefficient >0.85 (A-T), >0.8 (C-T), >0.7 (RAD)

12
Noise levels in ACC components of Swarm satellites
RMS (std error of the fit): measure of correspondence between temp-corrected ACC and NG
Red points: SIM-validated arcs
Swarm A: medium performance
Swarm B: worst performance but weaker A-T signal due to higher altitude
Swarm C: best performance (lowest noise)
Swarm C: Sharp increase of RMS in C-T and RAD components after 5 Sep 2014
Mean RMS ofSIM-val arcs Swarm A Swarm B Swarm C
Along-track 1.6e3 2.2e3 1.2e3
Cross-track 2.5e3 2.3e3 9.5e2
Radial 1.7e3 3.5e3 1.2e3

13
Systematic variations in RMS, fit of phase for each arc
Swarm B: Systematic variations in RMS following the temperature variation ΔT
Systematic variations in residuals → not optimal OLS model
Temperature correction Q.T(t+F): maybe constant phase F= -30 min is wrong
Fit of phase F for each arc (as with Q) Systematic RMS pattern disappeared and RMS decreased but correlation of ACC and NG was substantially reduced Similar results for all Swarm satellites and all components
Conclusion (Nearly) constant phase F≈ –30 min is appropriate for
linear temperature correction more than the phase fitted for each arc separately.

14
Heater action used to estimate the phase
ESL report, p. 20, fig. 2.6 (Swarm B, A-T) Perhaps the start of heater action on
16 Jan 2014 on board of all Swarm satellites could be used to find out the delay in reaction of ACC data to temperature change.
This delay is the phase we look for. We investigated such a possibility as well.

15
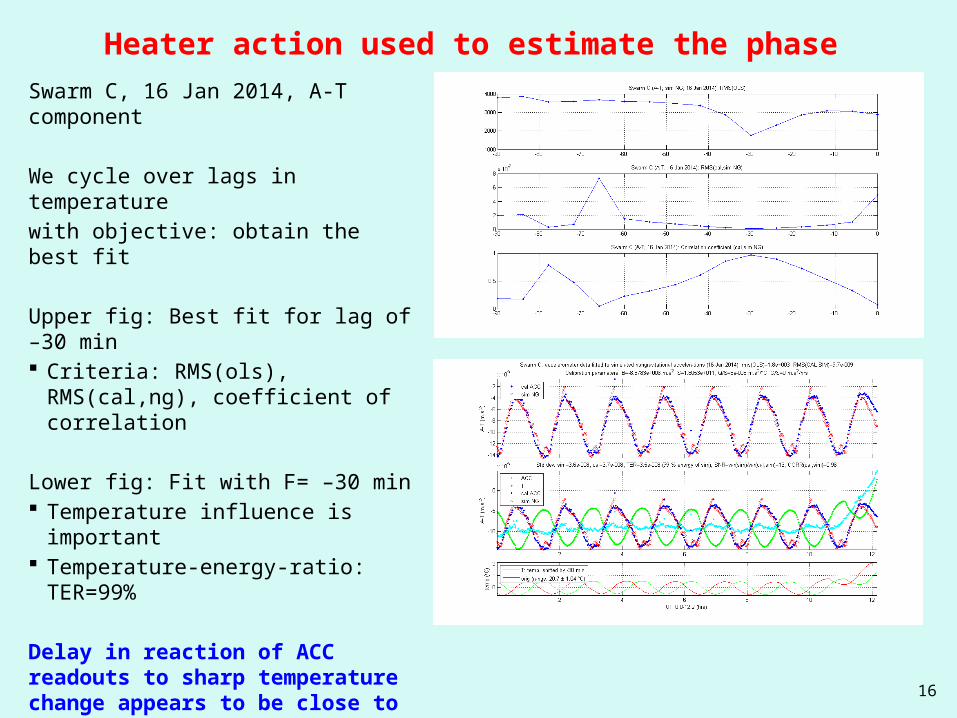
Heater action used to estimate the phase
Swarm C, 16 Jan 2014, A-T component
Upper fig: Fit for the whole day Apparent ruptures in ACC signal due to
thermo-mechanical stress
Lower fig: Fit over arc of 0-12 hrs UT Arc limited to portion without ruptures Shown is a bad OLS fit for temperature
with lag=0 (correlation 0.072)
16
Heater action used to estimate the phase
Swarm C, 16 Jan 2014, A-T component
We cycle over lags in temperature
with objective: obtain the best fit
Upper fig: Best fit for lag of –30 min Criteria: RMS(ols), RMS(cal,ng),
coefficient of correlation
Lower fig: Fit with F= –30 min Temperature influence is important Temperature-energy-ratio: TER=99%
Delay in reaction of ACC readouts to sharp temperature change appears to be close to –30 min in accordance with other tests.

17
Number of SIM-validated arc of whole-day length
Number of whole-day arcs is relatively high due to quiet orbital & temperature conditions
GPS-based calibration We obtained first results using 10-sec GPS positions
of Swarm C with small temperature dependence Change of biases in accordance with SIM-val biases Main objective of our Cal/Val activities:
Calibration parameters and calibrated ACC signal without influence of NG models Uncertainty of calibrated ACC signal depends on quality of GPS satellite positions
Number of SIM-val
arcs in A-T direction
Swarm A Swarm B Swarm C
Number 52 42 112
Percent 30 % 24 % 65 %
18
Conclusions
Study period with stable temperature on all Swarm satellites: 15 Apr – 9 Oct 2014
Monthly gravity field models of improved quality were obtained → thanks to better GPS orbits.
Application of linear temperature correction substantially improves correlation of corrected ACC data with physical nongravitational accelerations.
Comparison of ACC data with physical nongravitational accelerations shows that:ACC on Swarm C has the best performance (lowest noise)ACC on Swarm B has the worst performance
Constant phase F≈ –30 min is appropriate for linear temperature correction more than the phase fitted for each arc separately.
Presented activities serve as preparation for GPS-based calibration, which should provide calibrated ACC measurements accompanied by an estimate of their uncertainty:
GPS-calibrated ACC measurements are not influenced by NG modelsFirst results obtained, work under way
Thank you for your attention