1 the 4th turkish-arab economic forum globalization to regional cooperation walid r. alameddine...
TRANSCRIPT

11
THE 4th TURKISH-ARAB THE 4th TURKISH-ARAB ECONOMIC FORUMECONOMIC FORUM
GLOBALIZATION TO REGIONAL COOPERATIONGLOBALIZATION TO REGIONAL COOPERATION
WALID R. ALAMEDDINECHAIRMAN
Lebanon’s Banking Control CommissionJune 11-12, 2009 - Istanbul

22
TURKISH-ARAB ECONOMIC TURKISH-ARAB ECONOMIC RELATIONSHIPSRELATIONSHIPS
- Overall RelationshipsOverall Relationships- TradeTrade- Capital MarketsCapital Markets- BanksBanks

33
OVERALL RELATIONSHIPSOVERALL RELATIONSHIPS((Excluding Trade & FinanceExcluding Trade & Finance))
- Real Estate InvestmentsReal Estate Investments- Turkish ContractorsTurkish Contractors- TourismTourism- Media – “Turkish Series”Media – “Turkish Series”- Central Asian Republics, Turkey as Gateway:Central Asian Republics, Turkey as Gateway:
Azerbaijan, Uzbekistan, Turkmenistan, Azerbaijan, Uzbekistan, Turkmenistan, Kazakhstan, Kyrgyzstan, Tajikistan ($ 1Trillion Kazakhstan, Kyrgyzstan, Tajikistan ($ 1Trillion combined economy by 2015)combined economy by 2015)

44
G20G20
11U.S.U.S.13.8413.841111BrazilBrazil1.861.86
22JapanJapan4.34.31212MexicoMexico1.351.35
33GermanyGermany2.812.811313S.KoreaS.Korea1.21.2
44U.K.U.K.2.142.141414TurkeyTurkey0.8870.887
55FranceFrance2.052.051515IndonesiaIndonesia0.8370.837
66ItalyItaly1.791.791616AustraliaAustralia0.7600.760
77CanadaCanada1.271.271717Saudi ArabiaSaudi Arabia0.5640.564
88ChinaChina6.996.991818ArgentinaArgentina0.5230.523
99IndiaIndia2.982.981919S. AfricaS. Africa0.4670.467
1010RussiaRussia2.092.092020E.U.E.U.14.7114.71
GDP 2007 $ Trillion
85% of World GDP 48.7/57.3 IMF/PPP
55
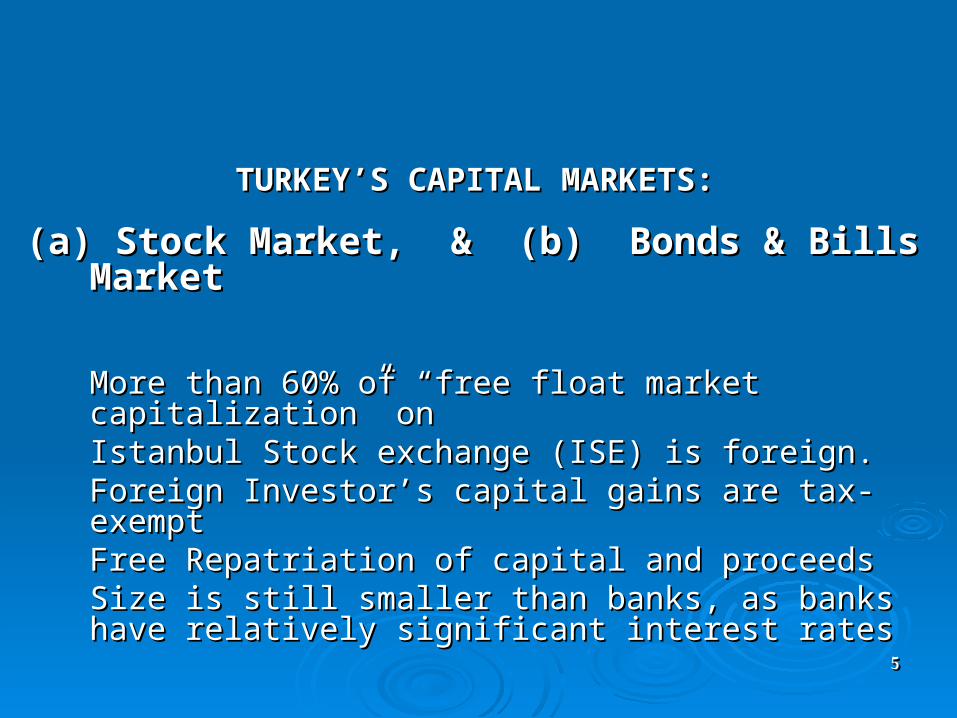
TURKEY’S CAPITAL MARKETS:TURKEY’S CAPITAL MARKETS:
(a) Stock Market, & (b) Bonds & Bills Market(a) Stock Market, & (b) Bonds & Bills Market
More than 60% of “free float market capitalization” onMore than 60% of “free float market capitalization” onIstanbul Stock exchange (ISE) is foreign.Istanbul Stock exchange (ISE) is foreign.
Foreign Investor’s capital gains are tax-exemptForeign Investor’s capital gains are tax-exempt Free Repatriation of capital and proceedsFree Repatriation of capital and proceeds Size is still smaller than banks, as banks have relatively Size is still smaller than banks, as banks have relatively
significant interest ratessignificant interest rates

66
a) STOCK MARKETa) STOCK MARKET
317 companies listed317 companies listed Market Capitalization: 120 BNMarket Capitalization: 120 BN Trading Value: 260 BNTrading Value: 260 BN Daily trading value: above $ 1BN Daily trading value: above $ 1BN 22 companies more than $ 1BN (Market Capital)22 companies more than $ 1BN (Market Capital) Financials: 51% of totalFinancials: 51% of total 1/3 of net FDI’s (Foreign Direct Investments) came 1/3 of net FDI’s (Foreign Direct Investments) came through the ISE (2006-2008)through the ISE (2006-2008) FDI’sFDI’s around around $ 15 BN annually (2006 -2008)$ 15 BN annually (2006 -2008)

77
(b) BONDS & BILLS MARKET(b) BONDS & BILLS MARKET
- Active & much larger in traded value than stock Active & much larger in traded value than stock exchangeexchange Trading value: $ 3,019 BN (2008)Trading value: $ 3,019 BN (2008)

88
TURKEY’S TRADE 2008TURKEY’S TRADE 2008
Exports:Exports: $ 140.8 Billion$ 140.8 Billion
Imports:Imports: $ 193.9 Billion$ 193.9 Billion
Trade Balance: (-) 53.1 BillionTrade Balance: (-) 53.1 Billion

99
TURKISH-ARAB TRADETURKISH-ARAB TRADE
2008 witnessed the fastest Growth of Turkish exports to the 2008 witnessed the fastest Growth of Turkish exports to the
Middle East Middle East The largest increase was with the UAE (also Qatar & Kuwait)The largest increase was with the UAE (also Qatar & Kuwait) Europe still accounts for more than 50% of Turkish Europe still accounts for more than 50% of Turkish
Exports Exports

1010
Turkey’s Trade: Partners Share of TotalTurkey’s Trade: Partners Share of Total
EXPORTSEXPORTS2007200720082008OECD OECD %%62.062.053.453.4
Middle EastMiddle East%%13.113.119.319.3
UAE *UAE *%%2.62.66.76.7
IraqIraq%%2.52.52.42.4
Saudi ArabiaSaudi Arabia%%1.21.21.71.7
QatarQatar%%0.50.51.21.2
*Exports to UAE show readjustment in 2009 from the very high rate of 2008

1111
Turkey’s Trade: Partners Share of TotalTurkey’s Trade: Partners Share of Total
IMPORTSIMPORTS2007200720082008OECDOECD%%55.555.551.251.2
Middle EastMiddle East%%7.37.39.29.2
IraqIraq%%0.10.10.80.8
IranIran%%4.214.214.14.1
Saudi ArabiaSaudi Arabia%%1.41.41.71.7
Saudi Arabia took over from Iraq as the main Oil supplier to Turkey following the closure of the pipeline in August 1990

1212
NAMENAME20072007200820082009*2009*
11U.A.E.U.A.E.3,7113,7118,6678,6673,0923,092
22SAUDI ARABIASAUDI ARABIA3,9273,9275,5245,5242,9262,926
33LEBANON**LEBANON**509509844844645645
* Annualized - as of 03-2009 ** Turkey ranks as the 7th exporter to Lebanon
TURKISH – ARAB TRADESELECTED FINANCIAL VALUES
$Millions
1313
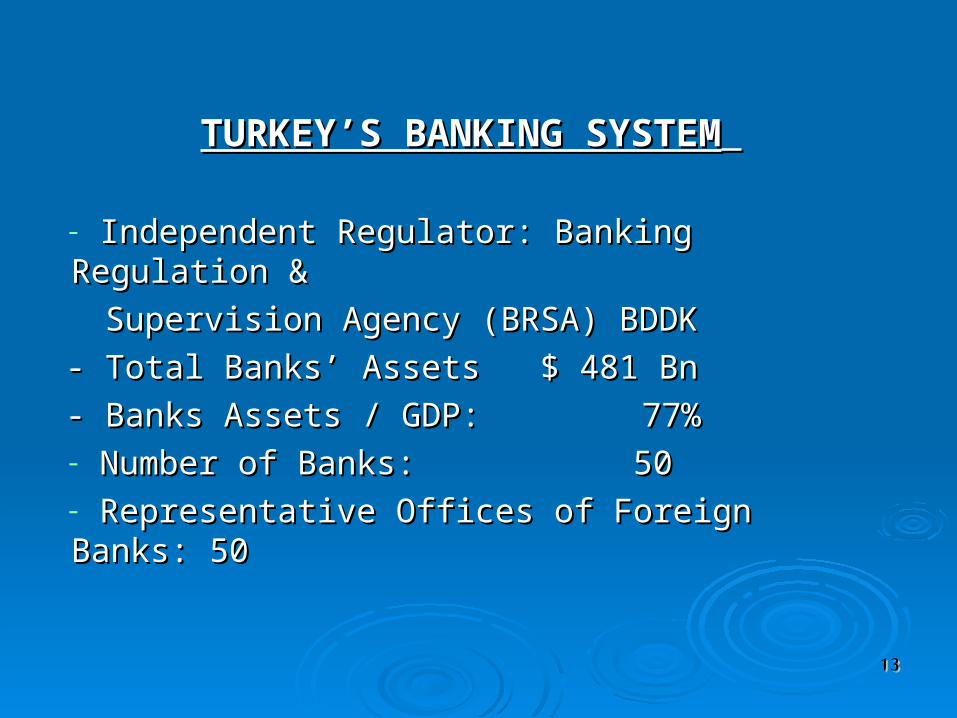
TURKEY’S BANKING SYSTEMTURKEY’S BANKING SYSTEM
- Independent Regulator: Banking Regulation & Independent Regulator: Banking Regulation &
Supervision Agency (BRSA) BDDKSupervision Agency (BRSA) BDDK
- Total Banks’ Assets $ 481 Bn- Total Banks’ Assets $ 481 Bn
- Banks Assets / GDP: - Banks Assets / GDP: 77% 77%- Number of Banks: 50Number of Banks: 50- Representative Offices of Foreign Banks: 50Representative Offices of Foreign Banks: 50

1414
NAMENAME$ MILLIONS $ MILLIONS
11ZIRAAT (State)ZIRAAT (State)68.668.6
22I SI S64.164.1
33GARANTIGARANTI58.458.4
44AKBANKAKBANK56.356.3
55YAPI VE KREDIYAPI VE KREDI41.941.9
TURKISH BANKS: LARGE “REGIONAL” SIZE
Asset Size
1515
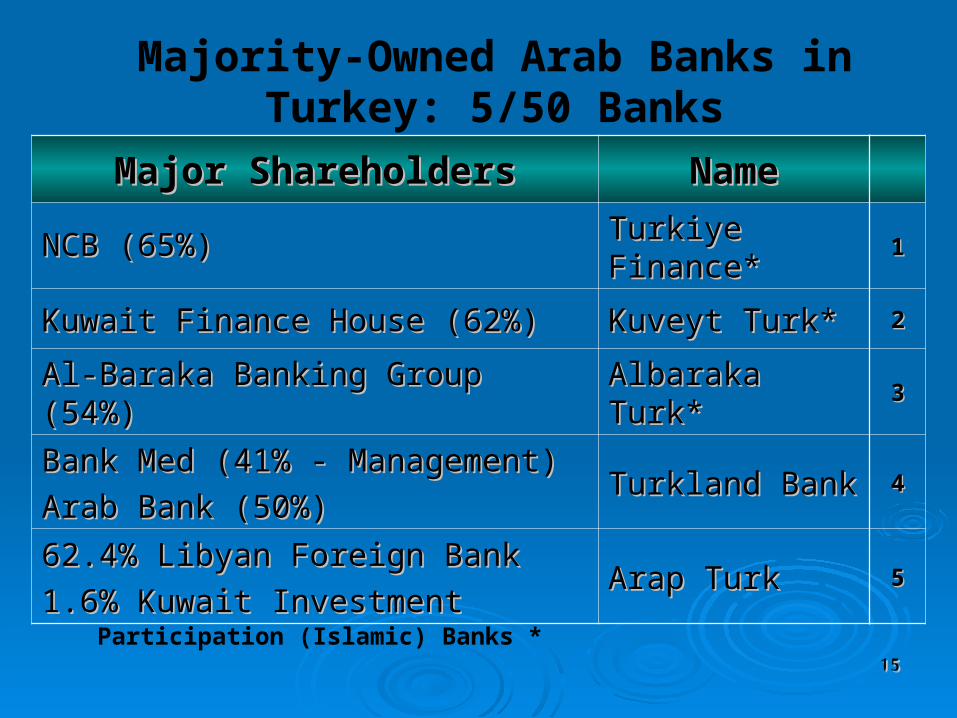
NameNameMajor ShareholdersMajor Shareholders
11Turkiye Finance*Turkiye Finance*NCB (65%)NCB (65%)
22Kuveyt Turk*Kuveyt Turk*Kuwait Finance House (62%)Kuwait Finance House (62%)
33Albaraka Turk*Albaraka Turk*Al-Baraka Banking Group (54%)Al-Baraka Banking Group (54%)
44Turkland BankTurkland BankBank Med (41% - Management)Bank Med (41% - Management)
Arab Bank (50%) Arab Bank (50%)
55Arap TurkArap Turk62.4% Libyan Foreign Bank 62.4% Libyan Foreign Bank
1.6% Kuwait Investment1.6% Kuwait Investment
*Participation (Islamic) Banks
Majority-Owned Arab Banks in Turkey: 5/50 Banks