1 the effect of code coverage on fault detection capability: an experimental evaluation and possible...
Post on 22-Dec-2015
215 views
TRANSCRIPT
1
The Effect of Code Coverage on Fault Detection Capability: An Experimental Evaluation and Possible Directions
Teresa Xia Cai
Group MeetingFeb. 21, 2006

2
Outline
Testing coverage and testing strategies Research questions Experimental setup Results and analysis Discussions and conclusions

3
Introduction
Test case selection and evaluation is a key issue in software testing
Testing strategies aim to select an effective test set to detect as more faults as possible Black-box testing (functional testing) White-box testing (structural testing)
4
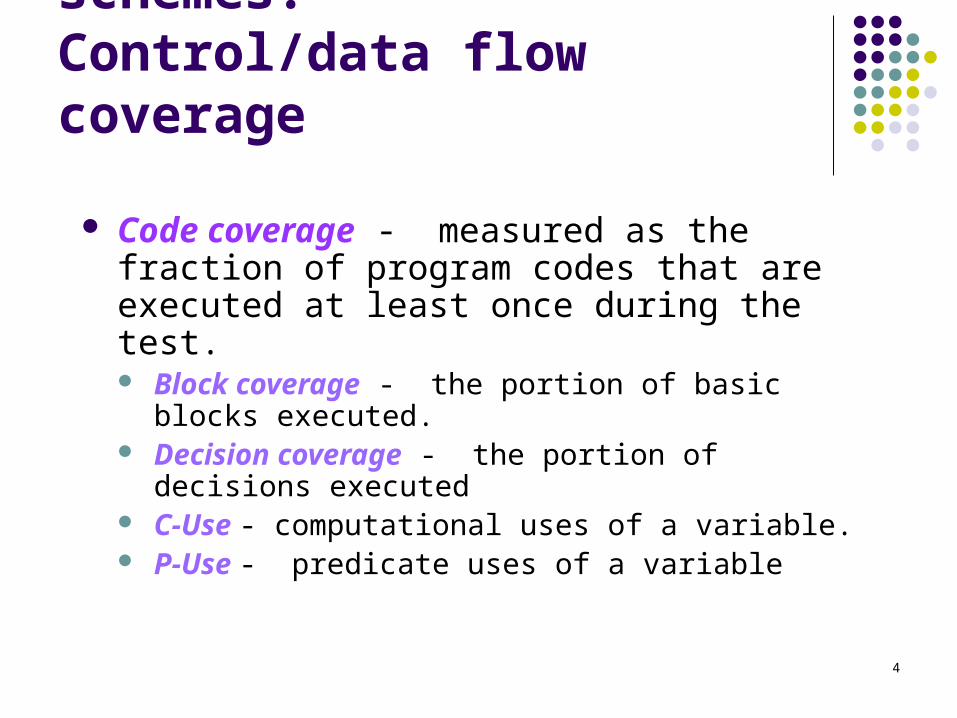
White-box testing schemes:Control/data flow coverage
Code coverage - measured as the fraction of program codes that are executed at least once during the test. Block coverage - the portion of basic blocks
executed. Decision coverage - the portion of decisions
executed C-Use - computational uses of a variable. P-Use - predicate uses of a variable

5
Code coverage: an indicator for test effectiveness?
Supportive empirical studies high code coverage brings high software reliability and low
fault rate both code coverage and fault detected in programs grow
over time, as testing progresses. Weyuker et al (1985, 1988, 1990) Horgan, London & Lyu (1994) Wong, Horgan, London & Mathur (1994) Frate, Garg, Mathur & Pasquini (1995)
Oppositive empirical studies Can this be attributed to causal dependency between code
coverage and defect coverage? Briand & Pfahl (2000)

6
Black-box testing schemes:testing profiles
Functional testing – based on specified functional requirements
Random testing - the structure of input domain based on a predefined distribution function
Normal operational testing – based on normal operational system status
Exceptional testing - based on exceptional system status
{
{

7
Testing coverage and testing strategies Research questions Experimental setup Results and analysis Discussions and conclusions
Outline

8
Research questions
1. Is code coverage a positive indicator for testing effectiveness?
2. Does such effect vary under various testing profiles?
3. Does such effect vary with different coverage measurements?
4. Is code coverage a good filter to reduce the size of effective test set?
9
Testing coverage and testing strategies Research questions Experimental setup Results and analysis Discussions and conclusions
Outline

10
Experimental setup
In spring of 2002, 34 teams are formed to develop a critical industry application for a 12-week long project in a software engineering course
Each team composed of 4 senior-level undergraduate students with computer science major from the Chinese University of Hong Kong
11
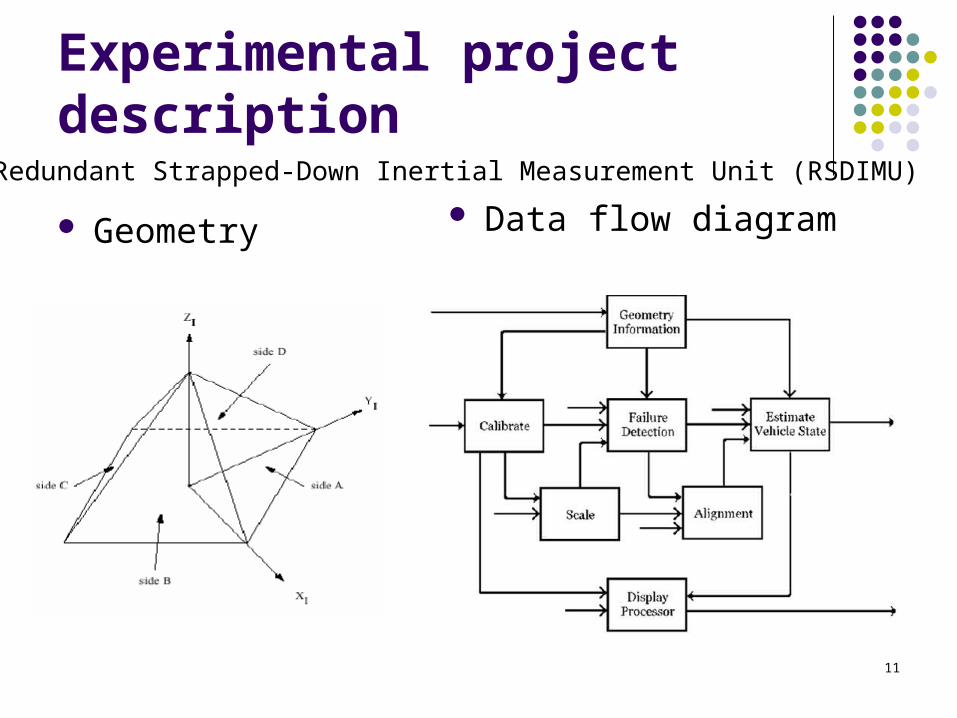
Experimental project description
Geometry Data flow diagram
Redundant Strapped-Down Inertial Measurement Unit (RSDIMU)

12
Software development procedure
1. Initial design document ( 3 weeks)
2. Final design document (3 weeks)
3. Initial code (1.5 weeks)
4. Code passing unit test (2 weeks)
5. Code passing integration test (1 weeks)
6. Code passing acceptance test (1.5 weeks)

13
Mutant creation
Revision control was applied in the project and code changes were analyzed
Faults found during each stage were also identified and injected into the final program of each version to create mutants
Each mutant contains one design or programming fault
426 mutants were created for 21 program versions

14
Program metricsId Lines Modules Functions Blocks Decisions C-Use P-Use Mutants
01 1628 9 70 1327 606 1012 1384 25
02 2361 11 37 1592 809 2022 1714 21
03 2331 8 51 1081 548 899 1070 17
04 1749 7 39 1183 647 646 1339 24
05 2623 7 40 2460 960 2434 1853 26
07 2918 11 35 2686 917 2815 1792 19
08 2154 9 57 1429 585 1470 1293 17
09 2161 9 56 1663 666 2022 1979 20
12 2559 8 46 1308 551 1204 1201 31
15 1849 8 47 1736 732 1645 1448 29
17 1768 9 58 1310 655 1014 1328 17
18 2177 6 69 1635 686 1138 1251 10
20 1807 9 60 1531 782 1512 1735 18
22 3253 7 68 2403 1076 2907 2335 23
24 2131 8 90 1890 706 1586 1805 9
26 4512 20 45 2144 1238 2404 4461 22
27 1455 9 21 1327 622 1114 1364 15
29 1627 8 43 1710 506 1539 833 24
31 1914 12 24 1601 827 1075 1617 23
32 1919 8 41 1807 974 1649 2132 20
33 2022 7 27 1880 1009 2574 2887 16
Average 2234.2 9.0 48.8 1700.1 766.8 1651.5 1753.4 Total: 426
15
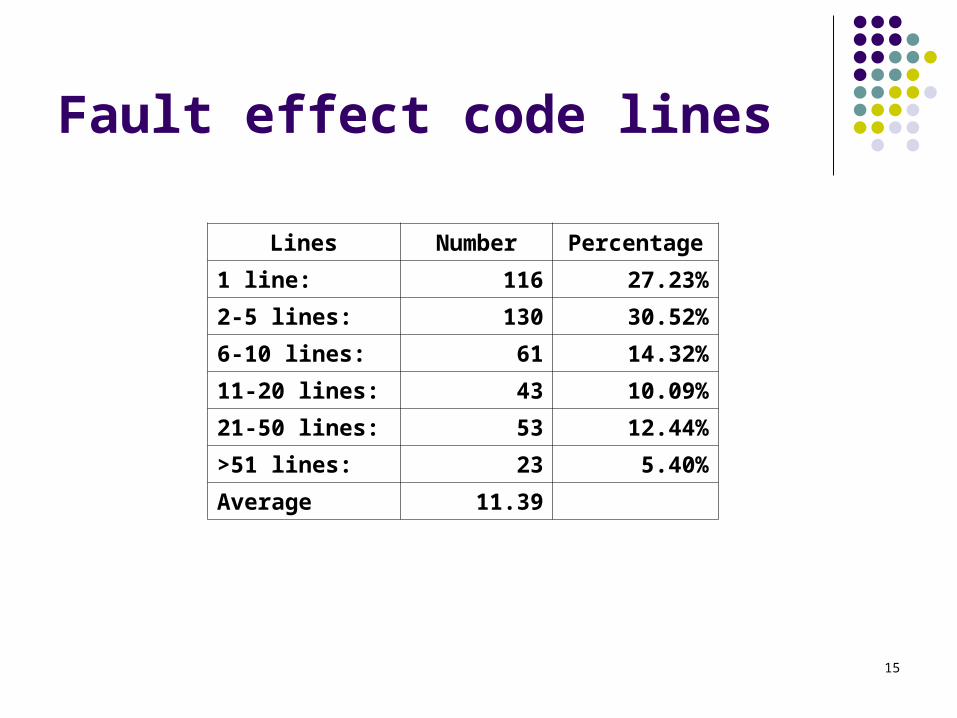
Fault effect code lines
Lines Number Percentage
1 line: 116 27.23%
2-5 lines: 130 30.52%
6-10 lines: 61 14.32%
11-20 lines: 43 10.09%
21-50 lines: 53 12.44%
>51 lines: 23 5.40%
Average 11.39
16
Setup of evaluation test A test coverage tool was employed to analyze the com
pare testing coverage 1200 test cases were exercised on 426 mutants All the resulting failures from each mutant were analyz
ed, their coverage measured, and cross-mutant failure results compared
60 Sun machines running Solaris were involved in the test, where one cycle took 30 hours and a total of 1.6 million files around 20GB were generated

17
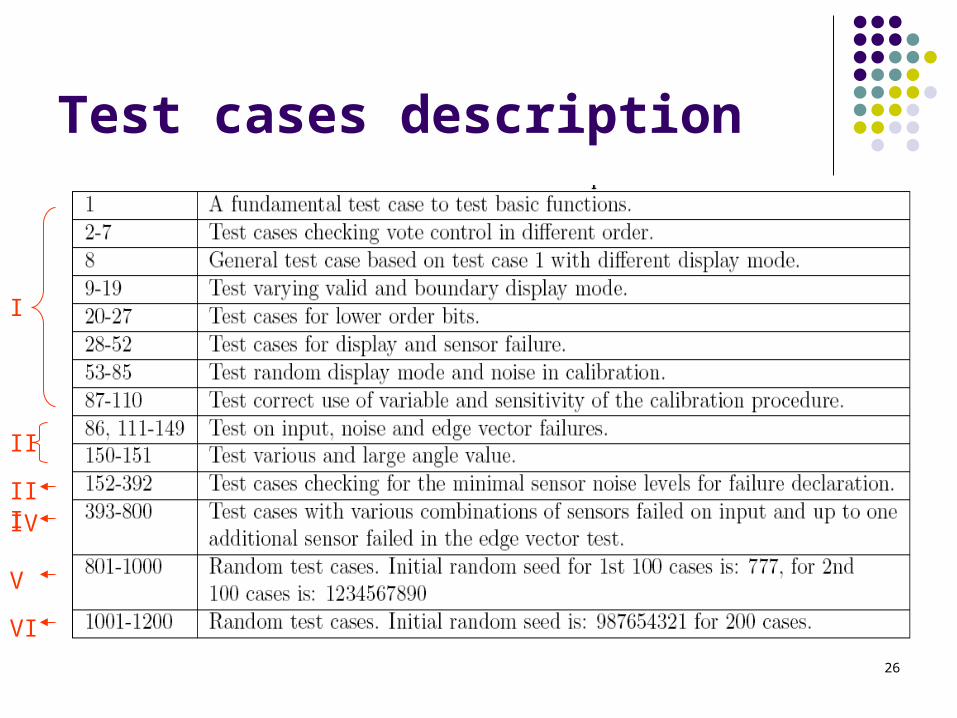
Test case descriptionCase ID Description of the test cases.
1 A fundamental test case to test basic functions.
2-7 Test cases checking vote control in different order.
8 General test case based on test case 1 with different display mode.
9-19 Test varying valid and boundary display mode.
20-27 Test cases for lower order bits.
28-52 Test cases for display and sensor failure.
53-85 Test random display mode and noise in calibration.
87-110 Test correct use of variable and sensitivity of the calibration procedure.
86, 111-149 Test on input, noise and edge vector failures.
150-151 Test various and large angle value.
152-392 Test cases checking for the minimal sensor noise levels for failure declaration.
393-800 Test cases with various combinations of sensors failed on input and up to one additional sensor failed in the edge vector test.
801-1000 Random test cases. Initial random seed for 1st 100 cases is: 777, for 2nd 100 cases is: 1234567890
1001-1200 Random test cases. Initial random seed is: 987654321 for 200 cases.

18
Testing coverage and testing strategies Research questions Experimental setup Results and analysis
Effective of code coverage Under various testing profiles With different coverage measurements Effective test set
Discussions and conclusions
Outline
19
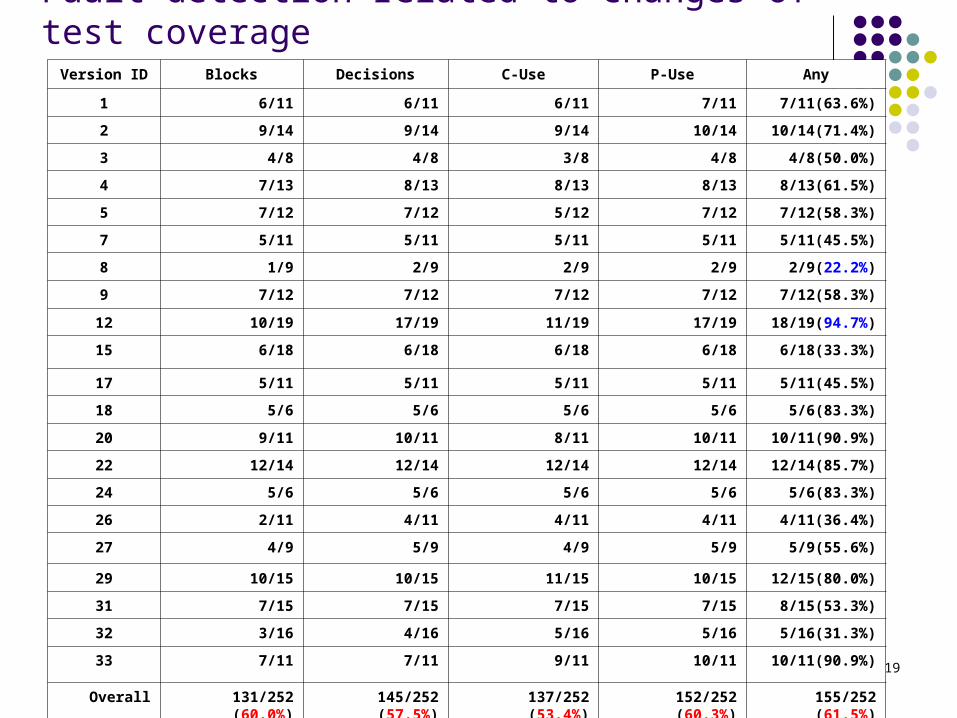
Fault detection related to changes of test coverageVersion ID Blocks Decisions C-Use P-Use Any
1 6/11 6/11 6/11 7/11 7/11(63.6%)
2 9/14 9/14 9/14 10/14 10/14(71.4%)
3 4/8 4/8 3/8 4/8 4/8(50.0%)
4 7/13 8/13 8/13 8/13 8/13(61.5%)
5 7/12 7/12 5/12 7/12 7/12(58.3%)
7 5/11 5/11 5/11 5/11 5/11(45.5%)
8 1/9 2/9 2/9 2/9 2/9(22.2%)
9 7/12 7/12 7/12 7/12 7/12(58.3%)
12 10/19 17/19 11/19 17/19 18/19(94.7%)
15 6/18 6/18 6/18 6/18 6/18(33.3%)
17 5/11 5/11 5/11 5/11 5/11(45.5%)
18 5/6 5/6 5/6 5/6 5/6(83.3%)
20 9/11 10/11 8/11 10/11 10/11(90.9%)
22 12/14 12/14 12/14 12/14 12/14(85.7%)
24 5/6 5/6 5/6 5/6 5/6(83.3%)
26 2/11 4/11 4/11 4/11 4/11(36.4%)
27 4/9 5/9 4/9 5/9 5/9(55.6%)
29 10/15 10/15 11/15 10/15 12/15(80.0%)
31 7/15 7/15 7/15 7/15 8/15(53.3%)
32 3/16 4/16 5/16 5/16 5/16(31.3%)
33 7/11 7/11 9/11 10/11 10/11(90.9%)
Overall 131/252 (60.0%) 145/252 (57.5%) 137/252 (53.4%) 152/252 (60.3%) 155/252 (61.5%)
20
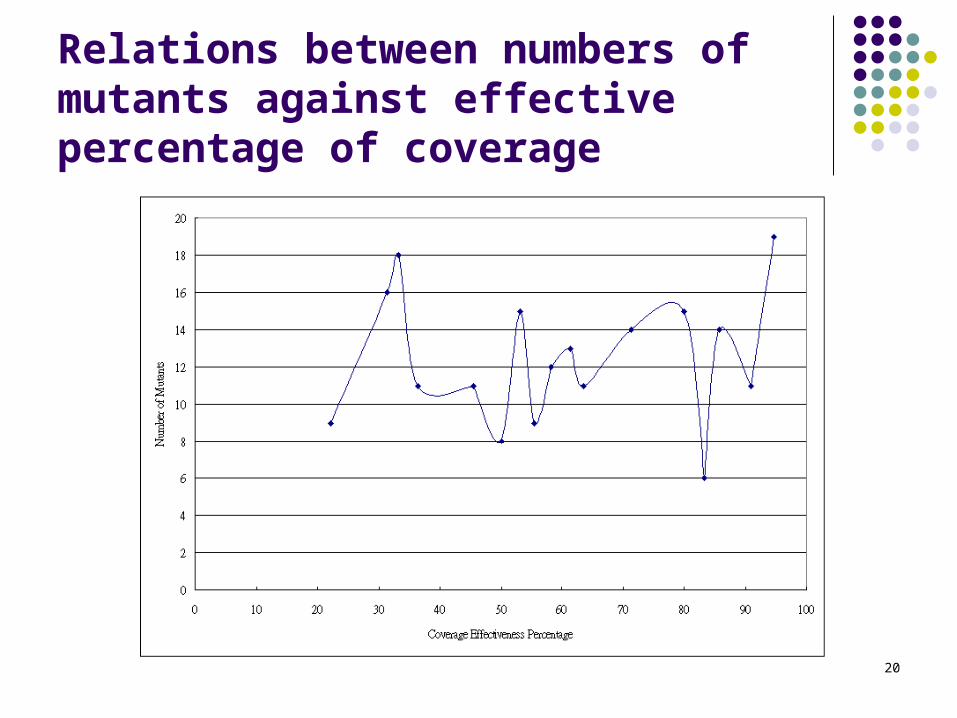
Relations between numbers of mutants against effective percentage of coverage

21
Cumulated defect coverage on sequence

22
Cumulated block coverage on sequence
23
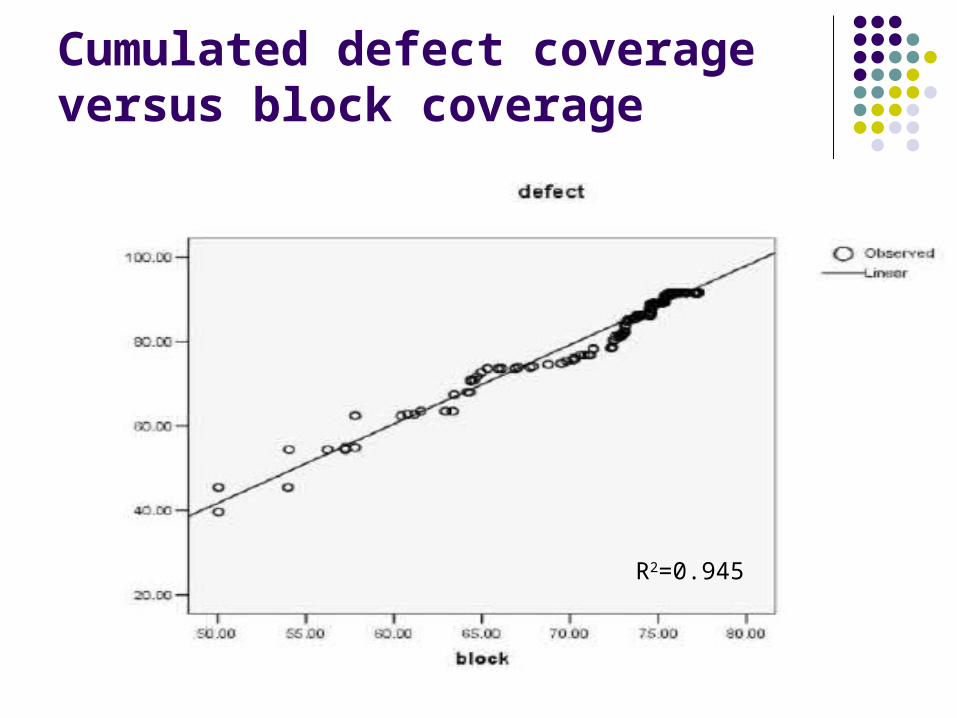
Cumulated defect coverage versus block coverage
R2=0.945

24
Percentage of test case coverage
Percentage of Coverage
Blocks Decision C-Use P-Use
Average 45.86% 29.63% 35.86% 25.61%
Maximum 52.25% 35.15% 41.65% 30.45%
Minimum 32.42% 18.90% 23.43% 16.77%

25
The correlation: various test regions
Test case coverage contribution on block coverage
Test case coverage contribution on mutant coverage
I II III IV V VII II III IV V VI
26
Test cases description
I
II
IIIIV
V
VI

27
Testing coverage and testing strategies Research questions Experimental setup Results and analysis
Effective of code coverage Under various testing profiles With different coverage measurements Effective test set
Discussions and conclusions
Outline

28
In various test regions
Linear modeling fitness in various test case regions
Linear regression relationship between block coverage and defect coverage in the whole test set

29
In various test regions (cont’)
Linear regression relationship between block coverage and defect coverage in region VI
Linear regression relationship between block coverage and defect coverage in region IV

30
In various test regions (cont’)
Observations: Code coverage: a moderate indicator Reasons behind the big variance between
region IV and VI
Region IV Region VI
Design principle Functional testing
Random testing
Coverage range 32% ~ 50% 48% ~ 52%
Number of exceptional test
cases
277
(Total: 373)
0

31
With functional/random testing
Code coverage:
– a moderate indicator
Random testing
– a necessary complement to functional testing Similar code coverage Both have high fault detection capability
Testing profile (size) R-square
Whole test set (1200) 0.781
Functional test cases (800)
0.837
Random test cases (400) 0.558

32
With functional/random testing (cont’)
Failure number of mutants detected only by functional testing or random testing
Test case type
Mutants detected exclusively
(total mutants killed)
Average number of test cases that
detect these mutants
Std. deviation
Functional testing
20
(382)
4.50 3.606
Random testing
9
(371)
3.67 2.236

33
Under normal operational / exceptional testing
The definition of operational status and exceptional status Defined by specification Application-dependent
For RSDIMU application Operational status: at most two sensors failed as the input
and at most one more sensor failed during the test Exceptional status: all other situations
The 1200 test cases are classified to operational and exceptional test cases according to their inputs and outputs

34
Under normal operational / exceptional testing (cont’)
Normal operational testing very weak correlation
Exceptional testing strong correlation
Testing profile (size) R-square
Whole test case (1200) 0.781
Normal testing (827) 0.045
Exceptional testing (373) 0.944

35
Under normal operational / exceptional testing (cont’)
Normal testing: small coverage range (48%-52%) Exceptional testing: two main clusters
36
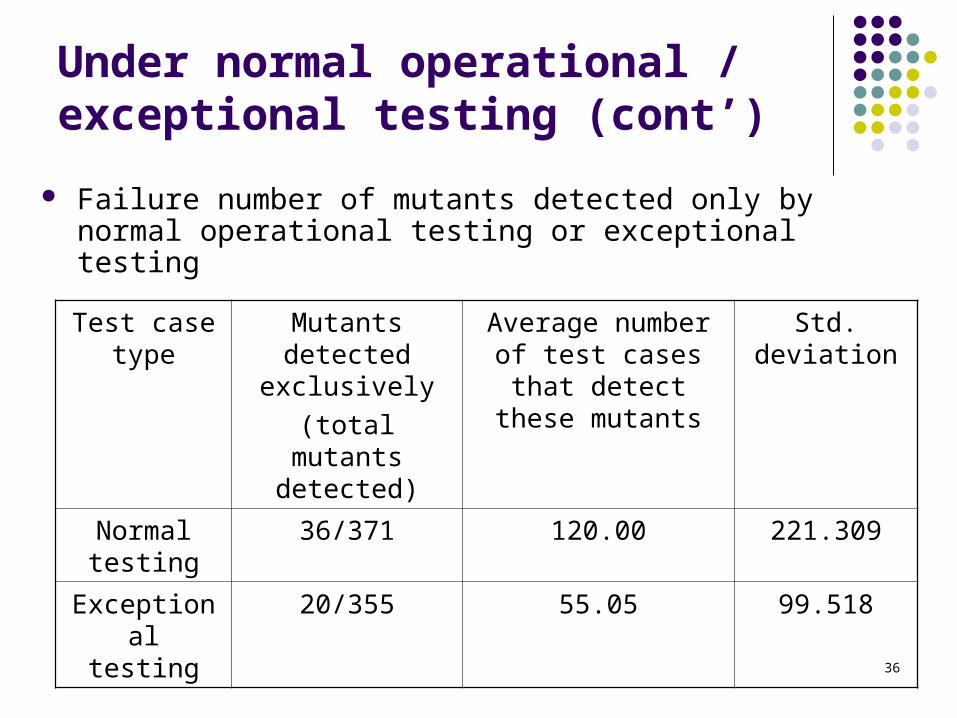
Under normal operational / exceptional testing (cont’)
Failure number of mutants detected only by normal operational testing or exceptional testing
Test case type
Mutants detected exclusively
(total mutants detected)
Average number of test cases that detect
these mutants
Std. deviation
Normal testing
36/371 120.00 221.309
Exceptional testing
20/355 55.05 99.518

37
Under testing profile combinations
Combinations of testing profiles
Observations: Combinations containing exceptional testing indicate
strong correlations Combinations containing normal testing inherit weak
correlations
38
Testing coverage and testing strategies Research questions Experimental setup Results and analysis
Effective of code coverage Under various testing profiles With different coverage measurements Effective test set
Discussions and conclusions
Outline

39
With different coverage measurements
Similar patterns as block coverage Insignificant difference under normal testing Decision and P-use have a bit larger correlation, as
they relate to change of control flow
40
Testing coverage and testing strategies Research questions Experimental setup Results and analysis
Effective of code coverage Under various testing profiles With different coverage measurements Effective test set
Discussions and conclusions
Outline

41
The reduction of the test set size using coverage increase information

42
Testing coverage and testing strategies Research questions Experimental setup Results and analysis Discussions and conclusions
Outline

43
Answers to RQs
1. Is code coverage a positive indicator for testing effectiveness?
Our answer is supportive At most situations (61.5%), there is an coverage
increase when a test case detect additional faults. Under some functional and exceptional testing
region, the correlation between code coverage and fault coverage is pretty high
When more cumulated code coverage have been achieved, more faults are detected.

44
Answers to RQs (cont’)2. Does such effect vary under various testing
profiles? A significant correlation exists in exceptional
test cases, while no correlation in normal operational test cases.
Higher correlation is revealed in functional testing than in random testing, but the difference is insignificant

45
Answers to RQs (cont’)
3. Does such effect vary with different coverage measurements?
Not obvious with four coverage measurements
4. Is code coverage a good filter to reduce the size of effective test set?
Yes, 203 test cases (17% of the original test set) which achieve any coverage increase can detect 98% of the faults.

46
Conclusion Code coverage is a reasonably good indictor for fault
detection capability. The strong correlation revealed in exceptional testing
implies that coverage works predictably better in certain testing profiles than others.
Testing guidelines and strategy can be established for coverage-based testing: For normal operational testing: specification-based, regardless
of code coverage For exceptional testing: code coverage is an important metrics
for testing capability A quantifiable testing strategy may emerge by combining
black-box and white-box testing strategies appropriately.