contents 1 the framework for the turn-around of the c-brta ... breakthroughs in the form of real...
TRANSCRIPT

1
CONTENTS
1. Corporate profile ......................................................................................................................... 5
2. Chairperson’s report .................................................................................................................... 7
3. Chief Executive Officer’s report ............................................................................................... 11
3.1. Introduction ......................................................................................................................... 12
3.2. Financial overview ............................................................................................................... 12
3.3. Operational overview ......................................................................................................... 13
3.3.1 The Regulatory Function ............................................................................................ 13
3.3.2 The Law Enforcement Function ................................................................................ 20
3.3.3 The Facilitation Function ............................................................................................ 24
3.3.4 The Advisory Function ................................................................................................ 26
3.3.5 Support Functions ....................................................................................................... 27
3.4. Performance against goals ............................................................................................... 29
3.5. Future outlook for 2009 - 2011 ............................................................................................ 31
3.6. Conclusion ........................................................................................................................... 32
4. Corporate Governance ............................................................................................................ 33
4.1. The Board of Directors ........................................................................................................ 34
4.2. Statement of Responsibility ................................................................................................ 35
4.3. Members of the Board ........................................................................................................ 35
4.4. The Board Committees ....................................................................................................... 36
4.4.1 The Regulatory Committee ....................................................................................... 36
4.4.2 The Human Resources and Remuneration Committee ........................................ 37
4.4.3 The Audit and Risk Committee ................................................................................. 37
5. Executive Management ........................................................................................................... 39
6. Financial Performance .............................................................................................................. 41
6.1. Report of the Chairperson of the Audit and Risk Committee ........................................ 42
6.2. Report of the Auditor General ........................................................................................... 45
6.3. Financial Statements ........................................................................................................... 54
6.3.1 Accounting Authority’s Statement of Approval ..................................................... 54
6.3.2 Statement of Financial Position ................................................................................ 55
6.3.3 Statement of Financial Performance ...................................................................... 56
6.3.4 Statement of Changes in Net Assets ....................................................................... 57
6.3.5 Cash Flow Statements ............................................................................................... 58
6.3.6 Notes to the Fiinancial Statements .......................................................................... 59
2
FIGURES
Figure 1 The framework for the turn-around of the C-BRTA............................................................. 9
Figure 2 Permit income ...................................................................................................................... 13
Figure 3 Permit applications for passengers in taxi’s ...................................................................... 14
Figure 4 Permit applications for passengers in buses ..................................................................... 15
Figure 5 Permit applications for freight ............................................................................................ 17
Figure 6 Permit applications for tourism .......................................................................................... 19
Figure 7 Operational activity within Law Enforcement ................................................................. 20
Figure 8 Penalty income .................................................................................................................... 21
Figure 9 Penalty Income per Region ............................................................................................... 21

3
TABLES
Table 1 Permit applications for passengers, both permanent and temporary .......................... 14
Table 2 Temporary and permanent permits for 2008/2009 ........................................................... 15
Table 3 Permit applications for passengers in buses ...................................................................... 16
Table 4 Temporary and permanent permits for buses ................................................................... 16
Table 5 Demographics of bus operators on permanent permits ................................................. 16
Table 6 Permit applications for freight ............................................................................................. 18
Table 7 Temporary and one year permits for freight ..................................................................... 18
Table 8 Permit applications for tourism ............................................................................................ 19
Table 9 Law Enforcement Operational activity statistics............................................................... 20
Table 10 Penalty income ................................................................................................................... 21
Table 11 Penalty Income per Region............................................................................................... 22
Table 12 Facilitation attendance ..................................................................................................... 24
Table 13 Performance against goals ............................................................................................... 30
Table 13 Performance against goals (continued) ......................................................................... 31
Table 14 Board Meeting Attendance .............................................................................................. 36
Table 15 Regulatory Committee Attendance ................................................................................ 37
Table 16 Human Resources and Remuneration Committee Attendance ................................. 37
Table 17 Audit and Risk Committee Attendance .......................................................................... 39

4
ACRONYMS
CEO Chief Executive Officer
C-BRTA Cross Border Road Transport Agency
DoT Department of Transport
JC Joint Committee
JMG Joint Management Group
JRMG Joint Route Management Group
MOU Memorandum of Understanding
SACU Southern African Customs Union
SADC Southern African Development Community
TKC Trans Kalahari Corridor

Chapter 1

6
CORPORATE PROFILE
Corporate profile1.
The Cross Border Road Transport Agency (C-BRTA) was established under the Cross Border Road Transport Act 4 of 1998, as amended, to provide advice, regulation, facilitation and law enforcement in respect of cross-border road transport, so as to:
Improve the unimpeded flow of freight and passengers in the SADC region.•Introduce regulated competition in respect of cross-border road transport.•Reduce operational constraints for the cross-border road transport industry as a whole.•Enhance and strengthen the capacity of the public sector in support of its strategic planning, •enabling and monitoring functions.Empower the cross-border road transport industry to maximise business opportunities and to •regulate themselves incrementally to improve safety, security, reliability, quality and efficiency of services.
Cross-border road transport is underpinned by groundbreaking multilateral and bilateral agreements between South Africa and several of its neighbouring countries, i.e. the SADC Protocol on Transport, Communications and Meteorology, the Southern African Customs Union Memorandum of Understanding (SACU MOU), the Trans-Kalahari Corridor Memorandum of Understanding (TKC MOU) and various bi-lateral road transport agreements.
Our visionOur vision is to be a leading Cross Border Road Transport Regulator within the SADC region.
Our missionOur mission is to regulate cross border road transport by providing an unsurpassed service through
advising, facilitating and law enforcement.
Core valuesThe values that embody the organisational culture of the C-BRTA include:
Integrity•
Transparency•
Reliability•
Efficiency•
Effectiveness•
Social responsibility•

Chapter 2
8
CHAIRPERSON’S REPORT
Chairperson’s Report2.
The Cross Border Road Transport Agency (C-BRTA) remains a firm agency of government in terms of
providing advice, regulating the cross border road transport, facilitation, and enforcement of law
within the cross-border industry. The role of the C-BRTA remains critical as its activities lie at the heart
of the South African economy. The C-BRTA’s business activities rely in some way on the provision of a
tangible service that keeps the country moving and growing.
The C-BRTA is ever mindful of the critical importance of its role and strives to do everything possible
to ensure the smooth and safe flow of goods and passengers to and from other neighbouring
countries.
The C-BRTA turn-around strategyThe C-BRTA embarked on a turn-around strategy in the 2007/2008 financial year. This strategy was modelled on a four phased medium term turn-around framework with clear timeframes to realise goals and objectives. The roll-out of the turn-around is implemented in the following phases:
Phase 1 was meant for the C-BRTA to develop a resource plan to stabilise it financially from a state of paralysis. It was given a three month period to revive the C-BRTA towards Operational Excellence. The C-BRTA achieved the targets set in Phase 1 in 2007/2008 in that new processes were introduced resulting in more stable revenue income generation.
Phase 2 overlaps with phase 1 activities. It was characterised by improvements on productivity and service. The time frame for this phase was six months and visible change was achieved through inter alia, appointment of qualified senior executives, adoption of an organisational structure that is aligned to the C-BRTA’s mandate and reaching out to stakeholders through visible marketing activities.
Phase 3 involves identification of new business models, products and services to grow the C-BRTA’s revenue. This is dubbed rational experimenting and had a timeframe of 18 months.
Phase 4 is about seeking breakthroughs in the form of real transformation of the business approach and core strategy.
The year under review and the future will be characterised by activities that seek to experiment with innovative ideas in order to achieve the newness. Ultimately the new value creation that will emerge after the complete turn-around cycle will lead to efficiency.
After the progress made on the turn-around strategy in the financial year 2007 to 2008, the C-BRTA refocused on a set of six interdependent strategic objectives, in line with the turn-around strategy for the financial year 2008 to 2009, continuing in the phases of rational experiments and breakthroughs as set out in the turn-around strategy. These objectives were reviewed and accepted by the Board of Directors and Management as the key pillars of their strategic path in the medium term.

9
CHAIRPERSON’S REPORT
Achieve full corporate governance, controls and compliance.•Sustain good financial performance.•Turn the agency around into a sustainable business.•Establish a sound knowledge management system.•Review information systems to ensure efficient support of the Agency’s operational goals.•Introduce/encourage a performance driven culture.•
Each leg of the strategy requires complete commitment from all role players. The strategy has seen a huge financial turn-around of the C-BRTA during the year under review. Enormous strides continue to be made by both the Board and Management and all other key role players to achieve and realise the full implementation of the turn around strategy. Figure 1 depicts the four phases of the turn-around framework.
Figure 1: The Turn-Around Strategy Framework
Operational Excellence
Mission Critical Initiatives & Stabilising
Core Revenue
Breakthroughs
Transforming Core Strategy or Business Approach
New Fundamentals
Improving Productivity, Service and Cost – Non strategic
3-6 Months
Rational Experiments
New Business Models/Products/Ser-vices to grow income
New Value CreationEfficiency
Innovation / Newness
Miss
ion
Financing of the C-BRTAThe C-BRTA remains a self-funding agency, financing itself through money levied from the application and issuing of permits, as well as income derived from law enforcement penalties. The C-BRTA is exploring other means to strengthen its revenue streams.
Corporate governance The Board subscribes to, and is committed to, good corporate governance principles. The Board endeavours to act in a manner that reflects this commitment.
10
CHAIRPERSON’S REPORT
The year under review saw the Board operating with limited capacity. Whilst the lack of capacity was unfortunate, the interventions by the shareholder in ensuring that the Board is fully capacitated
ensured that the Board was able to execute its mandate effectively.
Human resources The Board had set priorities that are aligned to the national objectives in terms of employment equity and skills development. The C-BRTA also has maintained a sound and profound relationship with the trade union leadership.
AcknowledgementsThe unwavering support and leadership by the former Minister of Transport, Mr JT Radebe, made the attainment of the strategic objectives of the C-BRTA possible. The Board looks forward to having the continued support of the new Minister, Mr SJ Ndebele.
My special thanks go to all the Board members for their continued guidance during the year under review.
We acknowledge the role that employees play in developing and driving the success of the C-BRTA. The Management played a key role in supporting the Board to achieve its mandate. Their commitment, loyalty and diligence are truly commendable. Their relentless efforts continue to turn the C-BRTA into an employer of choice.
Though the road ahead is set with challenges, I am confident that with the leadership, oversight and technical expertise that exist within the C-BRTA, nothing is insurmountable.
Chairperson of the Board

Chapter 3
CEO’S REPORT
12
Chief Executive Officer’s Report3.
3.1 IntroductionThis report is in line with provisions of the Public Finance Management Act, 1999 (Act No.1 of 1999) and the Treasury Regulations. It records the performance of the C-BRTA during the financial year 2008/2009.
The year under review has been one of the most challenging for the C-BRTA, albeit that the C-BRTA made remarkable progress towards the realisation of the strategic objectives set.
The mandate entrusted to the C-BRTA is to provide advice, regulation, facilitation and law enforcement in respect of the cross-border road transport by both public and private sectors. Underlying this mandate is the recognition that cross-border road transport plays a central role in the economic and social development of any country.
For the year under review the C-BRTA has faced the following key challenges:High management turnover.•Higher increase on overhead costs than revenue.•Limited revenue streams.•Non-compliance with corporate governance matters.•Resources deteriorating and lack of a reinvestment plan.•Lack of performance culture.•
Through the consistent implementation of the turn-around strategy, the C-BRTA made reasonable progress towards addressing some of these challenges.
3.2 Financial overviewRevenue increased by 25% to R46, 9 million, and operating surplus rose by R3, 2 million. Finance
income increased by 143% due to an increase in investment from R3.3 million to R12, 4 million.
The operating costs increased due to an increase in the staff complement, higher depreciation, and
higher amortisation charges. The amortisation charges were affected by a change in the estimate
of write back compared to the previous year.
Another radical improvement was achieved by the C-BRTA on cash revenue generation. Cash
reserves increased from R1, 4 million to R9, 5 million when compared to the previous year. Cash on
hand also increased by 243% to R13, 3 million compared to R2, 4 million in 2007.
A strong focus on working capital management, budgetary controls and coordination with magistrate
courts have resulted in an increase in working capital to R11, 3 million in the year under review,
compared to R2, 9 million for the previous year. The carrying value of trade receivables increased
due to higher revenues and there was improvement in the number of days outstanding. Better
management of trade and other payables led to a significant decrease of 85% from R3, 2 million to
R1, 8 million.

CEO’S REPORT
13
3.3 Operational overview
3.3.1 The Regulatory FunctionThe main objective of the Regulatory Function is to regulate access to the cross-border road transport
market by means of a permit applications process.
In line with the pursuit of the main objective, the regulation of cross-border road transport, the Function focuses on the following broad processes:
Facilitating the permit application process in compliance with the legislative framework and bi-•lateral and multi-lateral agreements.Advising the Regulatory Committee.•Managing the Regulatory Committee processes.•
The C-BRTA has performed satisfactorily in carrying out its’ mandate according to the regulatory processes. This has also been enhanced through improved stakeholder relations in the implementation of bi-lateral and multi-lateral agreements, on both passenger and freight transport.
However, cross-border road passenger transport between South Africa and the Kingdom of Lesotho has not been conducted in accordance with the provisions of the Southern African Customs Union Memorandum of Understanding (SACU MOU). Consequently the Minister of Transport lifted the moratorium which barred the C-BRTA from issuing cross-border permits to South African operators wishing to ferry passengers to the Kingdom of Lesotho. The lifting of the moratorium created convenience for passengers and operators and uniformity in the application of the SACU MOU.
With regard to the C-BRTA’s financial stability, the Regulatory Function is the main contributor to the C-BRTA’s revenue. During the year under review the total permit income increased by 23%, from R31,2m to R38,4m compared to the previous year. The growth in monthly permit income is depicted in Figure 2 below.
CEO’S REPORT
14
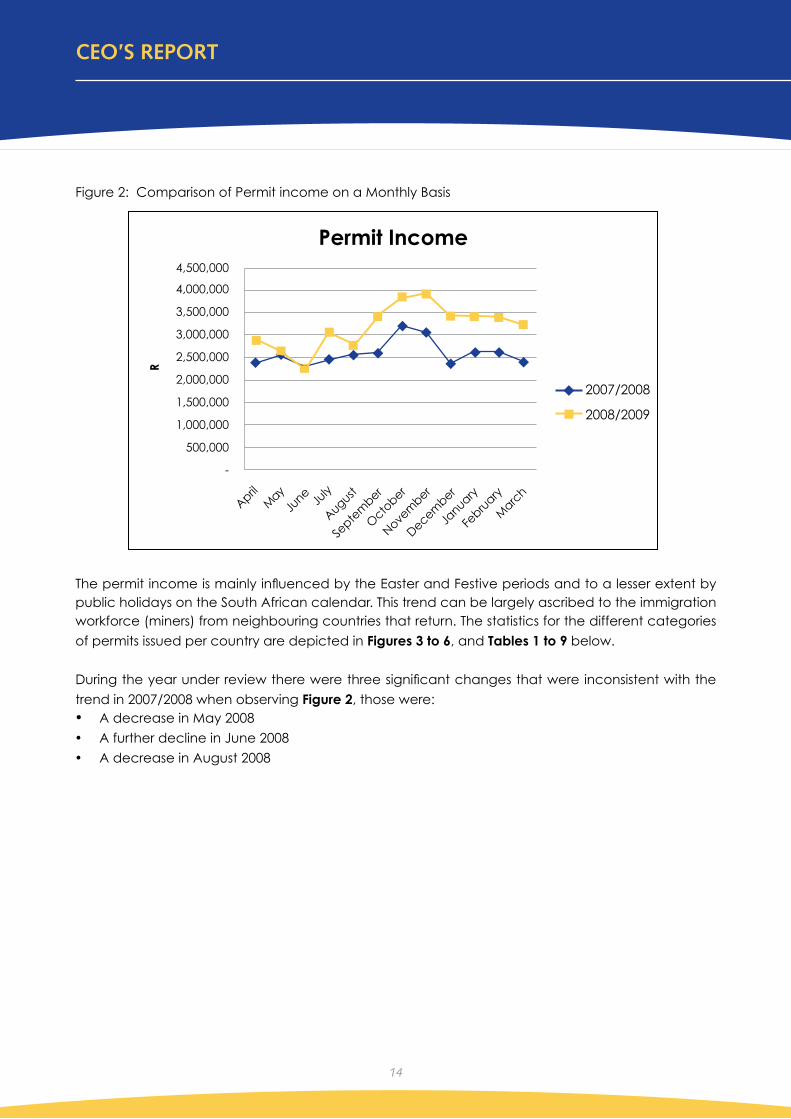
Figure 2: Comparison of Permit income on a Monthly Basis
4,500,000
4,000,000
3,500,000
3,000,000
2,500,000
2,000,000
1,500,000
1,000,000
500,000
-
R
Permit Income
May
April
June
July
August
Septe
mber
Novem
ber
December
January
Febru
ary
Marc
h
Octo
ber
2007/2008
2008/2009
The permit income is mainly influenced by the Easter and Festive periods and to a lesser extent by public holidays on the South African calendar. This trend can be largely ascribed to the immigration workforce (miners) from neighbouring countries that return. The statistics for the different categories
of permits issued per country are depicted in Figures 3 to 6, and Tables 1 to 9 below.
During the year under review there were three significant changes that were inconsistent with the
trend in 2007/2008 when observing Figure 2, those were:A decrease in May 2008•A further decline in June 2008•
A decrease in August 2008•

CEO’S REPORT
15
3.3.1.1 Passengers in taxis
Figure 3: Permit applications for passengers in Taxis
3,500
3,000
2,500
2,000
1,500
1,000
500
-
Permit Applications for Passengers in Taxis
2007/2008
2008/2009
Botsw
ana
Leso
tho
Mala
wi
Moza
mbiq
ue
Namib
ia
Zam
bia
Zimbabwe
Swazila
nd
Table 1: Permit applications for passengers, both permanent and temporary
COUNTRY 2007/2008 2008/2009 DIFFERENCE PERCENTAGE
Botswana 288 495 207 72%
Lesotho 1 401 1 688 287 20%
Malawi 8 5 -3 -38%
Mozambique 2 526 3 052 526 21%
Namibia 42 33 -9 -21%
Swaziland 288 485 197 68%
Zambia - 3 3 -
Zimbabwe 556 1 046 490 88%
Total 5 109 6 807 1 698 33%
CEO’S REPORT
16
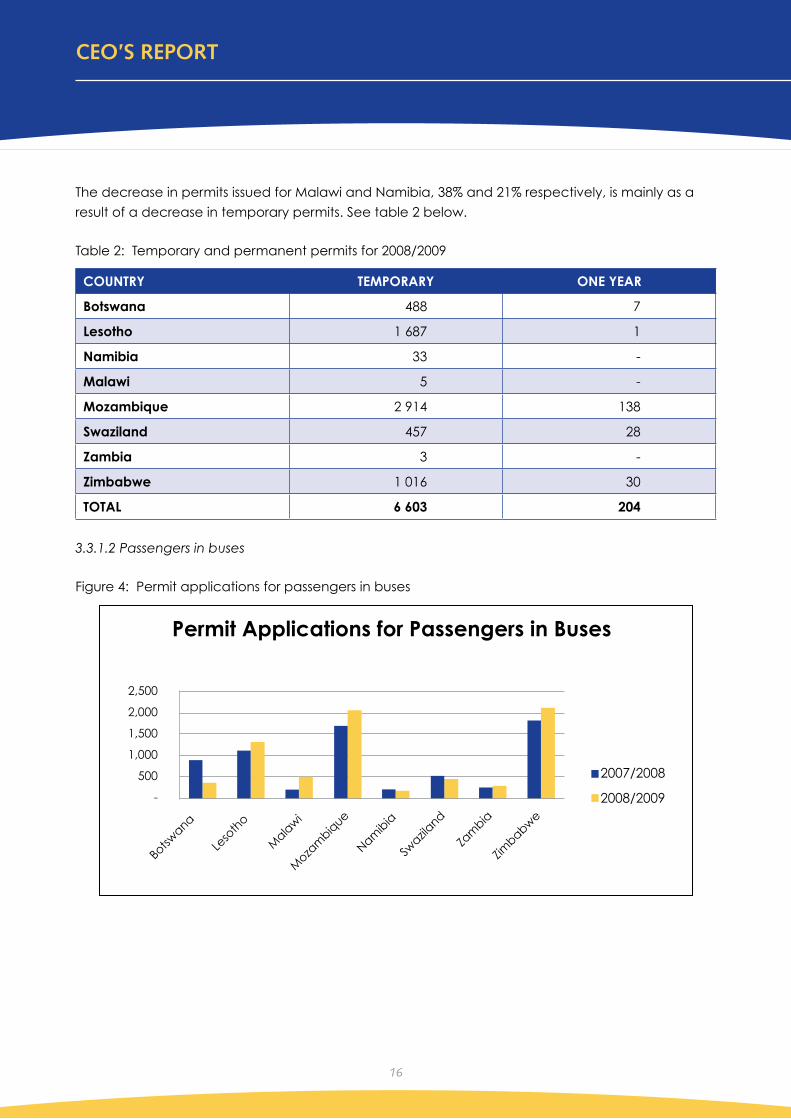
The decrease in permits issued for Malawi and Namibia, 38% and 21% respectively, is mainly as a
result of a decrease in temporary permits. See table 2 below.
Table 2: Temporary and permanent permits for 2008/2009
COUNTRY TEMPORARY ONE YEAR
Botswana 488 7
Lesotho 1 687 1
Namibia 33 -
Malawi 5 -
Mozambique 2 914 138
Swaziland 457 28
Zambia 3 -
Zimbabwe 1 016 30
TOTAL 6 603 204
3.3.1.2 Passengers in buses
Figure 4: Permit applications for passengers in buses
2,500
2,000
1,500
1,000
500
-
Permit Applications for Passengers in Buses
2007/2008
2008/2009
Botsw
ana
Leso
tho
Mala
wi
Moza
mbiq
ue
Namib
ia
Zam
bia
Zimbabwe
Swazila
nd

CEO’S REPORT
17
Table 3: Permit applications for passengers in buses
COUNTRY 2007/2008 2008/2009 DIFFERENCE PERCENTAGE
Botswana 876 364 -512 -58%
Lesotho 1 103 1 307 204 18%
Malawi 191 501 310 162%
Mozambique 1 681 2 036 355 21%
Namibia 206 157 -49 -24%
Swaziland 523 439 -84 -16%
Zambia 257 285 28 11%
Zimbabwe 1 821 2 099 278 15%
Total 6 658 7 188 530 8%
Table 4: Temporary and permanent permits for buses
COUNTRY TEMPORARY ONE YEAR RENEWALS
Botswana 304 3 34
Lesotho 1 053 - 198
Namibia 145 - 5
Malawi 453 14 4
Mozambique 1 347 12 352
Swaziland 365 - 50
Zambia 265 5 7
Zimbabwe 1 643 24 337
Total 5 575 58 987

CEO’S REPORT
18
Table 5: Demographics of bus operators on permanent permits
COUNTRY OWNED BY HISTORICALLY DISADVANTAGED INDIVIDUALS
OWNED BY OTHER INDIVIDUALS
ENTITIES VEHICLES ENTITIES VEHICLES
Botswana - - 1 3
Lesotho 1 2 1 39
Malawi 6 22 - -
Mozambique 3 17 3 49
Zambia 2 17 - -
Zimbabwe 19 47 2 13
Total 31 105 7 104
This sector of the industry is dominated by historically disadvantaged individuals (HDI’s), 31 HDI entities versus 7 entities owned by other individuals. However vehicles operated by these two categories of individuals are almost the same, 105 (HDI’s) and 104 (other). There are three entities owned by individuals other than HDI’s:
Unitrans (Greyhound and City to City) – Mozambique and Zimbabwe.•Vaal Maseru – Mozambique and Lesotho.•Intercape – Botswana and Mozambique.•
3.3.1.3 FreightThere was an overall increase of 29% in the issuance of permits for the conveyance of goods to our
neighbouring countries.
Figure 5: Permit applications for freight
16,00014,00012,00010,0008,0006,0004,0002,000
-
Permit Applications for Freight
2007/2008
2008/2009
Democra
tic Re
p. Of C
ongo
Botsw
ana
Leso
tho
Mala
wi
Moza
mbiq
ue
Namib
ia
Zam
bia
Zimbabwe
Cabotage
Swazila
nd
CEO’S REPORT
19
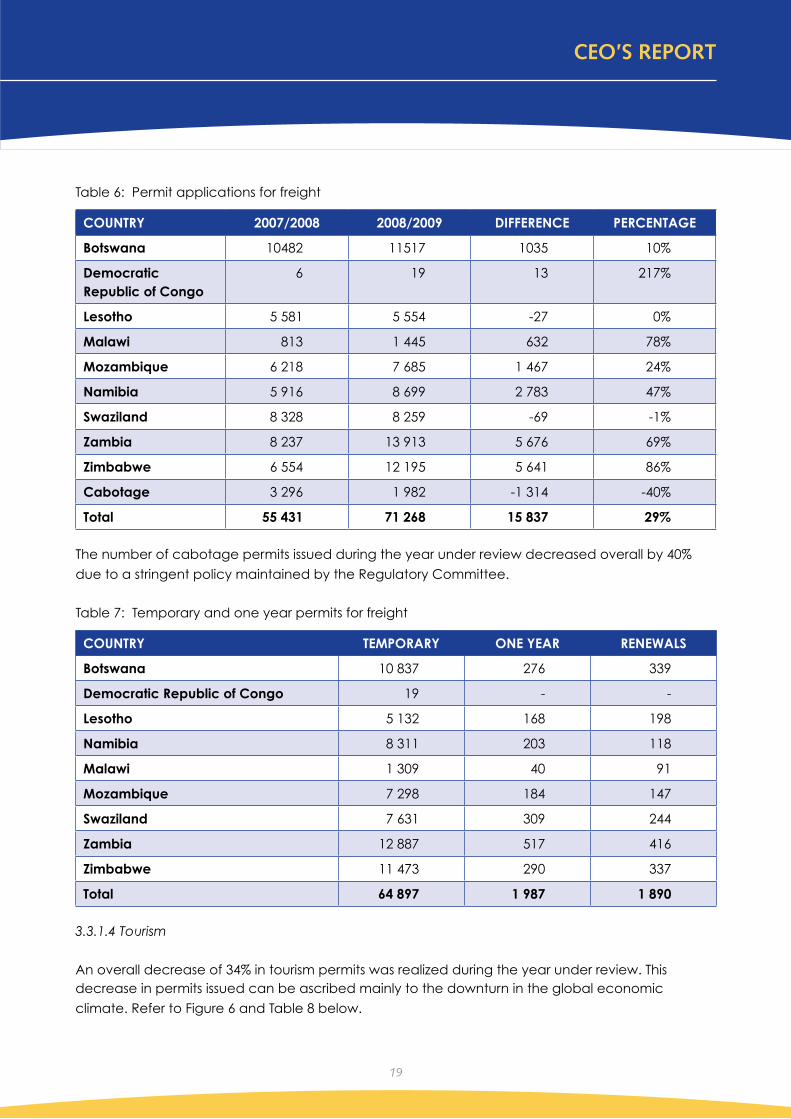
Table 6: Permit applications for freight
COUNTRY 2007/2008 2008/2009 DIFFERENCE PERCENTAGE
Botswana 10482 11517 1035 10%
Democratic Republic of Congo
6 19 13 217%
Lesotho 5 581 5 554 -27 0%
Malawi 813 1 445 632 78%
Mozambique 6 218 7 685 1 467 24%
Namibia 5 916 8 699 2 783 47%
Swaziland 8 328 8 259 -69 -1%
Zambia 8 237 13 913 5 676 69%
Zimbabwe 6 554 12 195 5 641 86%
Cabotage 3 296 1 982 -1 314 -40%
Total 55 431 71 268 15 837 29%
The number of cabotage permits issued during the year under review decreased overall by 40%
due to a stringent policy maintained by the Regulatory Committee.
Table 7: Temporary and one year permits for freight
COUNTRY TEMPORARY ONE YEAR RENEWALS
Botswana 10 837 276 339
Democratic Republic of Congo 19 - -
Lesotho 5 132 168 198
Namibia 8 311 203 118
Malawi 1 309 40 91
Mozambique 7 298 184 147
Swaziland 7 631 309 244
Zambia 12 887 517 416
Zimbabwe 11 473 290 337
Total 64 897 1 987 1 890
3.3.1.4 Tourism
An overall decrease of 34% in tourism permits was realized during the year under review. This decrease in permits issued can be ascribed mainly to the downturn in the global economic
climate. Refer to Figure 6 and Table 8 below.

CEO’S REPORT
20
Figure 6: Permit applications for tourism
Permit Applications for Tourism5000
4500
4000
3500
3000
2500
2000
1500
1000
500
0
2007/2008 2008/2009
Table 8: Permit applications for tourism
2007/2008 2008/2009 DIFFERENCE PERCENTAGE
4 510 2 989 -1 521 -34%
3.3.2 The Law Enforcement FunctionThe main objective of this Function is to enforce the provisions of the Cross Border Road Transport Act,
as amended, and any other legislation conferring certain duties on the Road Transport Inspectors.
The Function consists of seven regional offices and operates at all major commercial border posts throughout the country. The Road Transport Inspectorate is responsible for:
Enforcing the provisions of The Cross-Border Road Transport Act, as amended, bi-lateral and multi-•lateral road transport agreements and permit conditions.Enforcing the provisions of any other legislation that confers certain rights and duties upon the •Road Transport Inspectorate.Supporting the Board and Regulatory Committee in the performance of their functions. •
The overall performance of the Law Enforcement Function has improved for the year under review compared with previous reporting periods. Although the number of inspections decreased by 31% compared with the previous year, prosecutions increased by a notable 54%, which led to an increase in penalty income of 30%. This may be attributed to a shift in focus of the Road Transport Inspectorate to ensure stringent compliance of operators and carriers. The statistics for the Function are depicted
in the Figures 7 and 8 and Table 9 below.

CEO’S REPORT
21
Figure 7: Operational Activity within Law Enforcement
Operational Activity
2007/2008
2008/2009
90,000
80,000
70,000
60,000
50,000
40,000
30,000
20,000
10,000
-
Table 9: Law Enforcement Operational activity statistics
ACTIVITY 2007/2008 2008/2009 DIFFERENCE PERCENTAGE
Vehicle Inspections 82 139 56 434 -25 705 -31%
Prosecutions 7 227 11 095 3 868 54%
Cabotage Fines 113 166 53 47%
Overloading 93 184 91 98%

CEO’S REPORT
22
Figure 8: Penalty income
2007/2008
2008/2009
Penalty Income
CabotageFines
Overloading Roadblocks Total
9,000,000
8,000,000
7,000,000
6,000,000
5,000,000
4,000,000
3,000,000
2,000,000
1,000,000
-
Table 10: Penalty income
ACTIVITY 2007/2008 2008/2009 DIFFERENCE PERCENTAGE
Cabotage Fines R389 600 R274 400 -R115 200 -30%
Overloading R179 300 R202 400 R23 100 13%
Roadblocks R5 727 250 R7 705 450 R1 978 200 35%
Total R6 296 150 R8 182 250 R1 886 100 30%
Cabotage operations decreased due to increased demand to respond to requests to have joint law enforcement operations with other law enforcement authorities. Penalty income generated
through cabotage offences therefore decreased overall by 30%.

CEO’S REPORT
23
Figure 9: Regional Penalty Income
3,000,0002,500,0002,000,0001,500,0001,000,000
500,000-
Regional Income
2007/2008
2008/2009
Blmftn
&Dbn
Belle
ville
& U
pington
Kempto
n Park
Musin
a & M
okopane
Nelspru
it & G
olela
Head Offic
e
Zrst &
Ram
atlabam
a
Table 11: Penalty Income per Region
AREA 2007/2008 2008/2009 DIFFERENCE PERCENTAGE
Bloemfontein and Durban
R701 700 R931 590 R229 890 33%
Bellville and Upington R270 250 R196 700 -R73 550 -27%
Kempton Park R2 086 250 R2 733 750 R647 500 31%
Musina and Mokopane
R1 389 900 R2 685 960 R1 296 060 93%
Nelspruit R983 900 R1 089 250 R105 350 11%
Zeerust R653 050 R412 800 -R240 250 -37%
Head Office R211 100 R132 200 -R 78 900 -37%
Total R6 296 150 R8 182 250 R1 886 100 30%
The overall performance of the regional offices has improved for the year under review due to improved relations with stakeholders which in turn also led to an increase in joint operations with other law enforcement agencies.
Penalty income for the Bellville- Upington regional office decreased by 27% which may largely be attributed to operational capacity constraints within the region, whereas the decrease in penalty income of 37% for the Zeerust regional office may be attributed to a lack of cooperation from stakeholders. The personnel in Head Office are largely fulfilling an administrative function and execute law enforcement duties on a provisional and or rotational basis.

CEO’S REPORT
24
The North-South Corridor and the Maputo Corridor are extremely busy corridors in terms of the movement of passengers and freight. As a result of the aforementioned the Musina-Mokopane and Nelspruit regional offices experienced an increase in penalty income of 93% and 11% respectively. Traffic flows on both these corridors also influenced the penalty income of the Kempton Park
regional office and resulted in an overall increase of 31% for the year under review. Refer to Table 11.
The C-BRTA is in the process of negotiating an agreement with the South African National Road Agency Limited (SANRAL) for the management, control and operation of the Beitbridge Traffic Control Centre (BBTCC). The management and operation of the BBTCC will provide the C-BRTA with a secondary stream of income to finance its operations and will also assist the C-BRTA in improving its operational effectiveness at Beitbridge. Various preparatory steps have been taken to ensure that the C-BRTA is at its optimal of stage of readiness when the facility is commissioned by SANRAL.
The Law Enforcement Function is faced with a challenge in terms of the disparity in training and skills level of inspectors. During the year under review several inspectors were sent for formal training with accredited institutions to assist in bridging the gap in terms of training. The Function is furthermore in the process of compiling a Cross-Border Road Transport Training Manual to ensure consistency in training amongst inspectors. The C-BRTA is currently awaiting accreditation of the training manual.The C-BRTA has launched its official uniform for inspectors in order to assist in terms of visibility and identification of inspectors on the road.
3.3.3 The Facilitation FunctionThe Facilitation Function is mandated by the legislative framework to perform a facilitatory role in ensuring the effective implementation of the road transport agreements concluded between South Africa and SADC member states. The Function is also mandated to facilitate the conclusion of future agreements with member states within the SADC region.
The most pressing challenge in the year under review was the facilitation efforts towards normalisation of cross-border passenger (taxis) transport between South Africa and the Kingdom of Lesotho, as well as increasing awareness among operators on the importance of compliance with the Cross-Border Road Transport Amendment Act, Act 12 of 2008. A significant achievement in the period was the lifting of the ministerial moratorium on the issuance of permits between South Africa and the Kingdom of Lesotho which occurred during March 2009.

CEO’S REPORT
25
Table 12: Facilitation attendance
FORUM MEETINGS NUMBER OF MEETINGS ATTENDED
SADC Ad hoc 1
SACU Quarterly and rotational 1 out of 4
TKC Quarterly and rotational 2 out of 4
Malawi Joint Committee 1 out of 2
Route Management Group 1 out of 2
Joint Route Management Group
1 out of 2
Mozambique Joint Committee 0 out of 2
Route Management Group 2 out of 2
Joint Route Management Group
0 out of 2
Swaziland Joint Committee 1 out of 2
Route Management Group 1 out of 2
Joint Route Management Group
1 out of 2
Zambia Joint Committee 1 out of 2
Route Management Group 1 out of 2
Joint Route Management Group
1 out of 2
Zimbabwe Joint Committee 0 out of 2
Route Management Group 2 out of 2
Joint Route Management Group
0 out of 2
Botswana Joint Committee 1 out of 2
Route Management Group 3 out of 3
Joint Route Management Group
1 out of 2
The general challenges for facilitation included the following:Political instability, especially in Zimbabwe.•The cumbersome referral process of applications for permits.•Un-roadworthy vehicles.•The regulation of bus time tables.•

CEO’S REPORT
26
Traffic congestion on the RSA Zimbabwe road.•Illegal cross-border operations.•Fraudulent permits.•Illegal operations.•Issues on Joint Venture Agreements.•Insurance issues at border posts.•Traffic congestion at border posts.•Municipal road charges.•Traffic congestion at the Kazankula ferry. •Inconsistency in operating hours at border posts.•Vehicle loads and limits. •Southern African Customs Union:• The interactions at the SACU level took place at quarterly intervals and the C-BRTA took part. The main issue on the table remained the normalisation of the Kingdom of Lesotho cross-border issues, as well as a number of technical issues on cross-border road transport.
S• outhern African Development Community: The issues dominating the SADC calendar were road user charges, vehicle dimensions, adherence to the SADC protocol, harmonisation of vehicle
standards across the region, and the implementation of the mooted SADC card driver’s license.
3.3.4 The Advisory FunctionThe Advisory Function became operational in March 2009. Achievements of this Function will be visible in the 2009 / 2010 financial year. The Advisory Function faces the challenge of helping the C-BRTA attain its goal to collect and disseminate relevant information.
The main objective of the Advisory Function is to advise the Minister of Transport and the C-BRTA on the following:
Cross-border road transport policy matters.•Strategies to counteract restrictive measures implemented by other states.•Measures to liberalise market access.•Strategies to reduce operational constraints.•Training needs.•The role of cross-border road transport in fulfilling the objective of integrated transport planning. •
The Advisory Function consists of the Research and Development Department and the Statistics Department. The Statistics Department fell under the Regulatory Division until February 2009.The core functions of these departments are:
To provide statistical reports to assist the Regulatory Committee in regulating access to the market •in respect of cross-border road transport. To assist the Regulatory Committee by collecting and managing information gathered from the •permit conditions documents such as actual trips undertaken, number of passengers, etc.To collect and manage information on general compliance with permit conditions (passenger •lists, consignment notes, and expired permits). To disseminate any useful information, advice or research findings. •To maintain a database with internal and external information on the field of cross-border road •transport.

CEO’S REPORT
27
3.3.5 Support FunctionsApart from the four main functions, five support functions exist in the C-BRTA to assist the main functions in fulfilling their mandate.
3.3.5.1 The Human Resources Function (HR)
The HR Function, which is responsible for the development of human capital to enable the C-BRTA to carry out its legislative mandate, was engaged in various activities aimed at building a performance driven culture in the C-BRTA, in line with the 2008/2011 strategic plan of the C-BRTA.
The focus of the HR Function during the year under review has been systems and institutional development in terms of ensuring policy generation, staff training and development, as well as ensuring that the C-BRTA cultivated sound industrial relations with organised labour.
The HR Function achieved the following in the year under review:The organisational structure was expanded, with the additional posts of executives for •Strategy, Advisory and Transformation; Legal, Risk and Compliance and Corporate Affairs and Communications. During the same period the Chief Financial Officer position was filled in July 2008 and the Chief Executive Officer position was filled in April 2008. A second level of managerial posts was also created consisting of Manager: Research and Development; and Manager: Marketing and Communications.A new Human Resources System, the VIP module, was purchased to commence the skills •development program.A C-BRTA remunerations strategy was developed.•A task team was developed to address salary gaps and anomalies.•
In the year under review the C-BRTA has advanced in employing more women in management, and more people from historically disadvantaged backgrounds.
3.3.5.2 The Strategy Function
The Strategy Function became operational in March 2009. Achievements will be visible in the 2009 2010 financial year. The Strategy Function faces the challenge of helping the C-BRTA attain its goal to improve the flow of road freight and passenger transport in the region and to reduce operational constraints for the cross-border road transport industry.
The main objectives of the Strategy Function were set as the following:Ensure compliance with the C-BRTA Act and other legislation.•Drive the long-term strategic planning process that aligns with the Department of Transport’s •policy direction and the requirements of the C-BRTA Act.Identify, evaluate and prioritise strategic initiatives within the C-BRTA. •Develop long-term C-BRTA strategies. •Review (on an ongoing basis) the appropriateness of the C-BRTA’s current strategic direction and •the implementation of the strategy.Ensure alignment between the Business Functions and Corporate Strategy, cascading strategy •down to the Business Functions.Ensure projects are aligned with the C-BRTA’s strategy and objectives. •Responsible for directing the C-BRTA towards the attainment of the C-BRTA’s objectives. •
CEO’S REPORT
28
3.3.5.3 The Transformation FunctionThe Transformation Function became operational in March 2009. Achievements will be visible in the 2009/2010 financial year. The Transformation Function faces the following challenges: helping the C-BRTA in providing training; capacity building; and the promotion of entrepreneurship generally, and in particular, in respect of small, medium and micro-enterprises with an interest in cross-border road transport.The main objectives of the Transformation Function were set as follows:
To provide training and development of SMMEs in the cross-border road transport industry.•To develop additional revenue streams.•
3.3.5.4 The Marketing and Communications Function
This Function became operational in November 2008 in line with the turn-around strategy of the C-BRTA according to the 2008 to 2011 strategic plan. The Marketing and Communications Function is responsible for the full spectrum of marketing and communications relations within the C-BRTA. The C-BRTA has also changed its corporate brand in line with the turn-around strategy. The roll-out of the new corporate identity was one of the major milestones for this function and was executed during the year under review.
Achievements realised by the Marketing and Communications Function included the following milestones:
The re-launch of the C-BRTA website.•The 10• th anniversary celebrations in conjunction with the other agencies of the Department of Transport.Promotion and creation of awareness on the Amendment Act through countrywide workshops •for the operators through media publicity.The launch of the C-BRTA’s quarterly newsletter, Moving Borders, was a step to improve external •communications.
3.3.5.5 The Legal, Risk and Compliance FunctionThis Function is newly established in line with the turn-around strategy of the C-BRTA according to the 2008 to 2011 strategic plan. The key performance areas of the Legal, Risk and Compliance Function are as follows:
The provision of operational systems that comply with relevant laws, regulations and codes.•The development, implementation and maintenance of sound corporate governance •structures.The elimination / mitigation of all risk elements.•
The Cross-Border Road Transport Amendment Act, No. 12 of 2008 was signed into law during the year under review. The primary purpose of this legislation is to streamline the permit application process, provide certainty in terms of the authority to regulate the industry, close certain regulatory gaps, and streamline the permit application process.
The Amendment Act provided for a window period of six months in which all permits issued by other road transport authorities that purport to authorise cross-border road transport were to be phased out. The window period came to an end on the 28th of February 2009. Various challenges were

CEO’S REPORT
29
faced during the full implementation of the Amendment Act, and processes are currently underway to ensure the full implementation of the provisions of the Act.
The Legal, Risk and Compliance Function is also currently moving progressively forward putting policy frameworks in place to address operational risk and compliance matters.
3.4 Performance against goals
Table 13: Performance against goals
No. Strategic Objectives
Key Performance Indicators
Activities Targets Actual Performance
1. Review Information Systems to ensure efficient support of the agency’s operational goals
A reporting plan. Develop a reporting system.
23 May 2008 In progress.
Develop a user -friendly IT system.
Status report with recommendations.
14 August 2008
Status report done.
2. Sustain good financial performance
Monthly reconciled general ledger.
Timeously and accurately record financial info in terms of GRAP/PFMA.
15 August 2008
Done.
Report on optimising existing sources.
Proposal on alternative funding sources.
Expand revenue streams.
15 August 2008
Not done.
Comprehensive financial policies and procedures.
Develop financial policies and procedures.
23 May 2008 In progress.
Procurement policy.
Improve supply chain management.
23 May 2008 80% complete.
Restructuring proposal to the Minister.
Restructure rates. 23 May 2008 In progress.

CEO’S REPORT
30
No. Strategic Objectives
Key Performance Indicators
Activities Targets Actual Performance
3. Turn the Agency around into a sustainable business.
Quarterly progress reports to the Board.
Maintain stakeholder relations.
31 March 2009
Quarterly reports submitted to the Accounting Authority and Executive Authority.
Quarterly progress reports to the Board.
Maintain and align the Agency’s activities with the national and regional enabling framework.
31 March 2009
Quarterly reports submitted to the Accounting Authority and Executive Authority.
Approved positioning plan.
Improve the corporate image.
15 August 2009
Done.
4. Achieve full corporate governance, controls and compliance
Committees of the Board reports on completed and aligned governance system.
Set up a governance system and align it with the shareholders’ compact.
14 November 2008
In progress.
Properly constituted Board and Committees of the Board with approved terms of references.
Review the constitution of the Board and the Committees of the Board in terms of the Act.
15 August 2008
Board Committees have been aligned with the Act. The process of review is ongoing.
Signed letters of good standing and compliance certificates.
Ensure compliance with other statutes.
14 November 2008
In progress.
Approved delegation document.
Develop a delegation authority matrix.
23 May 2008 In progress.

CEO’S REPORT
31
No. Strategic Objectives
Key Performance Indicators
Activities Targets Actual Performance
5 Inculcate a performance driven culture.
Performance against skills plan/appraisal reports.
Develop a competent and equitable workforce.
Annually. In progress.
All agreements signed.
Adoption and implementation of a performance management and development system.
1 July 2008 Not done.
Approved organisational resourcing plan.
Organisational resourcing.
15 August 2008
In progress.
2010 policy and strategy in place.
Formulate a 2010 policy.
15 August 2008
In progress.
6 Establish a sound knowledge management system.
Concept proposal.
Create a research and Development Function.
15 August 2008
Done.
Implemented system and documented manual.
Develop and maintain a regional knowledge hub.
15 August 2008
In progress.
3.5 Future Outlook for 2009 – 2011 The C-BRTA’s forward-looking perspective over the next three years will be paralleled to the government’s service delivery priorities of:
Accelerating economic growth and job creation.•Modernizing infrastructure and services. •Putting people first.•
In this regard, the C-BRTA, through its’ turn-around framework has planned for improved performance to achieve breakthroughs in transforming its’ business approach. Through the same strategic objectives, the C-BRTA will adopt a strategy that seeks to align with the above government priorities and enhance its’ services to meet the demand of the citizenry to exercise their economic right with the SADC countries. Furthermore, the C-BRTA will strengthen existing relations with SADC counterparts and enter into new bilateral agreements with Angola, Tanzania and the Democratic Republic of Congo.
The external stakeholder management role will be boosted by the creation of clear structures to manage cross-border routes and take up issues that affect our cross-border road transport operators.

CEO’S REPORT
32
The strategy for the years 2009 – 2011 incorporates strategic programmes which will mark the beginning of a new value creation. The business approach towards efficiency will have an overall impact in creating seamless economic activity between South Africa and other SADC countries and will result in future socio-economic growth of the whole region. Some of the future strategic programmes include:
Reviewing policies, bilateral and multilateral agreements in order to identify loopholes that hinder •efficient service delivery.Conclusion of new bilateral agreements with other SADC states.•Review our permit tariffs so as to benchmark with market-related standards.•Design an integrated Permit Management System and related business processes.•Develop a knowledge management strategy that will contribute to strategic planning and •efficiency, as well as providing assistance on knowledge and information to sister countries who might need it.Develop a new business and financial model, which will identify other sources of revenue, with a •long-term intention to be able to realise some dividends to contribute to the state coffers.Adopt a C-BRTA BBBEE Strategy and continuously empower SMME’s.•Play a meaningful role during preparation for the 2010 FIFA World Cup.•Develop a performance management system, which is tied to employee development and •wellness.Strive to eradicate all audit queries and aiming for a 100% clean audit.•
The C-BRTA will look to the support of all the stakeholders, particularly the shareholder, the Department of Transport, for support to achieve the above programmes.
3.6 ConclusionIn conclusion, the 2008/09 annual report is a reflection of the highlights of the C-BRTA’s move towards
transforming itself to realise its’ vision of being a leading cross-border road transport regulator in the
SADC region.
It is hoped that this report will add value to different stakeholders to assist them to form an aggregate
picture of the functioning of the Cross-Border Road Transport Agency. It is also hoped that it will be
viewed as a valuable accountability record of the C-BRTA’s performance to the shareholder and all
relevant stakeholders.
The financial and operational results would not have materialised without the commitment and
dedication of all the C-BRTA staff. I would therefore like to take this opportunity to thank not only the
staff for their assiduous efforts, but also the Board for their guidance and leadership in contributing to
these achievements.

Chapter 4

34
CORPORATE GOVERNANCE
Corporate Governance4.
4.1 The Board of Directors
Mr Gilbert Phalafala (Chairperson)
Ms Nobuhle Ally (Deputy Chairperson)
Ms Maria Du PreezMr Hartley Dikgale Ms Brenda Horne-Ferreira
Mr Bongi MpondoMs Hellen Mnguni Mr Lungelo Twalo

35
CORPORATE GOVERNANCE
4.2 Statement of Responsibility
The C-BRTA Board members are committed to the principles of transparency, integrity and accountability. Through the implementation of corporate governance principles, shareholders and other stakeholders may be assured that the C-BRTA is being ethically managed according to prudently determined risk parameters in compliance with generally accepted corporate practices. The Performance Agreement regulates the C-BRTA’s relationship with the Minister of Transport in the interests of good corporate governance and upholding ethical standards.
The members are responsible for the preparation, integrity and fair presentation of the financial statements of the C-BRTA. The financial statements presented on pages 45 to 50 have been prepared in accordance with International Financial Reporting Standards (IFRS), and include amounts based on judgments and estimates made by management.
The going concern basis has been adopted in preparing the financial statements. The members believe that, based on the projected Medium Term Expenditure Framework (MTEF) allocations and the policy of adjusting the permit fees in line with the Consumer Price Index, the C-BRTA will be a going concern in the foreseeable future. These financial statements support the viability of the C-BRTA.
The financial statements have been audited by independent auditors, who were given unrestricted access to all financial records and related data, including minutes of all meetings of the members of the Board and subcommittees of the Board.
The financial statements were presented to the Audit and Risk Committee on 26 May 2009 and were approved by the committee as appointed members of the Board in terms of the Cross-Border Road transport Act (Act No. 4 of 1998). This committee has assumed the responsibilities of the members of the Board and the financial statements are signed on its behalf.
4.3 Members of the BoardThe C-BRTA has a unitary Board composition, made up of a majority of non-executive members, the only executive member being the Chief Executive Officer. Members are appointed into office for a period of three years by the Minister of Transport as the C-BRTA’s sole shareholder. The Board comprises a minimum of four and a maximum of ten members. For the period under review the
Board had a eight of members, all of whom were appointed in October 2006.

36
CORPORATE GOVERNANCE
Table 14: Board Meeting Attendance
Member Number of meetings
Mr. Gilbert Phalafala – Chairperson 5 out of 6
Ms. Nobuhle Ally – Deputy Chairperson 5 out of 6
Mr. Hartley Dikgale 4 out of 6
Mr. Bongi Mpondo 5 out of 6
Ms. Brenda Horne – Ferreira 5 out of 6
Ms. Maria Du Preez 6 out of 6
Mr. Lungelo Twalo 5 out of 6
Ms. Helen Mnguni (ex officio) 5 out of 6
Mr. Leroy Nsibande (CEO) out of 64
4.4 The Board CommitteesCommittees have been constituted to oversee various aspects of the Agency business:
The Regulatory Committee considers permit applications and grants them as necessary. It also •
advises on the law enforcement inspectorate function.
The Audit and Risk Committee oversees and advises on audit and risk matters. The Audit and Risk •
Committee report is included on page 40 to 44.
The Human Resources and Remuneration Committee provides guidance for the Human Resource •
Function.
4.4.1 The Regulatory CommitteeThe Regulatory Committee comprises of the following members:
The Chairperson and Deputy Chairperson of the Board, who also serve as Chairperson and •
Deputy Chairperson of this committee.
Four members.•
The Chief Executive Officer (CEO).•
Table 15: Regulatory Committee attendance
Name Status Number of Meetings
Mr. PG Phalafala Chairperson 3 out of 10
Ms. N Ally Deputy Chairperson 6 out of 10
Ms. M du Preez Member 9 out of 10
Mr. H Dikgale Member 6 out of 10
Mr. B Mpondo Member 4 out of 10
Mr. L Twalo Member 4 out of 10
Mr. LM Nsibande CEO 6 out of 10
37
CORPORATE GOVERNANCE
During the year under review 1 862 applications were considered of which 1 609 were granted, 146 refused and 107 postponed. The majority of the applications that were refused were because applicants could not prove a need for the road transport and/or the financial feasibility of operations
on that route.
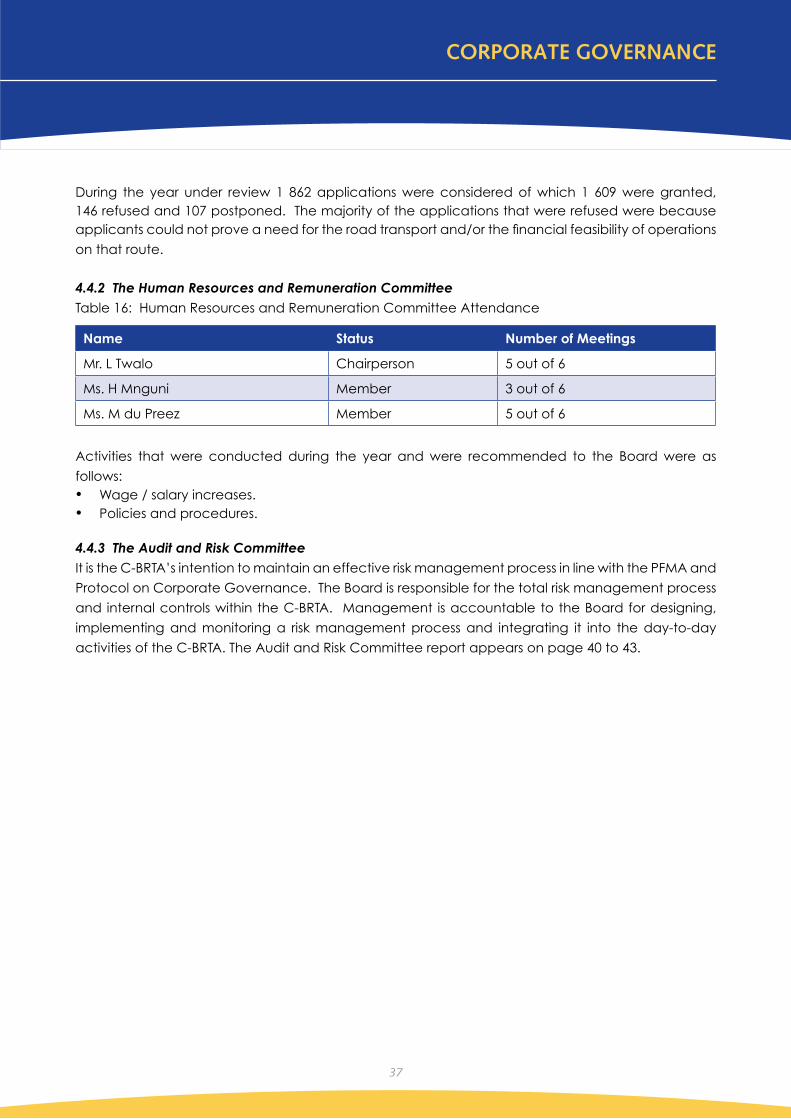
4.4.2 The Human Resources and Remuneration CommitteeTable 16: Human Resources and Remuneration Committee Attendance
Name Status Number of Meetings
Mr. L Twalo Chairperson 5 out of 6
Ms. H Mnguni Member 3 out of 6
Ms. M du Preez Member 5 out of 6
Activities that were conducted during the year and were recommended to the Board were as
follows:Wage / salary increases.•Policies and procedures.•
4.4.3 The Audit and Risk CommitteeIt is the C-BRTA’s intention to maintain an effective risk management process in line with the PFMA and
Protocol on Corporate Governance. The Board is responsible for the total risk management process
and internal controls within the C-BRTA. Management is accountable to the Board for designing,
implementing and monitoring a risk management process and integrating it into the day-to-day
activities of the C-BRTA. The Audit and Risk Committee report appears on page 40 to 43.

38

Chapter 5

40
EXECUTIVE MANAGEMENT
Executive Management5.
The Executive Management team consists of: Mr. Sethakgi Kgomo: Executive: Corporate Affairs and Communication.Ms. Dané Loedolff: Executive: Strategy, Advisory and Transformation.Ms. Makhosazane Mvulane: Chief Financial Officer.Mr. Ronald Stuurman: Executive: Legal, Risk and Compliance.

Chapter 6

42
FINANCIAL PERFORMANCE
Financial Performance6.
6.1 Audit and Risk Committee ReportIn terms of its obligations according to Treasury Regulations 27.1.10, the Audit Committee reports as follows on certain events as well as its actions and findings in respect of the financial year ended 31 March 2009.
Meetings and AttendanceAn Audit and Risk Committee for the C-BRTA has been established in accordance with the requirements of Section 38 (1) (a) (ii) and 77 of the Public Finance Management Act. During the year under review the Audit and Risk Committee comprised of four members, all members being from outside the public service.
The Audit and Risk Committee meets four times per annum and on an “ad hoc” basis to consider specific matters, as per its approved terms of reference. The Audit and Risk Committee furthermore met with the Auditor-General during the year under review.
Audit and Risk Committee AttendanceTable 17: Audit and Risk Committee attendance
Name Status Number of Meetings
Mr. M Patel Chairperson 6 out of 6
Ms. B Horne-Ferreira Member 3 out of 6
Mr. L Twalo Member 4 out of 6
Mr. S Ranchhoojee Member 6 out of 6
Audit and Risk Committee ResponsibilityThe Audit and Risk Committee has complied with its responsibilities arising from Section 38(1) (a) (ii) of the PFMA and Treasury Regulation 27.1.8. The Audit and Risk Committee adopted the Audit and Risk Committee Charter read in conjunction with the Internal Auditor Charter, as its’ terms of reference in discharging all its responsibilities as regulated therein.
The Effectiveness of Internal ControlsThe systems of internal control was evaluated by the Auditor-General (external audit), and in various cases the quality of the implementation and execution of adequate control and work procedures were not yet of an acceptable standard. This is evident from reported instances of non-conformity with prescribed internal control and best practice.
The appointed Audit and Risk Committee developed a comprehensive detailed plan as an intervention measure to remedy the matters of emphasis of the annual financial statements, reported by the Auditor-General in the 2008/9 financial year. Issues were prioritized in accordance with their materiality and fundamental effect on the overall management of the C-BRTA.

43
FINANCIAL PERFORMANCE
The plan includes Management’s contribution of the details of action on the plan, scheduled target dates for implementation, monitoring and evaluation of the plan, as well as agreed critical performance indicators. Management implemented measures that will be monitored on a regular basis by the Audit and Risk Committee to ensure the planned targets are achieved.
Specific Focus Areas Going ForwardDuring the ensuring 2009/10 financial year, the Audit Committee will develop comprehensive and integrated intervention programmes to focus more attention on the following areas:
The continuation of the implementation of the integrated information management systems in •accordance with the C-BRTA Master System Plan.The enhancement and further development of the Human Resource Function.•Enhancement of skills development and succession planning strategy and implementation.•Quarterly reporting on the performance of the C-BRTA against approved annual business plan.•Improvement of safe record keeping capacity, policies and procedures in compliance with the •prescripts for archiving by establishment of an electronic registry system.Motivate and encourage the culture of risk management and compliance to policies and •procedures and to encourage the C-BRTA to progress to Enterprise-Wide Risk Management.
Quality of In Year Management and Monthly or Quarterly Reports Submitted in terms of the PFMA and the Division of Revenue Act The Audit and Risk Committee has not noted progress in the content and quality of monthly and quarterly reports prepared and issued by the Accounting Authority and the C-BRTA during the year under review, in compliance with statutory reporting framework requirements such as the PFMA and Treasury Regulations. The C-BRTA has not implemented measures to fully implement the control basis for monitoring and attaining of strategic goals and business objectives within a structured framework,
a process that has been specifically targeted for 2009/10 and will continue in 2010/11.
Internal AuditThe internal audit function is outsourced. The internal audit plan was approved and work was conducted accordingly. The contract ended on the 31st of March 2009, but was extended to the 30th of September 2009.
Effectiveness of Internal ControlsCertain senior posts were vacant at times during the reporting year which substantially affected the control environment. The appointment of permanent staff for these positions has received the attention of the Accounting Authority subsequent to the financial year end.
In our opinion, based on the report back of the service providers and information reported during our Audit and Risk Committee meetings, the internal control environment contained significant weaknesses which needed attention in the financial year. We further believe that valuable findings were reported by the auditors. These have been followed up with a view to correction in the new financial year and will need specific focus and attention to bring them to an acceptable conclusion. Management have been tasked by this Audit and Risk Committee to report on progress to us and the Accounting Authority.
44
Evaluation of Annual Financial StatementsThe Audit and Risk Committee has:
Reviewed and discussed with the Auditor-General and the Accounting Officer the audited •
annual financial statements to be included in the report.
Reviewed the Auditor-General’s management letter and management’s response.•
Reviewed the accounting policies and practices.•
Reviewed significant adjustments resulting from the audit.•
The Audit and Risk Committee concurs and accepts the conclusions of the Auditor-General on the
annual financial statements and is of the opinion that the audited annual financial statements be
accepted and read together with the report of the Auditor-General.
MITESH PATELCHAIRPERSON OF THE AUDIT AND RISK COMMITTEE
August 200925
FINANCIAL PERFORMANCE

45
6.2 Auditor General’s report
REPORT OF THE AUDITOR-GENERAL TO PARLIAMENT ON THE FINANCIAL STATEMENTS AND PERFORMANCE INFORMATION OF THE CROSS-BORDER ROAD TRANSPORT AGENCY FOR THE YEAR ENDED 31 MARCH 2009
Report on the financial statements
IntroductionI have audited the accompanying financial statements of the Cross-Border Road Transport 1. Agency (C-BRTA) which comprise the statement of financial position as at 31 March 2009, and the statement of financial performance, the statement of changes in net assets and the cash flow statement for the year then ended, and a summary of significant accounting policies and other explanatory notes, as set out on pages 55 to 81.
The accounting authority’s responsibility for the financial statementsThe accounting authority is responsible for the preparation and fair presentation of these financial 2. statements in accordance with the basis of accounting determined by the National Treasury, as set out in accounting policy note 1.1 and in the manner required by the Public Finance Management Act, 1999 (Act No. 1 of 1999) (PFMA) and the Cross-Border Road Transport Act, 1998 (Act No. 4 of 1998) and for such internal control as the accounting authority determines is necessary to enable the preparation of financial statements that are free from material misstatement, whether due to fraud or error.
The Auditor-General’s responsibility As required by section 188 of the Constitution of the Republic of South Africa, 1996 read with 3. section 4 of the Public Audit Act, 2004 (Act No. 25 of 2004) (PAA) and section 19(3) of the Cross-Border Road Transport Act, 1998 (Act No. 4 of 1998), my responsibility is to express an opinion on these financial statements based on my audit.
I conducted my audit in accordance with the International Standards on Auditing read with 4. General Notice 616 of 2008, issued in Government Gazette No. 31057 of 15 May 2008. Those standards require that I comply with ethical requirements and plan and perform the audit to obtain reasonable assurance about whether the financial statements are free from material misstatement.
An audit involves performing procedures to obtain audit evidence about the amounts and 5. disclosures in the financial statements. The procedures selected depend on the auditor’s judgement, including the assessment of the risks of material misstatement of the financial statements, whether due to fraud or error. In making those risk assessments, the auditor considers internal control relevant to the entity’s preparation and fair presentation of the financial statements in order to design audit procedures that are appropriate in the circumstances, but not for the purpose of expressing an opinion on the effectiveness of the entity’s internal control. An audit also includes evaluating the appropriateness of accounting policies used and the reasonableness of accounting estimates made by management, as well as evaluating the overall presentation of the financial statements.
FINANCIAL PERFORMANCE

46
I believe that the audit evidence I have obtained is sufficient and appropriate to provide a basis 6. for my audit opinion.
Basis for qualified opinion
Irregular expenditure The public entity has not submitted a budget to the executive authority for approval. This is contrary 7. to section 53(1) of the PFMA, which requires the submission of the budget to the executive authority at least six months before the start of the financial year and section 53(4) of the PFMA, which requires that the accounting authority is responsible for ensuring that the expenditure of the public entity is in accordance with the approved budget. In the absence of an approved budget, all expenditure is viewed as irregular expenditure. This has not been disclosed as irregular expenditure as required by section 55(2)(b)(i) of the PFMA. Approval of the budget has not been received as at the date of the audit report
Permit incomeIncluded in the exchange revenue amounting to R46.9 million as disclosed in note 11 to the 8. financial statements is permit fees amounting to R37.8 million.
The Cross-Border Road Transport System (C-BRTS) is utilised to generate permit fees and this information is transferred to the financial system for inclusion in the financial statements. A significant number of basic control weaknesses, which include the following, were identified in the control environment surrounding the C-BRTS, as well as within the C-BRTS application:
Comprehensive information technology policies, standards and procedures did not exist. • Users therefore had no rules or procedures to follow to prevent errors and fraud, and ensure data confidentiality, integrity and availability.
The change control process had not been documented and approved to ensure that • changes to the system, applications, network or infrastructure would be appropriately and consistently implemented without negatively affecting the IT production environment.
Application and user controls were inadequate to ensure correct processing of data. • Furthermore, controls were not in place to prevent inaccurate, incomplete and invalid data from being captured or processed. Permit number details included on invoices generated from the system did not agree with permit number details included on reports generated from the system.
Due to insufficient supporting permit application documentation for 32% of the selected items, I was unable to confirm and verify by alternative audit procedures the occurrence, completeness and accuracy of permit income.
Consequently, I did not obtain sufficient appropriate audit evidence to satisfy myself as to the occurrence, completeness and accuracy of the permit fees as disclosed in the financial statements, and I was not able to determine whether any adjustments might have been necessary to the amounts shown in the financial statements for exchange revenue, trade and other receivables and accumulated surplus.
FINANCIAL PERFORMANCE

47
Penalty incomeIncluded in the exchange revenue of R46.9 million as disclosed in note 11 to the financial 9. statements is penalty income amounting to R8.2 million. Fines issued by the agency are not reconciled to ensure that all fines issued have been processed by the courts and captured by the C-BRTA and that all amounts are paid to the C-BRTA. Consequently, I was unable to satisfy myself by alternative audit procedures the completeness and accuracy of the penalty income as disclosed in the financial statements, and I was not able to determine whether any adjustments might have been necessary to the amounts shown in the financial statements for exchange revenue, trade and other receivables and accumulated surplus.
Income received in advanceIncluded in the income received in advance of R1.04 million as disclosed in note 8.1 to the 10. financial statements is income received in advance from various courts amounting to R337 000. Due to insufficient appropriate audit evidence, I was unable to confirm and verify by alternative audit procedures the rights, valuation and allocation, and classification of income received in advance. Consequently, I was unable to satisfy myself as to the rights, valuation and allocation and classification of income received in advance as disclosed in the financial statements, and I was not able to determine whether any adjustments might have been necessary to the amounts shown in the financial statements for income received in advance, exchange revenue and accumulated surplus.
Qualified opinion In my opinion, except for the possible effects of the matters described in the Basis for qualified 11. opinion paragraphs, the financial statements present fairly, in all material respects, the financial position of the Cross-Border Road Transport Agency as at 31 March 2009 and its financial performance and its cash flows for the year then ended, in accordance with the basis of accounting determined by the National Treasury, as set out in accounting policy note 1.1 and in the manner required by the PFMA.
Emphasis of matters I draw attention to the following matters on which I do not express a qualified opinion:
Basis of accounting The public entity’s policy is to prepare financial statements on the basis of accounting determined 12. by the National Treasury, as set out in accounting policy note 1.1.
Fruitless and wasteful expenditure As disclosed in note 25 to the financial statements, fruitless and wasteful expenditure to the 13. amount of R36 801 was incurred, due to late payment of accounts.
Other mattersI draw attention to the following matters that relates to my responsibilities in the audit of the financial statements:
FINANCIAL PERFORMANCE
48
Non-compliance with applicable legislation
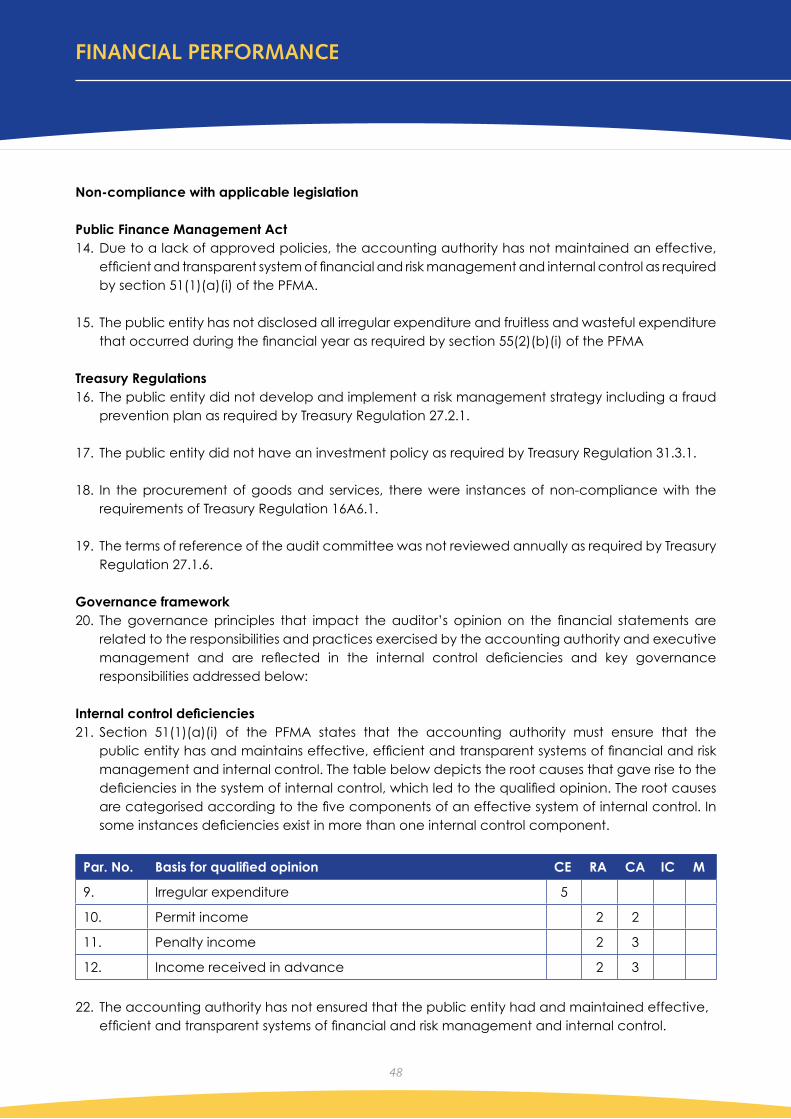
Public Finance Management ActDue to a lack of approved policies, the accounting authority has not maintained an effective, 14. efficient and transparent system of financial and risk management and internal control as required by section 51(1)(a)(i) of the PFMA.
The public entity has not disclosed all irregular expenditure and fruitless and wasteful expenditure 15. that occurred during the financial year as required by section 55(2)(b)(i) of the PFMA
Treasury RegulationsThe public entity did not develop and implement a risk management strategy including a fraud 16. prevention plan as required by Treasury Regulation 27.2.1.
The public entity did not have an investment policy as required by Treasury Regulation 31.3.1.17.
In the procurement of goods and services, there were instances of non-compliance with the 18. requirements of Treasury Regulation 16A6.1.
The terms of reference of the audit committee was not reviewed annually as required by Treasury 19. Regulation 27.1.6.
Governance frameworkThe governance principles that impact the auditor’s opinion on the financial statements are 20. related to the responsibilities and practices exercised by the accounting authority and executive management and are reflected in the internal control deficiencies and key governance responsibilities addressed below:
Internal control deficienciesSection 51(1)(a)(i) of the PFMA states that the accounting authority must ensure that the 21. public entity has and maintains effective, efficient and transparent systems of financial and risk management and internal control. The table below depicts the root causes that gave rise to the deficiencies in the system of internal control, which led to the qualified opinion. The root causes are categorised according to the five components of an effective system of internal control. In some instances deficiencies exist in more than one internal control component.
Par. No. Basis for qualified opinion CE RA CA IC M
9. Irregular expenditure 5
10. Permit income 2 2
11. Penalty income 2 3
12. Income received in advance 2 3
The accounting authority has not ensured that the public entity had and maintained effective, 22. efficient and transparent systems of financial and risk management and internal control.
FINANCIAL PERFORMANCE

49
Legend
CE = Control environment
The organisational structure does not address areas of responsibility and lines of reporting to support effective control over financial reporting.
1
Management and staff are not assigned appropriate levels of authority and responsibility to facilitate control over financial reporting.
2
Human resource policies do not facilitate effective recruitment and training, disciplining and supervision of personnel.
3
Integrity and ethical values have not been developed and are not understood to set the standard for financial reporting.
4
The accounting officer/accounting authority does not exercise oversight responsibility over financial reporting and internal control.
5
Management’s philosophy and operating style do not promote effective control over financial reporting.
6
The entity does not have individuals competent in financial reporting and related matters. 7
RA = Risk assessment
Management has not specified financial reporting objectives to enable the identification of risks to reliable financial reporting.
1
The entity does not identify risks to the achievement of financial reporting objectives. 2
The entity does not analyse the likelihood and impact of the risks identified. 3
The entity does not determine a risk strategy/action plan to manage identified risks. 4
The potential for material misstatement due to fraud is not considered. 5
CA = Control activities
There is inadequate segregation of duties to prevent fraudulent data and asset misappropriation.
1
General information technology controls have not been designed to maintain the integrity of the information system and the security of the data.
2
Manual or automated controls are not designed to ensure that the transactions have occurred, are authorised, and are completely and accurately processed.
3
Actions are not taken to address risks to the achievement of financial reporting objectives. 4
Control activities are not selected and developed to mitigate risks over financial reporting. 5
Policies and procedures related to financial reporting are not established and communicated.
6
Realistic targets are not set for financial performance measures, which are in turn not linked to an effective reward system.
7
FINANCIAL PERFORMANCE

50
IC = Information and communication
Pertinent information is not identified and captured in a form and time frame to support financial reporting.
1
Information required to implement internal control is not available to personnel to enable internal control responsibilities.
2
Communications do not enable and support the understanding and execution of internal control processes and responsibilities by personnel.
3
M = Monitoring
Ongoing monitoring and supervision are not undertaken to enable an assessment of the effectiveness of internal control over financial reporting.
1
Neither reviews by internal audit or the audit committee nor self -assessments are evident. 2
Internal control deficiencies are not identified and communicated in a timely manner to allow for corrective action to be taken.
3
Key governance responsibilitiesThe PFMA tasks the accounting authority with a number of responsibilities concerning financial 23. and risk management and internal control. Fundamental to achieving this is the implementation of key governance responsibilities, which I have assessed as follows:
No. Matter Y N
Clear trail of supporting documentation that is easily available and provided in a timely manner
1. No significant difficulties were experienced during the audit concerning delays or the availability of requested information.
Quality of financial statements and related management information
2. The financial statements were not subject to any material amendments resulting from the audit.
3. The annual report was submitted for consideration prior to the tabling of the auditor’s report.
Timeliness of financial statements and management information
4. The annual financial statements were submitted for auditing as per the legislated deadlines section 55 of the PFMA
Availability of key officials during audit
5. Key officials were available throughout the audit process.
Development and compliance with risk management, effective internal control and governance practices
6. Audit committee
FINANCIAL PERFORMANCE
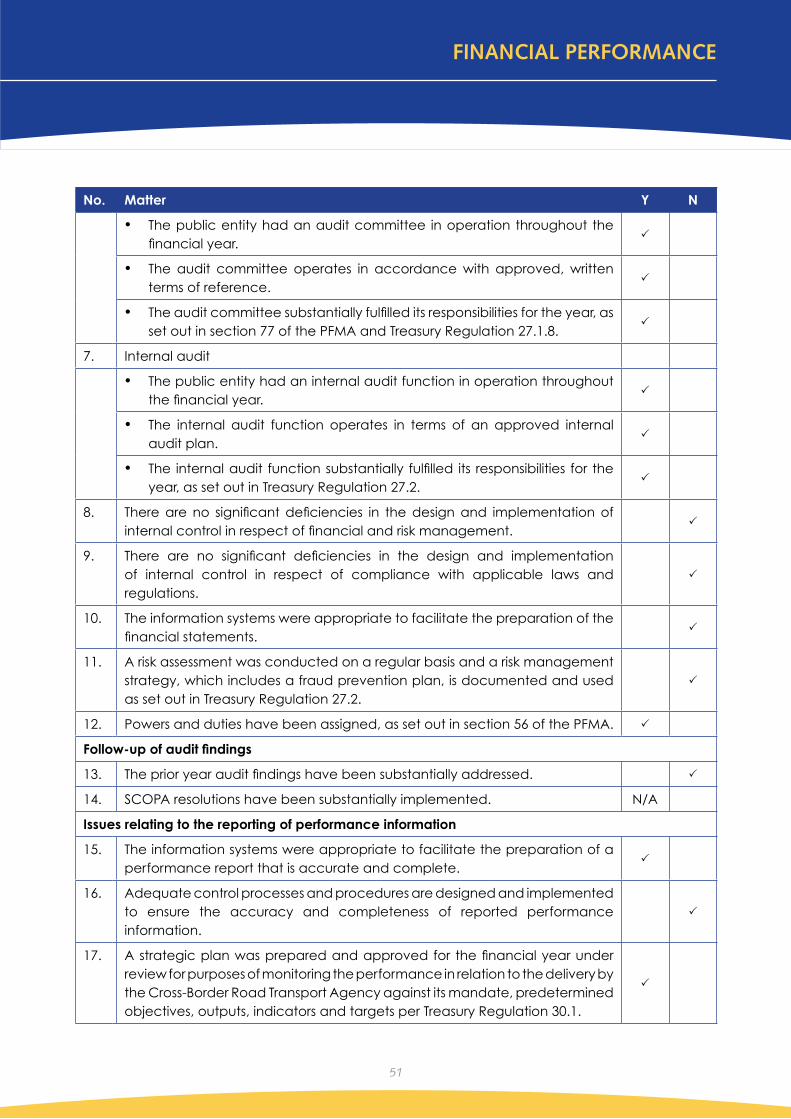
51
No. Matter Y N
The public entity had an audit committee in operation throughout the •financial year.
The audit committee operates in accordance with approved, written •terms of reference.
The audit committee substantially fulfilled its responsibilities for the year, as •set out in section 77 of the PFMA and Treasury Regulation 27.1.8.
7. Internal audit
The public entity had an internal audit function in operation throughout •the financial year.
The internal audit function operates in terms of an approved internal •audit plan.
The internal audit function substantially fulfilled its responsibilities for the •year, as set out in Treasury Regulation 27.2.
8. There are no significant deficiencies in the design and implementation of internal control in respect of financial and risk management.
9. There are no significant deficiencies in the design and implementation of internal control in respect of compliance with applicable laws and regulations.
10. The information systems were appropriate to facilitate the preparation of the financial statements.
11. A risk assessment was conducted on a regular basis and a risk management strategy, which includes a fraud prevention plan, is documented and used as set out in Treasury Regulation 27.2.
12. Powers and duties have been assigned, as set out in section 56 of the PFMA.
Follow-up of audit findings
13. The prior year audit findings have been substantially addressed.
14. SCOPA resolutions have been substantially implemented. N/A
Issues relating to the reporting of performance information
15. The information systems were appropriate to facilitate the preparation of a performance report that is accurate and complete.
16. Adequate control processes and procedures are designed and implemented to ensure the accuracy and completeness of reported performance information.
17. A strategic plan was prepared and approved for the financial year under review for purposes of monitoring the performance in relation to the delivery by the Cross-Border Road Transport Agency against its mandate, predetermined objectives, outputs, indicators and targets per Treasury Regulation 30.1.
FINANCIAL PERFORMANCE

52
No. Matter Y N
18. There is a functioning performance management system and performance bonuses are only paid after proper assessment and approval by those charged with governance.
N/A
The accounting authority has not implemented effective and appropriate governance 24. structures.
REPORT ON OTHER LEGAL AND REGULATORY REQUIREMENTS
Report on performance informationI have reviewed the performance information as set out on pages 29 to 32.25.
The accounting authority’s responsibility for the performance informationThe accounting authority has additional responsibilities as required by section 55(2)(a) of the PFMA 26. to ensure that the annual report and audited financial statements fairly present the performance against predetermined objectives of the public entity.
The Auditor-General’s responsibilityI conducted my engagement in accordance with section 13 of the PAA read with General Notice 27. 616 of 2008, issued in Government Gazette No. 31057 of 15 May 2008.
In terms of the foregoing my engagement included performing procedures of an audit nature to 28. obtain sufficient appropriate evidence about the performance information and related systems, processes and procedures. The procedures selected depend on the auditor’s judgement.
I believe that the evidence I have obtained is sufficient and appropriate to provide a basis for 29. the findings reported below.
Findings on performance information
Non-compliance with regulatory requirements
Lack of reporting on all predetermined objectives in annual reportThe Cross-Border Road Transport Agency has not reported on all the predetermined objectives, 30. as required by Section 55(2)(a) of the PFMA and Treasury Regulation 28.2.2. The objectives not reported on include:
Develop materiality framework for accounting authority• Complete risk assessment•
Lack of effective, efficient and transparent systems and internal controls regarding performance management
The accounting authority did not ensure that the Cross-Border Road Transport Agency has 31. and maintains an effective, efficient and transparent system and internal controls regarding performance management, which describe and represent how the entity’s processes of
FINANCIAL PERFORMANCE

53
performance planning, monitoring, measurement, review and reporting will be conducted, organised and managed, as required in terms of section 51(1)(a)(i) of the PFMA.
Usefulness and reliability of reported performance informationThe following criteria were used to assess the usefulness and reliability of the information on the 32. entity’s performance with respect to the objectives in its strategic plan:
Consistency: Has the entity reported on its performance with regard to its objectives, indicators • and targets in its approved strategic plan? Relevance: Is the performance information as reflected in the indicators and targets clearly • linked to the predetermined objectives and mandate? Is this specific and measurable, and is the time period or deadline for delivery specified?Reliability: Can the reported performance information be traced back to the source data • or documentation and is the reported performance information accurate and complete in relation to the source data or documentation?
The following findings relate to the above criteria:
Inconsistently reported performance informationThe Cross-Border Road Transport Agency has not reported on its performance with regard to all 33. its objectives as per the approved strategic plan. The objectives not reported on include:
Develop materiality framework for accounting authority• Complete risk assessment•
Reported performance information not relevant
The following targets with regard to the Cross-Border Road Transport Agency were not specific 34. in clearly identifying the nature and required level of performance, and were not measurable in identifying the required performance:
Review operation effectiveness.• Develop self evaluate tool to ensure effectiveness of the Board.•
APPRECIATIONThe assistance rendered by the staff of the Cross-Border Road Transport Agency during the 35. audit is sincerely appreciated.
Pretoria22 September 2009
FINANCIAL PERFORMANCE

54
6.3 Financial Statements
6.3.1 Accounting Authority’s Statement of approval for the financial year ended 31 March 2009The financial statements as set out on page 55 to 81 were presented to the audit committee on the 22nd May 2009 and were recommended for approval as such by the committee as appointed Members of the Board in terms of the Cross-Border Road transport Act (No 4. of 1998) which has
assumed the responsibilities of the Members of the Board and are signed on its behalf by:
P G Phalafala Chairman of the Board29 May 2009
FINANCIAL PERFORMANCE
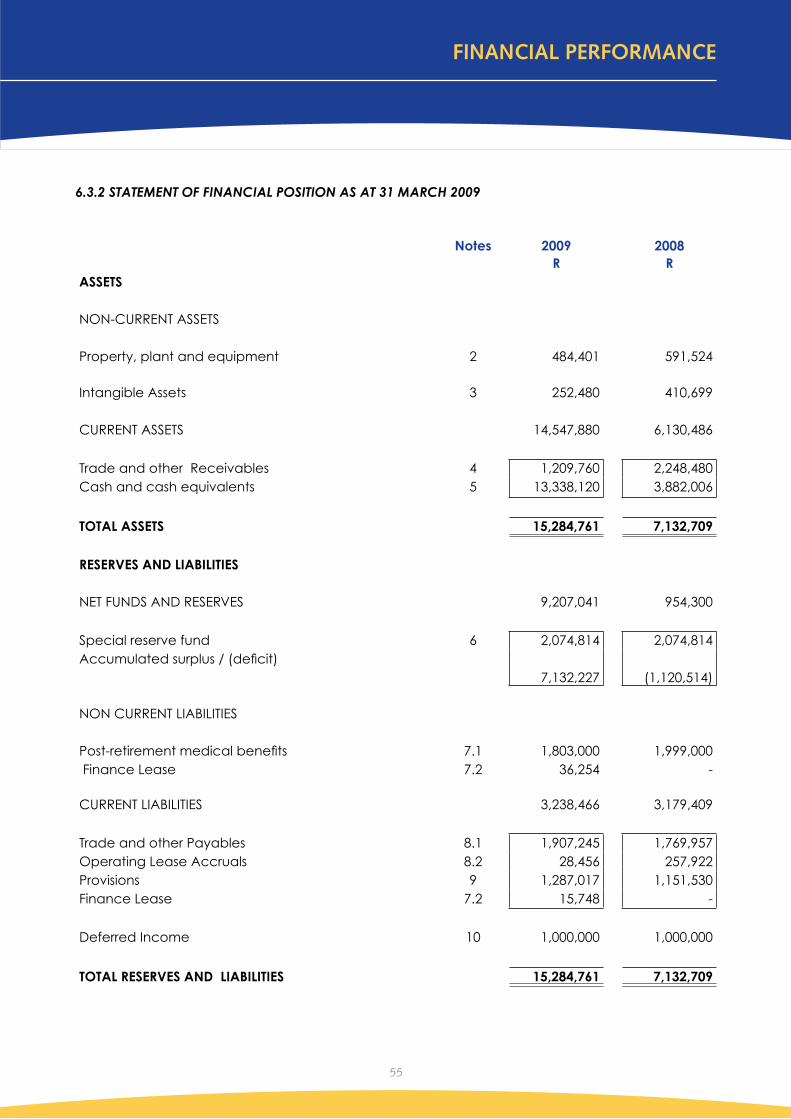
55
6.3.2 STATEMENT OF FINANCIAL POSITION AS AT 31 MARCH 2009
Notes 2009
2008
R RASSETS NON-CURRENT ASSETS Property, plant and equipment 2 484,401 591,524
Intangible Assets 3 252,480 410,699 CURRENT ASSETS 14,547,880 6,130,486 Trade and other Receivables 4 1,209,760 2,248,480 Cash and cash equivalents 5 13,338,120 3,882,006 TOTAL ASSETS 15,284,761 7,132,709 RESERVES AND LIABILITIES NET FUNDS AND RESERVES 9,207,041 954,300 Special reserve fund 6 2,074,814 2,074,814 Accumulated surplus / (deficit)
7,132,227
(1,120,514) NON CURRENT LIABILITIES Post-retirement medical benefits 7.1 1,803,000 1,999,000 Finance Lease 7.2 36,254 -
CURRENT LIABILITIES 3,238,466 3,179,409 Trade and other Payables 8.1 1,907,245 1,769,957Operating Lease Accruals 8.2 28,456 257,922 Provisions 9 1,287,017 1,151,530Finance Lease 7.2 15,748 -
Deferred Income 10 1,000,000 1,000,000
TOTAL RESERVES AND LIABILITIES 15,284,761 7,132,709
FINANCIAL PERFORMANCE
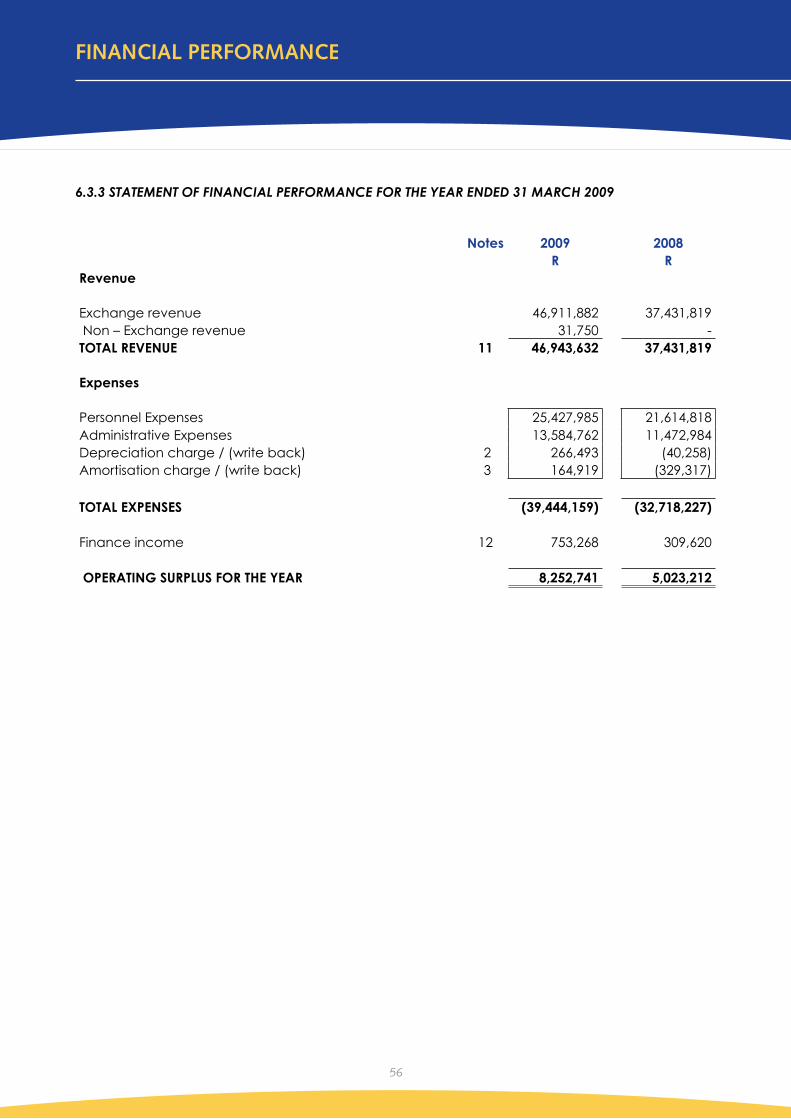
56
6.3.3 STATEMENT OF FINANCIAL PERFORMANCE FOR THE YEAR ENDED 31 MARCH 2009
Notes 2009 2008 R RRevenue Exchange revenue 46,911,882 37,431,819 Non – Exchange revenue 31,750 - TOTAL REVENUE 11 46,943,632 37,431,819 Expenses Personnel Expenses 25,427,985 21,614,818 Administrative Expenses 13,584,762 11,472,984 Depreciation charge / (write back) 2 266,493 (40,258) Amortisation charge / (write back) 3 164,919 (329,317)
TOTAL EXPENSES (39,444,159) (32,718,227) Finance income 12 753,268 309,620
OPERATING SURPLUS FOR THE YEAR 8,252,741 5,023,212
FINANCIAL PERFORMANCE
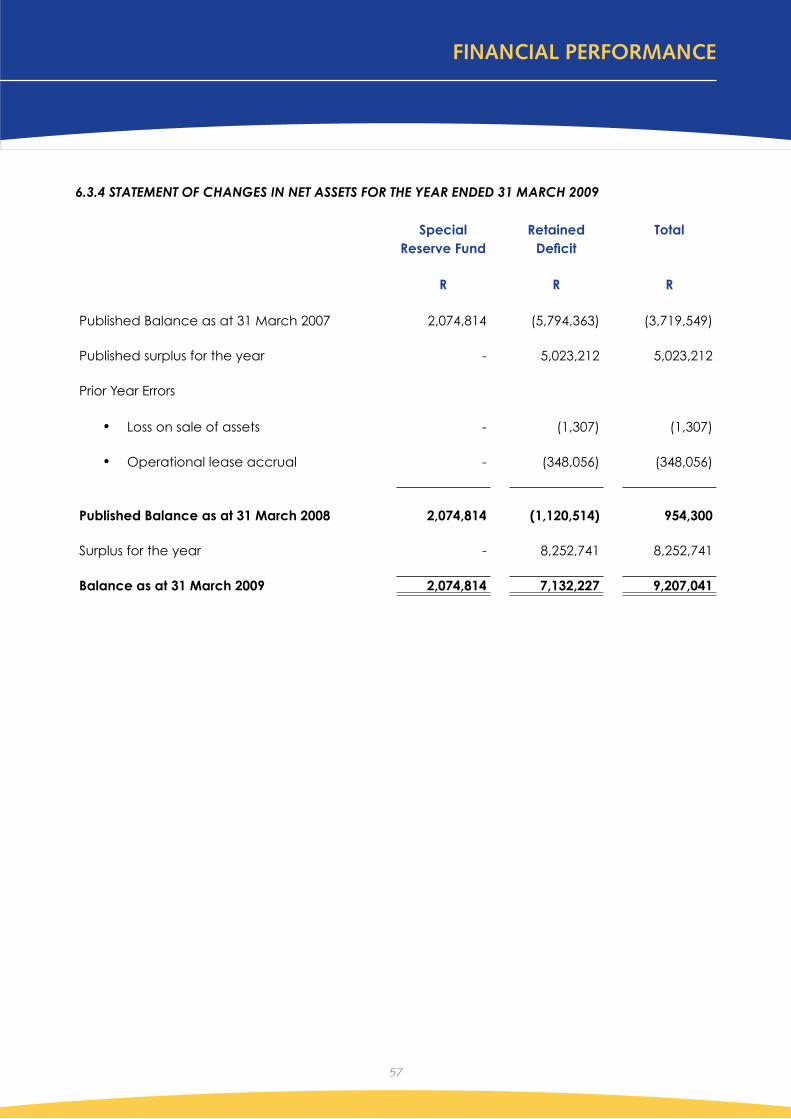
57
6.3.4 STATEMENT OF CHANGES IN NET ASSETS FOR THE YEAR ENDED 31 MARCH 2009
Special Reserve Fund
Retained Deficit
Total
R R R
Published Balance as at 31 March 2007 2,074,814 (5,794,363) (3,719,549) Published surplus for the year - 5,023,212 5,023,212
Prior Year Errors
Loss on sale of assets• -
(1,307)
(1,307)
Operational lease accrual• - (348,056) (348,056)
Published Balance as at 31 March 2008 2,074,814
(1,120,514)
954,300
Surplus for the year - 8,252,741 8,252,741
Balance as at 31 March 2009 2,074,814 7,132,227 9,207,041
FINANCIAL PERFORMANCE

58
6.3.5 CASH FLOW STATEMENT FOR THE YEAR ENDED 31 MARCH 2009
Notes 2009 2008 R RCASH FLOW FROM OPERATING ACTIVITIES Receipts:
Exchange Revenue
47,950,602 36,195,640
Interest received
753,268 309,620
Other receipts31,750
-
48,735,620 36,505,260Payments: Employee costs (25,488,498) (21,952,754) Suppliers (13,675,505) (13,068,330)
Net cash inflow from operating activities 18 9,571,617 1,484,176 CASH FLOW FROM INVESTING ACTIVITIES
-Disposal of property, plant & equipmentAcquisition of intangible assetsAcquisition of property, plant and equipment
232
39,396(6,700)
(198,766)
--
(97,310) Net cash outflow from investment activities (166,070) (97,310) CASH FLOW FROM FINANCING ACTIVITIESPayment of finance lease liabilities (2,390) -Interest Paid (1,435) -Proceeds from borrowing (Finance Lease) 54,392 -
Net cash outflow from financing activities 50,567 -
NET INCREASE IN CASH AND CASH EQUIVALENTS 9,456,114 1,386,866CASH AND CASH EQUIVALENTS AT BEGINNING OF YEAR 3,882,006 2,495,140CASH AND CASH EQUIVALENTS AT END OF YEAR 13,338,120 3,882,006 Call Account and Fixed Deposits 5.2 12,446,526 3,354,154Bank balances 5.1 891,594 527,852 13,338,120 3,882,006
FINANCIAL PERFORMANCE
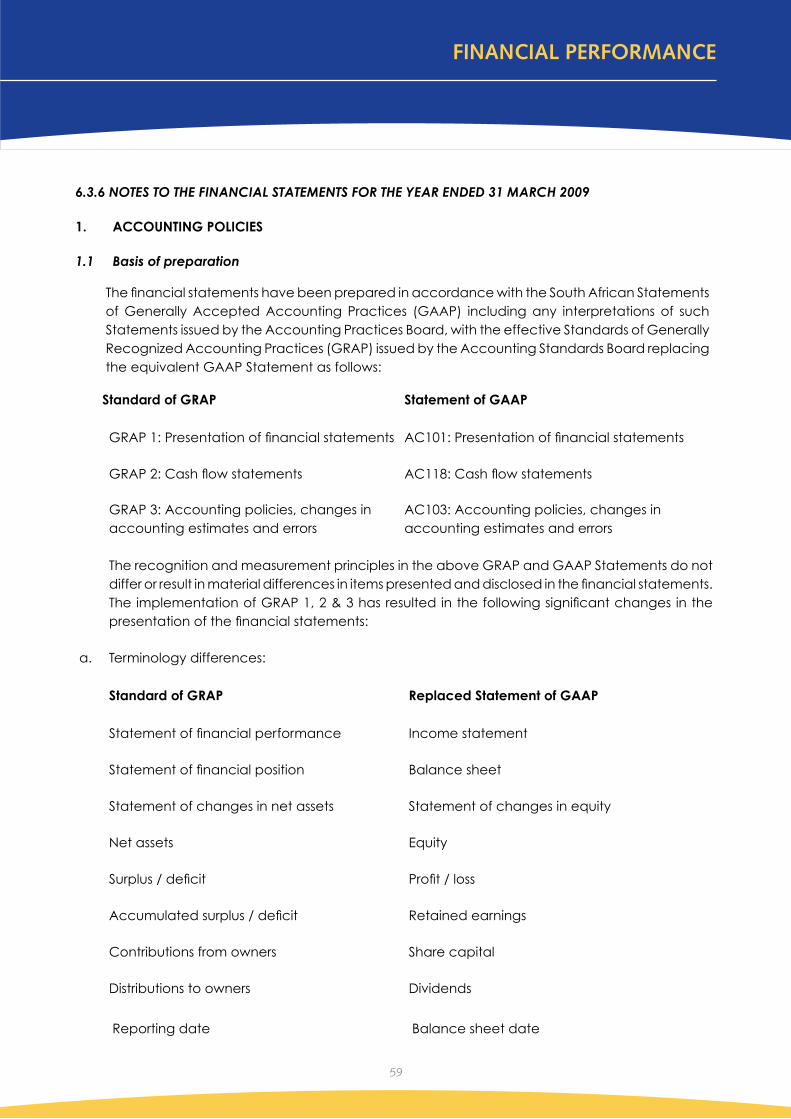
59
6.3.6 NOTES TO THE FINANCIAL STATEMENTS FOR THE YEAR ENDED 31 MARCH 2009
1. ACCOUNTING POLICIES
Basis of preparation1.1
The financial statements have been prepared in accordance with the South African Statements of Generally Accepted Accounting Practices (GAAP) including any interpretations of such Statements issued by the Accounting Practices Board, with the effective Standards of Generally Recognized Accounting Practices (GRAP) issued by the Accounting Standards Board replacing the equivalent GAAP Statement as follows:
Standard of GRAP Statement of GAAP
GRAP 1: Presentation of financial statements AC101: Presentation of financial statements
GRAP 2: Cash flow statements AC118: Cash flow statements
GRAP 3: Accounting policies, changes in accounting estimates and errors
AC103: Accounting policies, changes in accounting estimates and errors
The recognition and measurement principles in the above GRAP and GAAP Statements do not differ or result in material differences in items presented and disclosed in the financial statements. The implementation of GRAP 1, 2 & 3 has resulted in the following significant changes in the presentation of the financial statements:
a. Terminology differences:
Standard of GRAP Replaced Statement of GAAP
Statement of financial performance Income statement
Statement of financial position Balance sheet
Statement of changes in net assets Statement of changes in equity
Net assets Equity
Surplus / deficit Profit / loss
Accumulated surplus / deficit Retained earnings
Contributions from owners Share capital
Distributions to owners Dividends
Reporting date Balance sheet date
FINANCIAL PERFORMANCE

60
NOTES TO THE FINANCIAL STATEMENTS FOR THE YEAR ENDED 31 MARCH 2009
(continued)
b. The cash flow statement can only be prepared in accordance with the direct method
c. Specific information such as:
i) receivables from non - exchange transactions, including taxes and transfers;
(ii) taxes and transfers payable;
iii) trade and other payables from non - exchange transactions;
must be presented separately on the statement of financial position
d. The amount and nature of any restrictions on cash balances is required to be disclosed.
Paragraph 11 - 15 of GRAP 1 has not been implemented due to the fact that the local and the international budget reporting standard is not effective for this financial year. Although the inclusion of budget information would enhance the usefulness of the financial statements, non - disclosure will not affect the objective of financial statements.
The following are the principle accounting policies, which are in all material respects consistent with those applied in previous years, except where otherwise indicated.
1.2 Property, plant and equipmentAll property, plant, and equipment are carried at cost less any accumulated depreciation and any accumulated impairment losses.
Depreciation is calculated on the straight line method to allocate their cost to the residual values over their estimated useful lives as follows:
Computer equipment (9 years) •Furniture and fittings (12 years)•Motor vehicles (5 years)•Office equipment (12 years)•
The gains and losses on the disposal are determined by comparing the proceeds with the carrying amount and are recognised in the statement of financial performance.
The residual values, useful lives of assets and the depreciation method was reviewed at reporting date and any changes were recognised as a change in accounting estimate in the Statement of Financial Performance. The C-BRTA noted that there were assets that had R1 purchase price as at 31 March 2007. These assets were revalued at R42,980, however these assets were not adjusted on the financial statements due to the fact that the C-BRTA could not revalue the whole class of assets as it was not economically feasible.
Repairs and maintenance are expensed in the year it is incurred.
Intangible assets 1.3 Intangible assets acquired are recorded on initial recognition at cost less any accumulated amortisation and any accumulated impairment losses. Following initial recognition, intangible assets are carried at carrying amount. Amortisation is charged on a straight line basis over estimated useful
FINANCIAL PERFORMANCE
61
lives. The estimated useful life and amortisation method are reviewed at the end of each annual reporting period, with the effect of any changes in estimates being accounted for on a prospective basis.
Computer software – (12 years)•
Financial instruments1.4
RecognitionFinancial assets and financial liabilities are recognised on the statement of financial position when the C-BRTA becomes a party to the contractual provisions of the instrument.
Fair value is the amount for which an asset could be exchanged, or a liability settled, between knowledgeable, willing parties in an arm’s length transaction.
Measurement:Financial asset or financial liability is recognised initially at its fair value plus, in the case of a financial asset or financial liability not at fair value through profit or loss, transaction costs that are directly attributable to the acquisition or issue of the financial asset or financial liability.
Financial AssetsFinancial assets are classified into the following specified categories: financial assets ‘at fair value through profit or loss, ‘held-to-maturity’ investments, ‘available-for-sale’ financial assets and ‘trade and receivables’. The classification depends on the nature and purpose of the financial assets and is determined at the time of initial recognition.
Trade and other receivables•Trade receivables are carried at anticipated realisable value. An estimate is made for doubtful receivables based on a review of all outstanding amounts at year-end. Bad debts are written off during the year in which they are identified. Trade receivables are measured at initial recognition at fair value, and are subsequently measured at amortised cost using the effective interest rate method. Appropriate allowances for estimated irrecoverable amounts are recognized in the surplus or deficit when there is objective evidence that the asset is impaired.
The allowance recognized is measured as the difference between the asset’s carrying amount and the present value of estimated cash flows discounted at the effective interest rate computed at initial recognition.
Cash and cash equivalents•Cash and cash equivalents comprise cash on hand and demand deposits, bank overdrafts, and other short-term highly liquid investments that are readily convertible to a known amount of cash and are subject to an insignificant risk of changes in value.
FINANCIAL PERFORMANCE
NOTES TO THE FINANCIAL STATEMENTS FOR THE YEAR ENDED 31 MARCH 2009
62
1.5 Impairment
Non – financial assetsThe carrying amount of the C-BRTA’s assets, other than inventories, is reviewed at each reporting date to determine whether there is any indication of impairment. If such indication exists, the asset’s recoverable amount is estimated.
The recoverable amount of an asset is the greater of its value in use and fair value less costs to sell. For the purpose of impairment testing, the condition of the asset is evaluated to ascertain its value in use. Where the asset is damaged beyond repair, the fair value of the asset is its scrap value.
An impairment loss is recognized if the carrying amount of the asset exceeds its recoverable amount. Impairment losses are recognized in statement of financial performance.
Reversals of impairmentAn impairment loss is reversed if there has been a change in the estimates used to determine the recoverable amount. The increased carrying amount due to reversal should not be more than what the depreciated or amortised historical cost would have been, if the impairment had not been recognized.
Financial assetsFinancial assets, other than those at fair value through profit or loss, are assessed for indicators of impairment at each balance sheet date. Financial assets are impaired where there is objective evidence that, as a result of one or more events that occurred after the initial recognition of the financial asset, the estimated future cash flows of the investment have been impacted.
Financial liabilitiesThe principal financial liabilities of the C-BRTA are accounts payable and bank overdraft. All financial liabilities are measured at amortised cost using the effective interest method.
Trade and other payables• Trade payables are initially measured at fair value, and are subsequently measured at amortised
cost, using the effective interest rate method.
1.6 Government grantsGovernment grants are not recognised until there is reasonable assurance that the C-BRTA will comply with the conditions attaching to them and that the grants will be received.
Government grants whose primary condition is that the C-BRTA should purchase, construct or otherwise acquire non-current assets are recognised as deferred income in the statement of financial position and transferred to statement of financial performance on a systematic and rational basis over the useful lives of the related assets.
Other government grants are recognised as income over the periods necessary to match them with the costs for which they are intended to compensate, on a systematic basis. Government grants that are receivable as compensation for expenses or losses already incurred or for the purpose of giving
FINANCIAL PERFORMANCE
NOTES TO THE FINANCIAL STATEMENTS FOR THE YEAR ENDED 31 MARCH 2009

63
immediate financial support to the C-BRTA with no future related costs are recognised in statement of financial performance in the period in which they become receivable.
1.7 ProvisionsProvisions are recognised when the C-BRTA has a present obligation (legal or constructive) as a result of a past event, it is probable that the C-BRTA will be required to settle the obligation, and a reliable estimate can be made of the amount of the obligation.
The amount recognised as a provision is the best estimate of the consideration required to settle the present obligation at the statement of financial position date, taking into account the risks and uncertainties surrounding the obligation. Where a provision is measured using the cash flows estimated to settle the present obligation, its carrying amount is the present value of those cash flows.
When some or all of the economic benefits required to settle a provision are expected to be recovered from a third party, the receivable is recognised as an asset if it is virtually certain that reimbursement will be received and the amount of the receivable can be measured reliably.
1.8 Employee benefitsThe C-BRTA provides retirement benefits for its full-time employees by way of the defined contribution pension and provident funds. All full-time employees have access to these funds. Contributions to these are paid at a fixed scale. The South African retirement funds of the C-BRTA are governed by Pension Funds Act of South Africa. Substantially all the full-time employees of the C-BRTA are members of either one of the third party’s retirement benefits plan or the Government Employees Pension Fund.
Contributions to defined contribution retirement benefit plans and medical aid benefits are recognised as an expense when employees have rendered service entitling them to the contributions. The assets of these funds are generally held in separate trustee administered funds.
The cost of providing benefits under the defined benefit plans is determined separately for each plan using the projected unit credit actuarial valuation method. Actuarial gains and losses are recognised as income or expense when the net cumulative unrecognised actuarial gains and losses for each individual plan at the end of the previous reporting period exceeded 10% of the higher of the defined benefit obligation and the fair value of plan assets at that date. These gains or losses are recognised over the expected average remaining working lives of the employees participating in the plans.
The past service cost is recognised as an expense on a straight line basis over the average period until the benefits become vested. If the benefits are already vested immediately following the introduction of, or changes to, a pension plan, past service cost is recognized immediately.
The defined benefit asset or liability comprises the present value of the defined benefit obligation less past service cost not yet recognised and less the fair value of plan assets out of which the obligations are to be settled directly. The value of any asset is restricted to the sum of any past service cost not yet recognised and the present value of any economic benefits available in the form of refunds from the plan or reductions in the future contributions to the plan.
FINANCIAL PERFORMANCE
NOTES TO THE FINANCIAL STATEMENTS FOR THE YEAR ENDED 31 MARCH 2009

64
Post – retirement medical benefit planThe C-BRTA provides post-retirement healthcare benefits to their retirees. The entitlement to post-retirement healthcare benefits is based on the employees remaining in service up to retirement age and completing a minimum service period. The expected costs of these benefits are accrued over the period of employment, using an accounting methodology similar to that for defined benefit pension plans.
Independent qualified actuaries carry out annual valuations of these obligations. All actuarial gains and losses are recognized immediately in the income statement. The actuarial valuation method used to value the obligations is the projected unit credit method. Future benefits are projected using specific actuarial assumptions and the liability to in-service members is accrued over their expected working lifetime. These obligations are unfunded.
1.9 Revenue recognitionRevenue is recognised to the extent that it is probable that the economic benefits will flow to the agency and the revenue can be reliably measured. Revenue is measured at the fair value of the consideration received. The following specific recognition criteria must also be met before revenue is recognised:
Rendering of service•Revenue is recognized upon issue of permits and fines and measured based on regulated tarrifs.
Interest income•Interest is accrued on a time proportion basis, taking into account the principal and effective interest over the period to maturity. Interest received comprises of interest on investment of surplus funds and current account with an approved banking institution.
1.10 LeasesFinance leases, which transfer to the C-BRTA substantially all the risks and benefits incidental to ownership of the leased item, are capitalised at the inception of the lease at the fair value of the leased property or, if lower, at the present value of the minimum lease payments.
Lease payments are apportioned between the finance charges and reduction of the lease liability so as to achieve a constant rate of interest on the remaining balance of the liability. Finance charges are reflected in statement of financial performance.
Capitalised leased assets are depreciated over the useful life of the asset as per the accounting policy on property, plant and equipment.
Operating lease payments are recognised as an expense in the operating surplus or deficit on a straight line basis over the lease term.
Leases of assets, under which the risks and benefits of ownership are effectively retained by the lessor, are classified as operating leases.
FINANCIAL PERFORMANCE
NOTES TO THE FINANCIAL STATEMENTS FOR THE YEAR ENDED 31 MARCH 2009

65
1.11 Unauthorized, fruitless, and irregular expendituresFruitless and wasteful expenditure means expenditure which was made in vain and would have been avoided had reasonable care been exercised.
Irregular expenditure means expenditure, other than unauthorised expenditure, incurred in contravention of or that is not in accordance with a requirement of any applicable legislation including a) the Public Finance Management Act b) any provincial legislation providing for procurement procedures in any provincial government.
All irregular and fruitless and wasteful expenditures are charged against surplus in the period in which they occurred.
1.12 New Accounting PronouncementsAt the date of authorization of these financial statements there are Standards and interpretations in issue but not yet effective. These include the following: Standards and interpretations that are applicable to the agency and may have an impact on future financial statements:
Effective date, commencing on or after
GRAP 9 Revenue from Exchange Transactions 01 April 09
GRAP 12 Inventories 01 April 09
GRAP 13 Leases 01 April 09
GRAP 17 Property, Plant and Equipment 01 April 09
GRAP 100 Non-current Assets held for Sale and Discontinued Operations
01 April 09
GRAP 102 Intangible Assets 01 April 09
The C-BRTA shall apply Standards of GRAP for annual financial statements covering periods beginning on or after a date to be determined by the Minister of Finance in a regulation to be published in accordance with section 91(1) (b) of the PFMA. This date has not yet been published as at the date of this set of financial statements.
FINANCIAL PERFORMANCE
NOTES TO THE FINANCIAL STATEMENTS FOR THE YEAR ENDED 31 MARCH 2009

66
NOTES TO THE FINANCIAL STATEMENTS FOR THE YEAR ENDED 31 MARCH 2009
2 PROPERTY, PLANT AND EQUIPMENT
Computer equipment
Furniture and fittings
Motor vehicles
Office equipment
Total
R R R R R
2009
Opening net book value 318,211 89,757 - 183,556 591,524 Additions 121,064 47,750 - 29,952 198,766
Disposal (16,117) (2,865) - (20,414) (39,396)
Depreciation (charge) (141,627) (40,103) - (84,763) (266,493)
- - - -
Closing net book value 281,531 94,539 - 108,331 484,401
Cost/valuation 714,997 367,678 335,731 1,418,406
Accumulated depreciation (433,466) (273,139) (227,400) (934,005)
Net book value 281,531 94,539 - 108,331 484,401
2008
Opening net book value 164,344 52,027 - 237,586 453,957
Additions 80,702 - - 16,608 97,310
Depreciation (charge) / write back
73,165
37,730
-
(70,638)
40,257
Closing net book value 318,211 89,757 - 183,556 591,524
Cost/valuation 1,408,101 336,949 24,750 585,984 2,355,784
Accumulated depreciation (1,089,890) (247,192) (24,750) (402,428) (1,764,260)
Net book value 318,211 89,757 - 183,556 591,524
The carrying value of computer equipment held under finance leases at 31 March 2009 was R53,385 (2008:R000). Leased assets are pledged as security for the related finance lease liabilities.
FINANCIAL PERFORMANCE

67
NOTES TO THE FI NANCIAL STATEMENTS FOR THE YEAR ENDED 31 MARCH 2009
3 INTANGIBLE ASSETS
Computer Software 2009 2008
Opening net book value 410,699 82,979
Addition 6,700 -
(Amortization charge)/write back
(164,919)
327,720
Amortized cost 252,480 410,699
Cost/valuation 1,340,477 1,333,776
Accumulated Amortisation (1,087,997) (923,077)
Amortised cost 252,480 410,699
CCTV System with the cost of R43, 377 was reallocated from Intangible assets to Property, Plant and Equipment.
4 TRADE AND OTHER RECEIVABLES
Trade receivables 1,170,195 2,226,165 Less Impairment (249,840) (481,990)
920,355 1,744,175 Other receivables 289,405 504,305 1,209,760 2,248,480
5 CASH & CASH EQUIVALENTS
5.1 Cash in Bank DESCRIPTIONGeneral Account 604,241 463,827Collection Account 286,484 63,070Petty cash 870 955 891,595 527,852
5.2 Investments
DESCRIPTIONCall Account Fixed Deposit - 90 days
7,668, 3054,778, 221
2,276,9351,077,219
12,446,526 3,354,154
FINANCIAL PERFORMANCE

68
NOTES TO THE FINANCIAL STATEMENTS FOR THE YEAR ENDED 31 MARCH 2009
6 Special Reserve Fund 2009 2008Comprising funds and fixed assets transferred from the National Department of Transport in terms of an agreement to subsidise the C-BRTA. Included in this figure is an amount of R2,074,814 for fixed assets transferred from the National Department of Transport
2,074,814 2,074,814 2,074,814 2,074,814
7 Non – Current Liabilities 7.1 Post retirement medical benefits:
The obligation of the C-BRTA to pay medical aid contributions after retirement is no longer part of the conditions of employment for the new employees. A number of pensioners and current employees, however, remain entitled to this benefit. The entitlement to this benefit for current employees is dependent upon the employees remaining in service until retirement age and completing a minimum service period. The C-BRTA provides for post retirement medical benefits on the accrual basis determined each year by way of valuation. The key assumptions and valuation method are described below. The management believes that adequate provision has been made for future liabilities.
Key assumption and valuation method:
The actuarial valuation method used to value the liabilities is the projected unit credit method prescribed by IAS 19. Future benefits valued are projected using specific actuarial assumptions and the liability for in-service members is accrued over the expected working lifetime. Any plan assets are assets valued at current market value as required by IAS 19.
The present value of this commitment is valued by an independent actuary, based on an average contribution of R1 014 per month.
The provision at 31 March 2009 is based on the actuarial valuation carried out on 15 May 2009 by ABSA.
2009 2008 R R
Post-employment benefit liabilityLiabilities in respect of :Members in active employment 518,000 454,000Current continuation member 1,285,000 1,545,000Present value of obligation 1,803,000 1,999,000
FINANCIAL PERFORMANCE
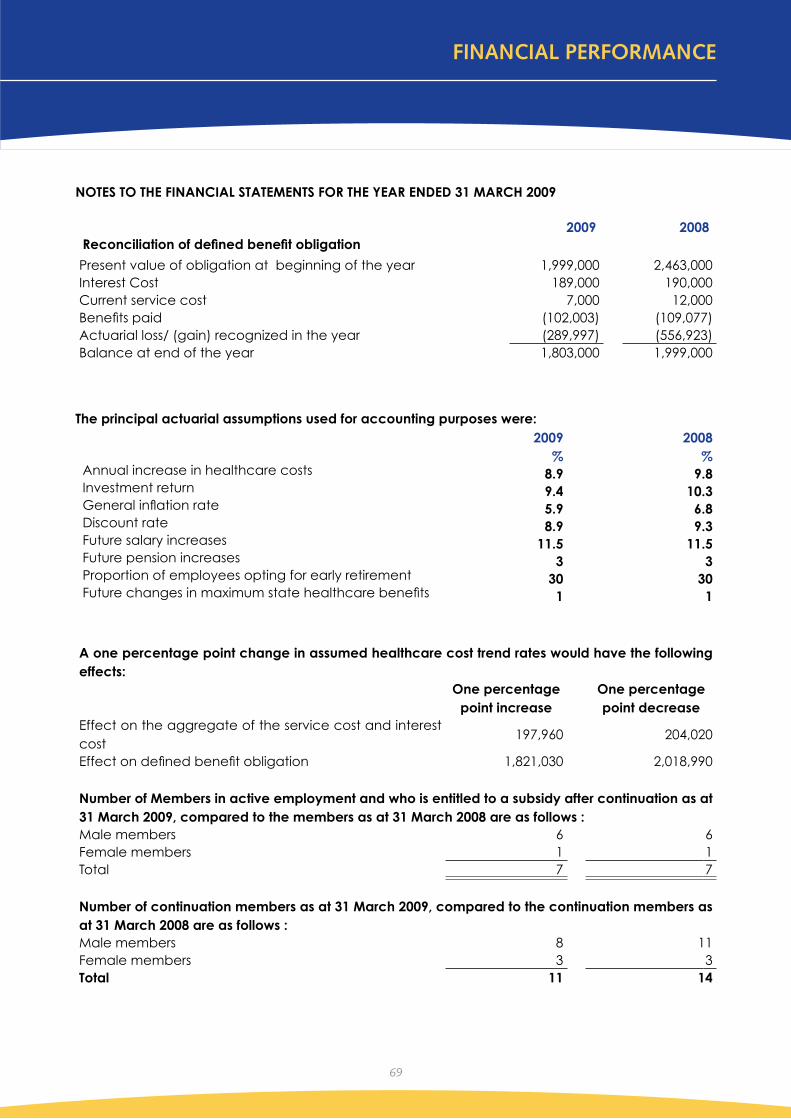
69
2009 2008Reconciliation of defined benefit obligation
Present value of obligation at beginning of the year 1,999,000 2,463,000Interest Cost 189,000 190,000Current service cost 7,000 12,000Benefits paid (102,003) (109,077)Actuarial loss/ (gain) recognized in the year (289,997) (556,923)Balance at end of the year 1,803,000 1,999,000
The principal actuarial assumptions used for accounting purposes were:2009
%2008
%Annual increase in healthcare costs 8.9 9.8Investment return 9.4 10.3General inflation rate 5.9 6.8Discount rate 8.9 9.3Future salary increases 11.5 11.5Future pension increases 3 3Proportion of employees opting for early retirement 30 30Future changes in maximum state healthcare benefits 1 1
A one percentage point change in assumed healthcare cost trend rates would have the following effects: One percentage
point increaseOne percentage point decrease
Effect on the aggregate of the service cost and interest cost
197,960 204,020
Effect on defined benefit obligation 1,821,030 2,018,990
Number of Members in active employment and who is entitled to a subsidy after continuation as at 31 March 2009, compared to the members as at 31 March 2008 are as follows :Male members 6 6Female members 1 1Total 7 7
Number of continuation members as at 31 March 2009, compared to the continuation members as at 31 March 2008 are as follows :Male members 8 11Female members 3 3Total 11 14
FINANCIAL PERFORMANCE
NOTES TO THE FINANCIAL STATEMENTS FOR THE YEAR ENDED 31 MARCH 2009

70
2009 2008
7.2 Finance Lease Liabilities
Current EIR %
Obligations under finance leases and hire purchase contracts (Note 14.2) 16% 15,748 -Non – CurrentObligations under finance leases and hire purchase contracts (Note 14.2) 16% 36,254 -
52,002 -
8 8.1 TRADE AND OTHER PAYABLES Trade payables 550,700 852,962Income received in advance 1,041,482 831,466CCMA and Labour Cases 213,333 -Compensation commissioner (WCA) 101,730 85,529 1,907,245 1,769,957
8.2 Operating lease accrual Opening Balance at the beginning of the year 257,922 348,056 Utilization of Provision for the year (229,466) (90,134) Closing balance at year end 28,456 257,922
9 PROVISIONS13th Cheque provisionOpening balance at the beginning of the year 399,770 394,934Unutilised amount reversed during the year (399,770) (394,934)Provision made during the year 446,664 399,770Closing balance 446,664 399,770
Leave ProvisionOpening balance at the beginning of the year 751,760 630,532Unutilised amount reversed during the year (751,760) (630,532)Provision made during the year 840,353 751,760Closing balance 840,353 751,760
Total Provision 1,287,017 1,151,530
The leave pay and 13th cheque provision relates to the C-BRTA’s estimated liabilities arising as a result of services rendered by employees.
NOTES TO THE FINANCIAL STATEMENTS FOR THE YEAR ENDED 31 MARCH 2009
FINANCIAL PERFORMANCE

71
10 DEFERRED INCOME2009 2008
Opening balance at the beginning of the year 1,000,000 1,000,000Closing balance at year end 1,000,000 1,000,000
The above government grant is recognized as deferred income on the basis that it is to be applied in the upgrade of ablution facilities at Beit Bridge and other relevant border posts in time for the 2010 World Cup. The said construction has not commenced as yet.
11 REVENUE
Revenue comprises: Exchange revenue
Fees, fines, penalties and licenses 46,073,337 36,698,104 Other operating revenue 838,545 733,715
46,911,882 37,431,819 Non – Exchange revenue 31,750 -TOTAL REVENUE 46,943,632 37,431,819
12 FINANCE INCOME Interest received 752,268 309,620
753,268 309,620
NOTES TO THE FINANCIAL STATEMENTS FOR THE YEAR ENDED 31 MARCH 2009
FINANCIAL PERFORMANCE

72
2009 2008OPERATING SURPLUS FOR THE YEAR13.
Operating surplus is stated after charging: Personnel remuneration 25,427,985 21,614,818 Auditor’s remuneration 1,153,626 1,195,906 Operating lease expenses 2,122,120 1,849,953
Bad debt
41,401 496,495
Consulting fees 844,710 1,520,664 Legal feesAmortization charge / (write back)
199,987164,919
17,863(329,317)
Depreciation charge / (write back) 266,493 (40,258) Computer equipment 141,627 (73,166)Furniture and fittings 40,103 (37,730) Office equipment 84,763 70,638 Loss on disposal of non – current assets 39,396 -Included in other expenses, areDefined benefit plan expense 8,006 245,846
Current service cost 7,000 12,000Interest Cost 189,000 190,000Actuarial gain recognized in the year (289,997) (556,923)Benefits Paid (included in total employee costs) 102,003 109,077
14. COMMITMENTS AND CONTINGENCIES
14.1 Operating lease commitments
The future aggregate minimum lease payments under non-cancelable operating leases.
Not later than one year 1,770,793 1,632,068 After one year but not later than five years - 275,610 1,770,793 1,907,678
The C-BRTA extended their operating lease agreement with Belsim Pty Ltd which was for a period of 5 years commencing on the 1st June 2004 and terminating 31 May 2009. The lease is for rental of unit H, I, J, K Parkfield court, ERF 723, Hatfield Pretoria. The rental/lease shall escalate annually on the 1 June of each year with 8.5% or PPI which ever is the greater percentage. The rental escalations shall also be compoundable annually on 1 June of each year.The C-BRTA has further extended the lease agreement from 1 June 2009 to 31 January 2010.
FINANCIAL PERFORMANCE
NOTES TO THE FINANCIAL STATEMENTS FOR THE YEAR ENDED 31 MARCH 2009

73
NOTES TO THE FINANCIAL STATEMENTS FOR THE YEAR ENDED 31 MARCH 2009
14.2 Finance lease commitments
The C-BRTA has financed lease contracts for computer equipment. These leases have no terms of renewal, purchase options and escalation clauses, however all computer equipment will remain property of the C-BRTA subject to 36 months airtime contract. Future minimum lease payments under finance leases are presented with the present value of the net minimum lease payments.
Present Value Minimum Payments
Within one year 15,748 22,947
After one year but not more than five years 36,254 42,044
Total minimum lease payments 52,002 64,991
Less amounts representing finance charges - (12,989)
Present value of minimum lease payments 52,002 52,002
14.3 Termination of Employment of contract
The C-BRTA has concluded a termination of contract of employment for Mr L M Nsibande of which the C-BRTA was liable to pay 12 months salary amounting to R850 000 plus 10% as per salary increase.
14.4 Contingent Liabilities
The C-BRTA has contingent liabilities in respect of labour relations claims arising in the ordinary course of the business as follows:
Parties Lodged in Nature Claim
Gabriel Mpato High Court Sued agency for loss of income
R4.3m potential loss of income
CR Phiri Labour Court Agency took CCMA on appeal after unfair award
12 (twelve) months compensation equal to R127 050
P Thobakgale CCMA The applicant claims the agency retained funds from his consultant
12 (twelve) months compensation equal to R176 874
Based on the opinion of the in-house counsel, it is not anticipated that any material liability will arise.
FINANCIAL PERFORMANCE

74
15. TAXATIONThe C-BRTA is exempt from normal income tax in terms of section 10(1) (Ca) of the Income Tax Act of 1962.
16. EMPLOYEE BENEFITSThe provident fund (Alexander Forbes Provident Fund) is a defined contribution plan and is registered in terms of the Pension Fund Act, Act Nr 24 of 1956, as amended. The pension fund (Government Employees Pension Fund) is a defined benefit plan. Employers’ contributions to these funds for the financial year amounted to R2, 365,165 and are included in personnel remuneration.
17. RELATED PARTIESIn 2007 a grant of R1 million was received from the Department of Transport for 2010 World Cup projects. Members’ emoluments are disclosed in note 10 to the Statement of financial performance.
18. RECONCILIATION OF NET CASH FROM OPERATING ACTIVITIES
2009 2008 R ROperating surplus for the year 8,252,741 5,023,212Non – cash movements / disclosable item Depreciation charge / (write back) Amortisation charge / (write back) Interest on Finance Lease Liabilities
266,493164,919
1,435
(40,258) (329,317)
-
8,685,588 4,653,637
Decrease/(Increase) in receivables 1,038,720 (1,236,180)(Decrease)/Increase in payables (152,691) (1,933,281)Net cash flow from operating activities 9,571,617 1,484,176
FINANCIAL PERFORMANCE
NOTES TO THE FINANCIAL STATEMENTS FOR THE YEAR ENDED 31 MARCH 2009

75
19. FINANCIAL INSTRUMENTSThe exposure of the C-BRTA to interest rate risk and the effective interest rates on financial instruments at Statement of Financial Position date are as follows:
FLOATING RATENON
INTEREST BEARING
AMOUNT
EFFECTIVE INTEREST RATE (%) AMOUNT TOTAL
Year ended 31 March 2009ASSETSCash in fixed deposit and call account 12,446,526 7.5% 12,446,526Petty Cash 0% 870 870Cash in bank accounts 890,724 3.20% 890,724Trade receivables 920,355 0% 920,355Other receivables 289,405 0% 289,405TOTAL FINANCIAL ASSETS 14,547,010 7.5% 870 14,547,880
LIABILITIESTrade and other payables (1,592,182) 0% 0 (1,592,182)Finance Lease (52,002) 16% 0 (52,002)TOTAL FINANCIAL LIABILITIES (1,644,184) 16% (1,644,184)
TOTAL FINANCIAL ASSETS 14,547,010 7.5% 870 14,547,880TOTAL FINANCIAL LIABILITIES (1,644,184) 16% (1,644,184)
12,902,826 7.5% 870 12,903,696
Credit RiskFinancial assets which potentially subject the C-BRTA to the risk of non-performance by counter-parties consist mainly of cash and cash equivalents and accounts receivable. However the C-BRTA limits its counter-part exposure by only dealing with magistrates who acts as collection agency for the C-BRTA. Credit risk with respect to permit fees, fines and penalties is limited due to the nature of the income received. No events occurred during the financial year that may have an impact on the accounts receivable that has not been adequately provided for.
Liquidity riskThe C-BRTA manages liquidity risk through proper management of working capital, capital expenditure and actual versus forecasted cash flows and its cash management policy.
Interest riskExposure to interest rate risk on financial liabilities is monitored on a continuous and proactive basis. The debt financing activities are considered on a case-by-case and project-by-project basis, taking the specific, cash available and overall risk profile into consideration. For further details on finance lease liability refer note 14.2 and note 19.
FINANCIAL PERFORMANCE
NOTES TO THE FINANCIAL STATEMENTS FOR THE YEAR ENDED 31 MARCH 2009

76
NOTES TO THE FINANCIAL STATEMENTS FOR THE YEAR ENDED 31 MARCH 2009
20. DIRECTORS’ EMOLUMENTS
2009
Name of DirectorsTotal Fee/
SalaryTravel and
Accom.Total
P.G Phalafala* 109,680 36,391 146,071
L Twalo** 82,259 12,720 94,979
M du Preez** 82,259 8,572 90,831
N Ally** 82,259 1,112 83,371
H. Dikgale** 82,259 19,023 101,282
B Horne’** 82,259 15,256 97,515
B Mpondo** 82,259 - 82,259
M Patel*** 12,250 3,950 16,200
S Rachhoojee*** 15,600 2,640 18,240
TOTAL 631,084 99,664 730,748
FINANCIAL PERFORMANCE

77
NOTES TO THE FINANCIAL STATEMENTS FOR THE YEAR ENDED 31 MARCH 2009
2008
Name of Directors Total fee / Salary Travel and Accom Expenses Allowances Cellphone
Contract Work
Total
PG Phalafala* 109,680 16,772 126,452
L Twalo** 82,259 16,584 98,843
M du Preez** 82,259 82,259
N Ally** 82,259 36,496 118,755
H Dikgale** 82,259 10,181 92,440
B Horne’** 82,259 9,483 91,742
B Mpondo** 82,259 3,362 233,700 319,321
M Patel*** 17,286 540 17,826
S Rachhoojee*** 7,914 7,914
TOTAL 628,434 93,418 233,700 955,552
* Chairperson – C-BRTA Board** Directors (Non – Executive)*** Independent (Non – Executive)
FINANCIAL PERFORMANCE

78
EXEE
CU
TIV
E M
AN
AG
EMEN
T’S
EMO
LUM
ENTS
2009
Na
me
Title
Basi
c s
ala
ryM
ed
ica
l C
ont
ribut
ions
Bonu
ses
and
p
erfo
rma
nce
p
aym
ent
s
Tra
vel
Allo
wa
nce
Pens
ion
Pro
vid
ent
C
ont
ribut
ions
Oth
er
De
duc
tions
P G
erin
ge
r G
en
era
l Ma
na
ge
r 38
5,44
565
,988
39,9
791,
200
40,7
84
M M
vula
ne
Ch
ief F
ina
nc
ial
Offi
ce
r38
7,18
7-
-11
,400
--
G M
ab
uza
Ch
ief O
pe
ratio
ns
Offi
ce
r23
1,91
57,
016
--
--
L N
siba
nd
eC
hie
f Exe
cu
tive
O
ffic
er
629,
432
32,0
0246
,865
--
(60,
655)
R S
tuu
rma
nLe
ga
l, R
isk &
C
om
plia
nc
e18
9,55
512
,050
67,1
28-
-
S Kg
om
oC
orp
ora
te A
ffa
irs11
3,61
61,
977
--
-
D L
oe
do
lffSt
rate
gy,
Ad
viso
ry &
Tr
an
sfo
rma
tion
67,8
78-
--
4,42
3
-
TO
TAL
2,0
05,0
2811
9,03
386
,844
79,
728
45,
207
(60,
655)
FINANCIAL PERFORMANCE

79
Na
me
Ti
tle
Exp
ens
es,
A
ctin
g
Allo
wa
nce
s c
ell
pho
ne
Lea
ve P
ay
/ (U
npa
id
Lea
ve)
Re-i
mb
ursi
ve
tra
vel r
ela
ted
a
mo
unts
Tota
l e
arn
ing
sRe
ma
rks
P G
erin
ge
r G
en
era
l Ma
na
ge
r 4,
200
-72
453
8,32
0
M M
vula
ne
Ch
ief F
ina
nc
ial
Offi
ce
r4,
000
(15,
344)
1,29
538
8,53
8Jo
ine
d m
id J
uly
20
08
G M
ab
uza
Ch
ief O
pe
ratio
ns
Offi
ce
r-
(11,
216)
-22
7,71
5R
esig
ne
d
July
20
08
L N
siba
nd
eC
hie
f Exe
cu
tive
O
ffic
er
33,3
73-
-68
1,01
7Jo
ine
d
in
Ap
ril
2008
R S
tuu
rma
nLe
ga
l, R
isk &
C
om
plia
nc
e3,
250
--
271,
983
Join
ed
in
S
ep
te
mb
er
2008
S Kg
om
oC
orp
ora
te A
ffa
irs11
,368
817
127,
778
Join
ed
in
Ja
nu
ary
200
9
D L
oe
do
lffSt
rate
gy,
Ad
viso
ry &
Tr
an
sfo
rma
tion
--
72,3
01Jo
ine
d
in
Feb
rua
ry 2
009
TO
TAL
56
,191
(26,
560)
2,
836
2,30
7,65
2
FINANCIAL PERFORMANCE

80
2008
Na
me
Ti
tleBa
sic
sa
lary
Me
dic
al
Co
ntrib
utio
ns
Bonu
ses
and
p
erfo
rma
nce
p
aym
ent
s
Tra
vel
Allo
wa
nce
Pens
ion
Pro
vid
ent
C
ont
ribut
ions
P G
erin
ge
rG
en
era
l Ma
na
ge
r35
9,57
642
,912
37,0
171,
200
42,7
33
M.M
ota
un
gC
hie
f Fin
an
cia
l Offi
ce
r43
4,31
3-
33,0
2487
,168
-
G M
ab
uza
Ch
ief O
pe
ratio
ns
Offi
ce
r55
4,07
214
,928
-88
,000
-
TOTA
L1,
347,
961
57,
840
70,0
41
1
76,3
68
4
2,73
3
Na
me
Ti
tleEx
pe
nse
s A
llow
anc
es
ce
ll p
hone
Lea
ve P
ay
Re-i
mb
ursi
ve
tra
vel r
ela
ted
a
mo
unts
To
tal e
arn
ing
s Re
ma
rks
PJ G
erin
ge
r G
en
era
l Ma
na
ge
r 4,
200
-1,
856
485,
644
M. M
ota
un
gC
hie
f Fin
an
cia
l Offi
ce
r-
35,2
96-
589,
801
Re
sign
ed
in
Ja
nu
ary
200
7
G M
ab
uza
Ch
ief O
pe
ratio
ns
Offi
ce
r-
-
13,3
48
670,
348
Join
ed
th
e
ag
en
cy
in
Ma
rch
200
7
TO
TAL
4
,200
35
,296
15
,204
1,74
9,64
3
FINANCIAL PERFORMANCE
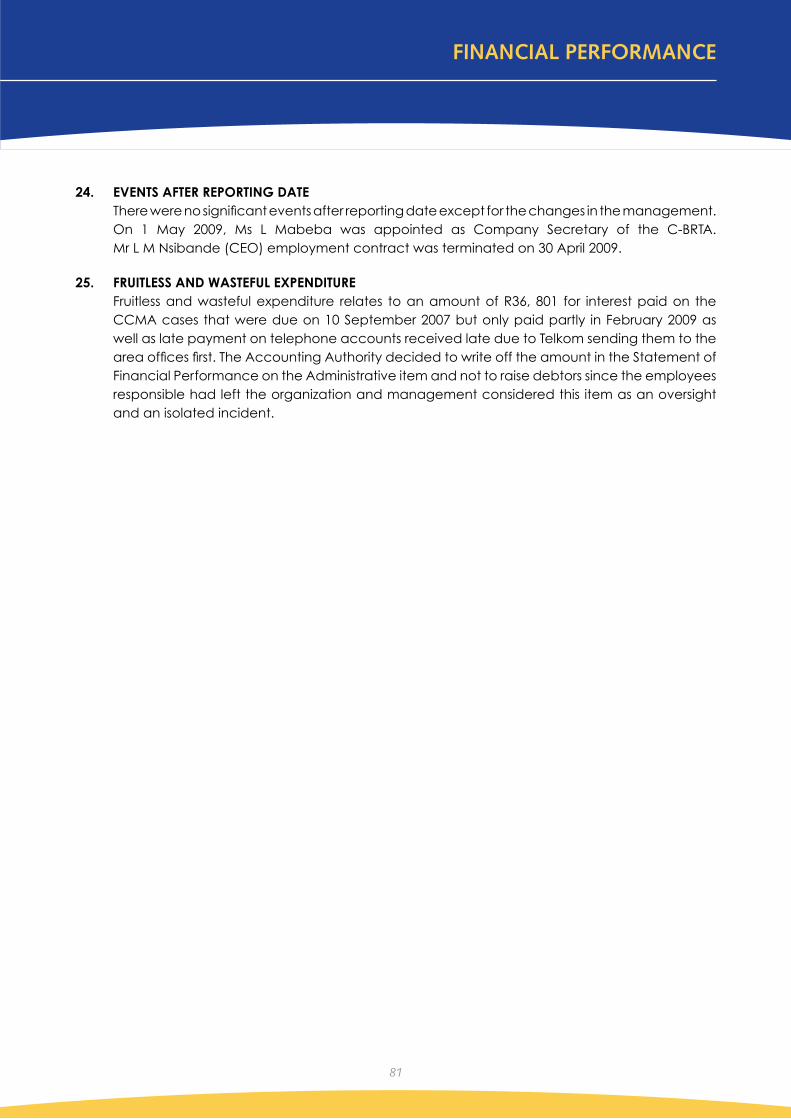
81
24. EVENTS AFTER REPORTING DATEThere were no significant events after reporting date except for the changes in the management. On 1 May 2009, Ms L Mabeba was appointed as Company Secretary of the C-BRTA. Mr L M Nsibande (CEO) employment contract was terminated on 30 April 2009.
25. FRUITLESS AND WASTEFUL EXPENDITURE Fruitless and wasteful expenditure relates to an amount of R36, 801 for interest paid on the
CCMA cases that were due on 10 September 2007 but only paid partly in February 2009 as well as late payment on telephone accounts received late due to Telkom sending them to the area offices first. The Accounting Authority decided to write off the amount in the Statement of Financial Performance on the Administrative item and not to raise debtors since the employees responsible had left the organization and management considered this item as an oversight and an isolated incident.
FINANCIAL PERFORMANCE

82
NOTES

83
NOTES

84
NOTES