1 the future is friendly 2005 annual and special meeting edmonton – may 4, 2005
TRANSCRIPT

1
the future is friendly
2005annual and special meeting
Edmonton – May 4, 2005

2
financial reviewRobert McFarlaneEVP & Chief Financial Officer
3 all dollars in C$ unless otherwise specified3
These CEO & CFO presentations and answers to shareholder questions contain forward-looking statements about expected future events including competition, labour relations developments and financial and operating results that are subject to risks and uncertainties. TELUS’ actual results, performance, or achievement could differ materially from those expressed or implied by such statements. For additional information on potential risk factors, see TELUS’ 2004 Annual Report, and other filings with securities commissions in Canada and the United States.
TELUS disclaims any intention or obligation to update or revise any forward-looking statements, whether as a result of new information, future events or otherwise.
forward-looking statements
4
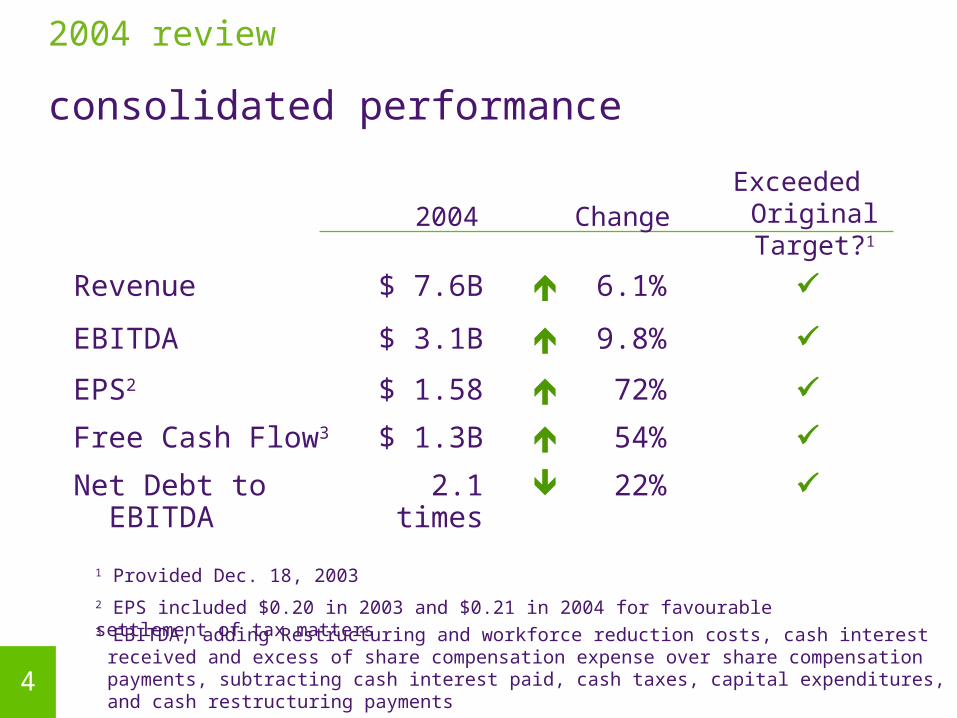
Exceeded Original Target?1
Revenue $ 7.6B 6.1%
EBITDA $ 3.1B 9.8%
EPS2 $ 1.58 72%
Free Cash Flow3 $ 1.3B 54%
Net Debt to EBITDA 2.1 times 22%
1 Provided Dec. 18, 2003
3 EBITDA, adding Restructuring and workforce reduction costs, cash interest received and excess of share compensation expense over share compensation payments, subtracting cash interest paid, cash taxes, capital expenditures, and cash restructuring payments
2 EPS included $0.20 in 2003 and $0.21 in 2004 for favourable settlement of tax matters
Change2004
consolidated performance
2004 review

5
2005 – first quarter review

6
2005 – first quarter review
Record first quarter results
1 Including restructuring and workforce reduction costs of $16M in Q1-04 and $9M in Q1-05
TELUS consolidated
Revenue $ 1.80B $ 1.98B 9.5%
EBITDA1 $ 721M $ 856M 19%
Net Income2 $ 101M $ 242M 139%
EPS 2 $ 0.28 $ 0.67 139%
EPS (excl. tax settlements) $ 0.24 $ 0.52 117%
Dividend per share $ 0.15 $ 0.20 33%
Q1-05Q1-04 Change
2 Including favourable impacts for tax settlements on net income of $14M or $0.04 per share in Q1-04, and $54M or $0.15 per share in Q1-05

7 Strong margin expansion across both segments
1 Earnings before interest, taxes, depreciation and amortization divided by total revenue
4042 43
40
2005
2004
39
45
Q1 Q1 Q1 Q1 Q1 Q1 Mobility Communications Consolidated
2005 – first quarter review
EBITDA margin1 (%)

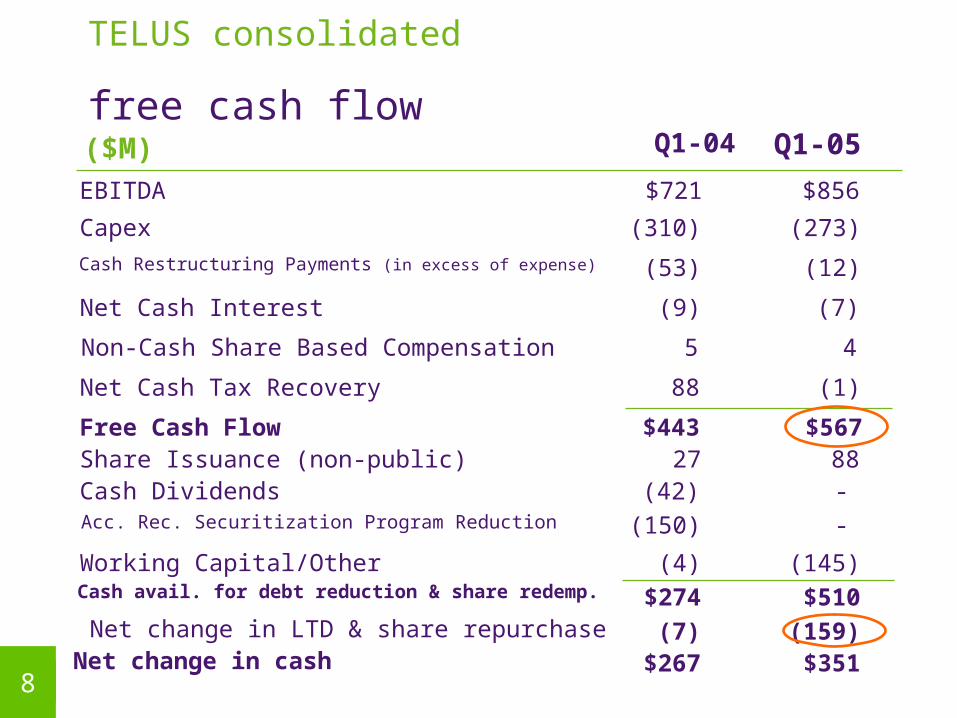
8 Significant 28% increase in free cash flow
$ 443M
2005
2004
$ 567M
Q1Q1
free cash flow - consolidated
2005 – first quarter review

9 Strong gains in wireline profitability and cash flow
43%$ 305M$ 214MCash Flow (EBITDA less capex)
4.5 pts17.2%21.7%Capital Intensity2
9.6%$ 519M$ 474MEBITDA1
4.4%$ 1.22B$ 1.17BExternal Revenue
ChangeQ1-05Q1-04
1 Earnings before interest, taxes, depreciation and amortization
Communications segment
2005 – first quarter review
2 Capital expenditures divided by total revenue
10
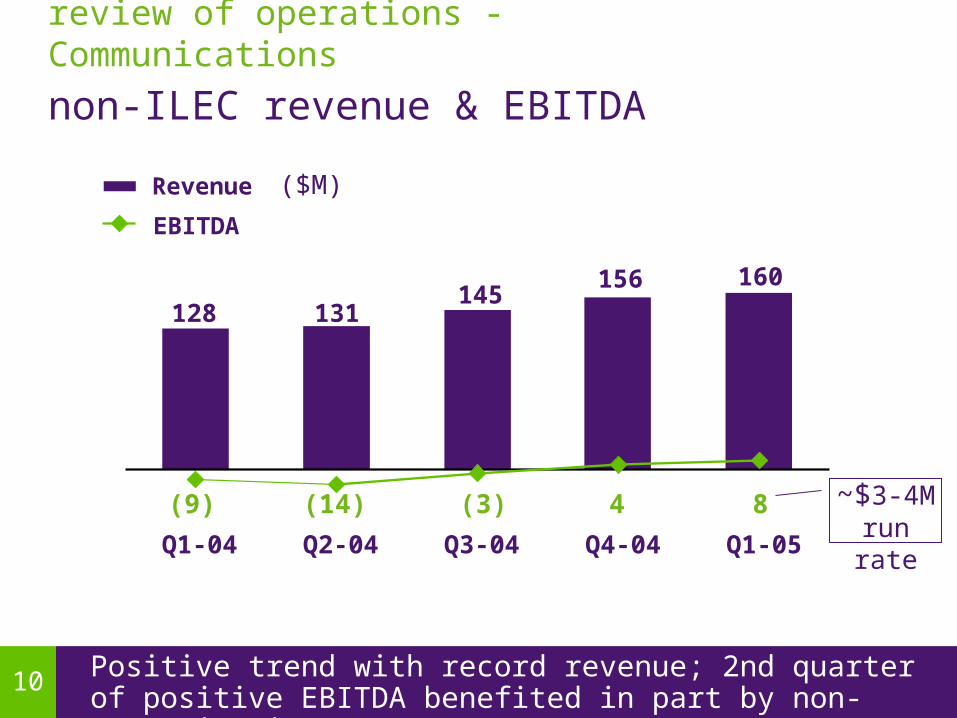
8(3)(14) 4(9)
Q1-04 Q2-04 Q3-04 Q4-04 Q1-05
128145
131156 160
Communications segment
Positive trend with record revenue; 2nd quarter of positive EBITDA benefited in part by non-recurring items
Revenue
EBITDA
($M)
review of operations - Communications
non-ILEC revenue & EBITDA
~$3-4M run rate

11High-speed Internet subscriber additions of 22K in quarter; base up 18% year over year in maturing market
605K
712K
2004
high-speed Internet982K
total Internet subscribers
2005
high-speed 72%
dial-up28%
712K
270K
high-speed Internet subscriber growth
review of operations - Communications

12Continued outstanding wireless revenue, earnings & cash flow growth
41%$278M$198MCash Flow (EBITDA less capex)
-7.9%7.9%Capital Intensity2
36%$337M$248MEBITDA1
19%$753M$633MExternal Revenue
Change Q1-05 Q1-04
1 Earnings before interest, taxes, depreciation and amortization
2 Capital expenditures divided by total revenue
2005 – first quarter review
mobility segment

13 Strong subscriber economics lead the Canadian industry
4 bps1.45%1.49%Churn
1.8%$58$57Avg. Revenue Per Unit (ARPU)
5.4%8076Net Adds (thousands)
15%4.0M3.5MSubscribers
ChangeQ1-05Q1-04
2005 – first quarter review
mobility segment
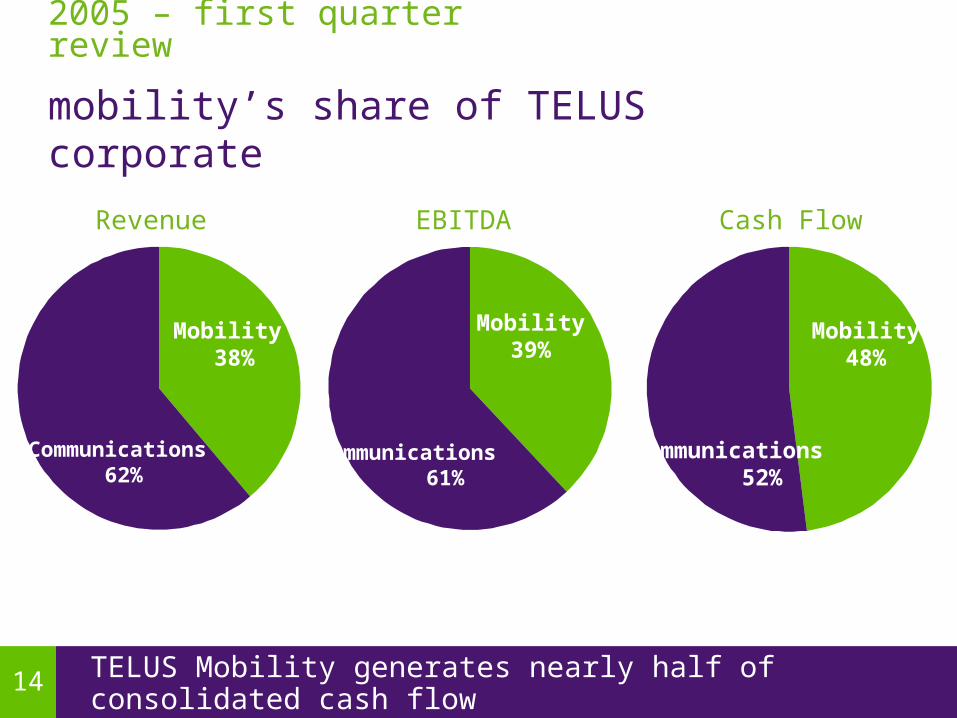
14 TELUS Mobility generates nearly half of consolidated cash flow
Revenue EBITDA
Mobility 39%
Communications 61%
Cash Flow
Mobility 38%
Communications 62%
Mobility 48%
Communications 52%
2005 – first quarter review
mobility’s share of TELUS corporate
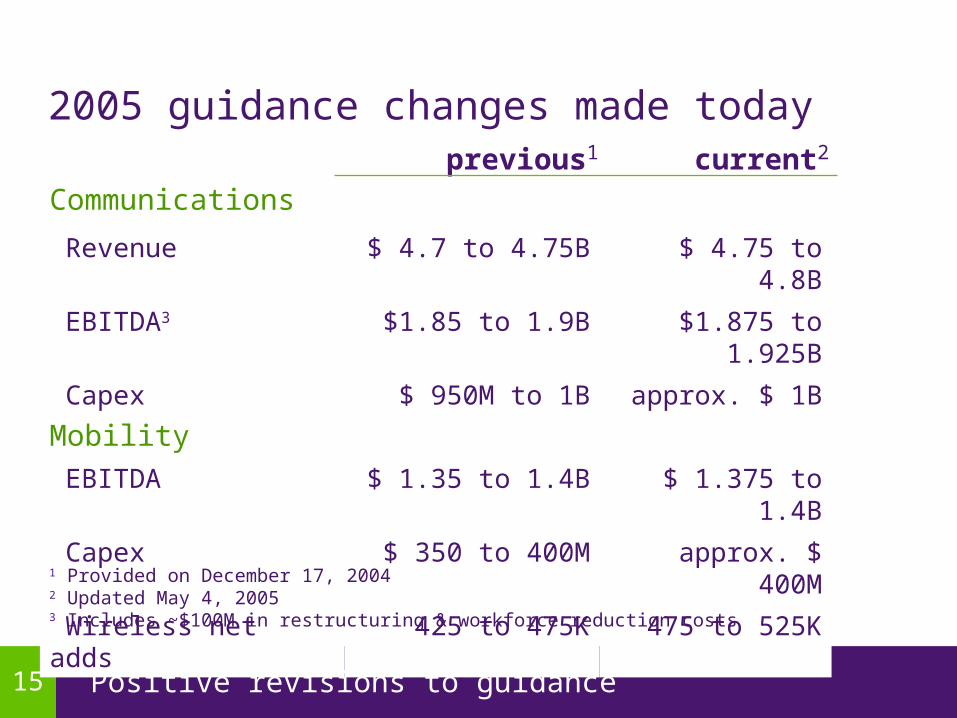
15 Positive revisions to guidance
current2previous1
Communications
Revenue $ 4.7 to 4.75B $ 4.75 to 4.8B
EBITDA3 $1.85 to 1.9B $1.875 to 1.925B
Capex $ 950M to 1B approx. $ 1B
Mobility
EBITDA $ 1.35 to 1.4B $ 1.375 to 1.4B
Capex $ 350 to 400M approx. $ 400M
Wireless net adds 425 to 475K 475 to 525K
1 Provided on December 17, 2004 2 Updated May 4, 20053 Includes ~$100M in restructuring & workforce reduction costs
2005 guidance changes made today

16 Positive revisions to consolidated guidance
current2previous1
Consolidated
Revenue $ 7.9 to 8.0B $ 7.95 to 8.05B
EBITDA3 $ 3.2 to 3.3B $ 3.25 to 3.325B
EPS $ 1.65 to 1.85 $ 1.85 to 2.05
Capex $ 1.3 to 1.4B approx. $ 1.4B
Free cash flow $ 1.2 to 1.3B $ 1.25 to 1.35B
1 Provided on December 17, 2004 2 Updated May 4, 20053 Includes ~$100M in restructuring & workforce reduction costs
2005 guidance changes made today

17
$7.95 to 8.05B
$3.25 to 3.325B
$1.85 to 2.05
approx. $1.4B
$1.25 to 1.35B
Current outlook reflects strong expected growth
5 to 6%
1 2005 Includes ~$100M in restructuring & workforce reduction costs2 Includes $0.21 in 2004 and $0.15 in 2005 guidance for favourable settlement of tax matters Normalized EPS growth would be 24 to 39%
flatFree Cash Flow
6%Capex
17 to 30%EPS2
5 to 8%
annual change
EBITDA1
Revenue
2005E
2005 consolidated guidance summary
18
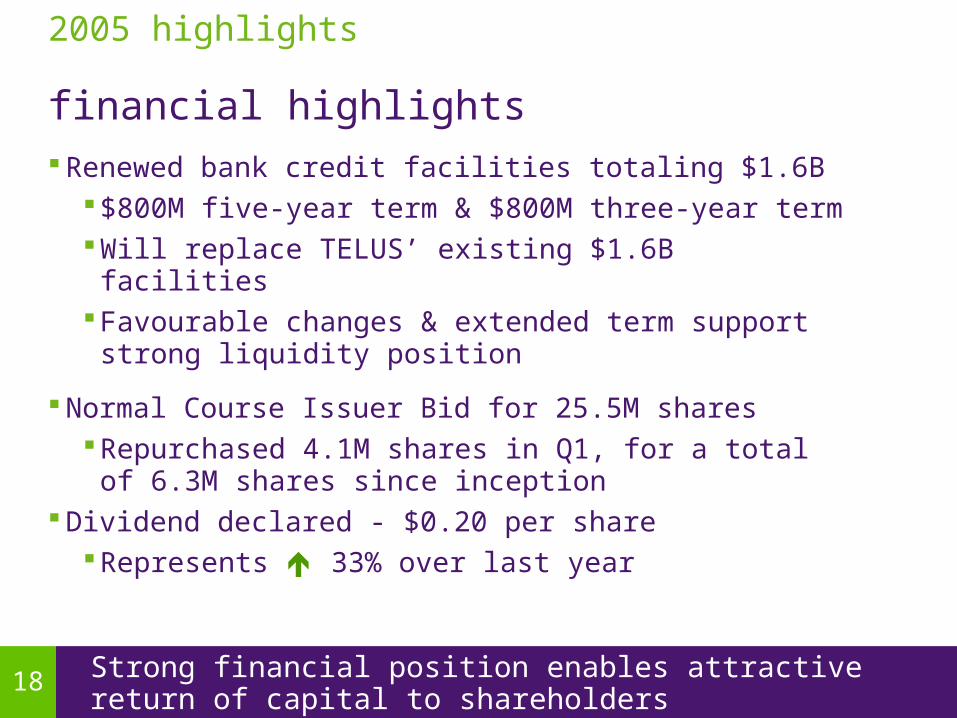
Renewed bank credit facilities totaling $1.6B$800M five-year term & $800M three-year termWill replace TELUS’ existing $1.6B facilitiesFavourable changes & extended term support
strong liquidity position
Normal Course Issuer Bid for 25.5M sharesRepurchased 4.1M shares in Q1, for a total of 6.3M
shares since inception Dividend declared - $0.20 per share
Represents 33% over last year
Strong financial position enables attractive return of capital to shareholders
2005 highlights
financial highlights

19
2005annual & special meeting

20
the future is friendly
2005first quarter review & conference call
May 5, 2005
Robert McFarlaneEVP & Chief Financial Officer

21 Strong increases in revenue and profitability
12%$273M$310MCapex
139%$0.67$0.28EPS2
19%$856M$721MEBITDA1
9.5%$1.98B$1.80BRevenue
ChangeQ1-05Q1-04
1 Earnings before interest, taxes, depreciation and amortization
financial results
Free Cash Flow3 $443M $567M 28%
3 EBITDA, adding Restructuring and workforce reduction costs, cash interest received and excess of share compensation expense over share compensation payments, subtracting cash interest paid, cash taxes, capital expenditures, and cash restructuring payments
2 Including favourable impacts for tax settlements on EPS of $0.04 in Q1-04 & $0.15 in Q1-05
TELUS consolidated
4

22
15 cent impact on EPS in Q1-05 versus 4 cents in Q1-04
reflects change in tax estimates for available temporary differences, other tax adjustments, and related interest income on settlements
tax normalization
TELUS consolidated
5

23
CDNS
35% of TELUS ILEC local voice revenue regulated
Feb-05, Competitive digital network services (CDNS) decision
Positive consolidated impact of $25M in 2005
unfavourable ILEC impacts effectively offset by mandated price reductions accrued in deferral account
expense reductions for non-ILEC & Mobility
Portable Subsidy
TELUS Quebec benefited from decision on portable subsidy retroactive to 2003 & 2004
positive impact of $10M in 2005
regulatory update
TELUS consolidated
positive regulatory impacts6

24 Normalized quarterly EPS increase of $0.27
EPS continuity
($0.01)- Retroactive impacts of TQ, CDNS regulatory decisions
($0.15)($0.04) Income tax settlement
139%$0.67$0.28EPS reported
ChangeQ1-05Q1-04
EPS normalized $0.24 $0.51 113%
TELUS consolidated
7
25
$274
(4)
(42)
$443
88
(9)
(310)
$721
Q1-04
$510
(145)
-
$567
(1)
(7)
(273)
$856
Q1-05
Cash avail. for debt reduction & share redemp.Working Capital/Other
Cash Dividends
Free Cash Flow
Net Cash Tax Recovery
Net Cash Interest
Capex
EBITDA
($M)
(53) (12)Cash Restructuring Payments (in excess of expense)
5 4Non-Cash Share Based Compensation
(150) -Acc. Rec. Securitization Program Reduction
27 88Share Issuance (non-public)
$267 $351Net change in cash(7) (159)Net change in LTD & share repurchase
free cash flow
TELUS consolidated
8

26 Continued strong revenue, earnings & cash flow growth
41%278198Cash Flow (EBITDA less capex)
19%6050Capex
36%337248EBITDA1
19%753633External Revenue
ChangeQ1-05Q1-04
1 Earnings before interest, taxes, depreciation and amortization
($M)
Mobility segment
financial results
9

27
subscriber results
Continued strong postpaid mix
net additions
Q1-04 Q1-05
76K80K
4.0M
total wireless subscribers
postpaid83%
prepaid17%
3.3M
0.7M
Mobility segment
10
28
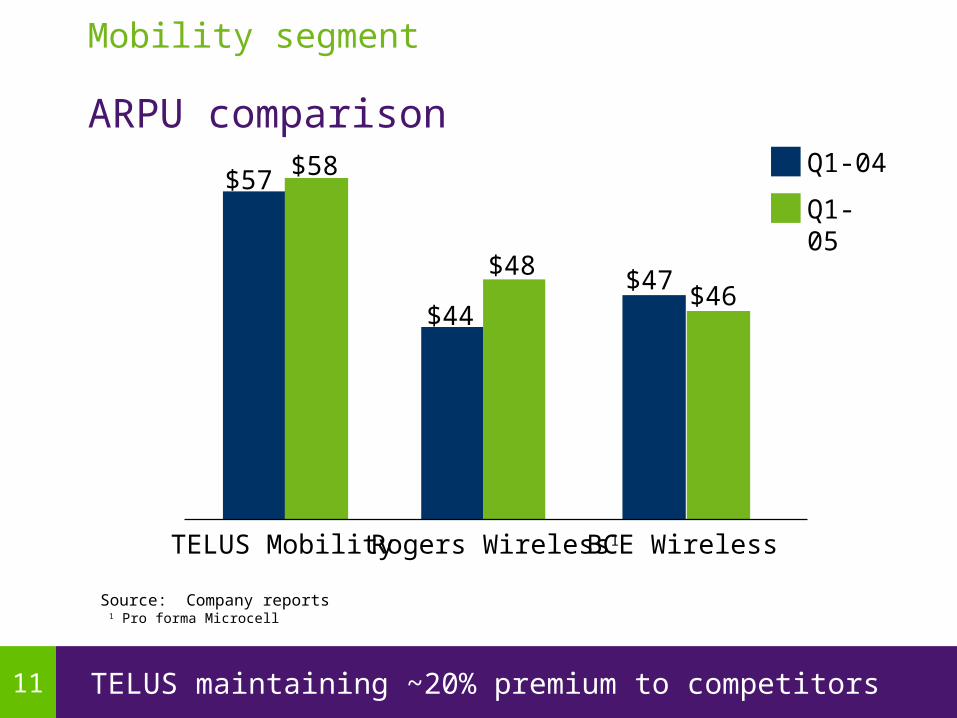
Source: Company reports
TELUS Mobility Rogers Wireless1BCE Wireless
$57
$44$47
$58
$48$46
Q1-04
Q1-05
1 Pro forma Microcell
TELUS maintaining ~20% premium to competitors
ARPU comparison
Mobility segment
11
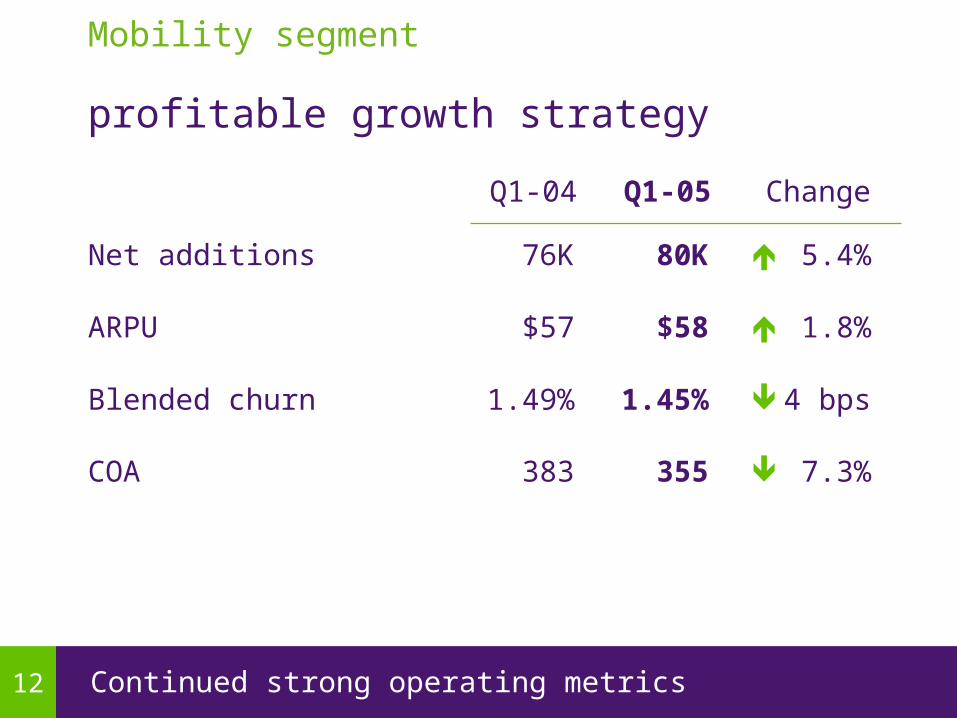
29 Continued strong operating metrics
7.3%355383COA
4 bps1.45%1.49%Blended churn
1.8%$58$57ARPU
5.4%80K76KNet additions
ChangeQ1-05Q1-04
profitable growth strategy
Mobility segment
12
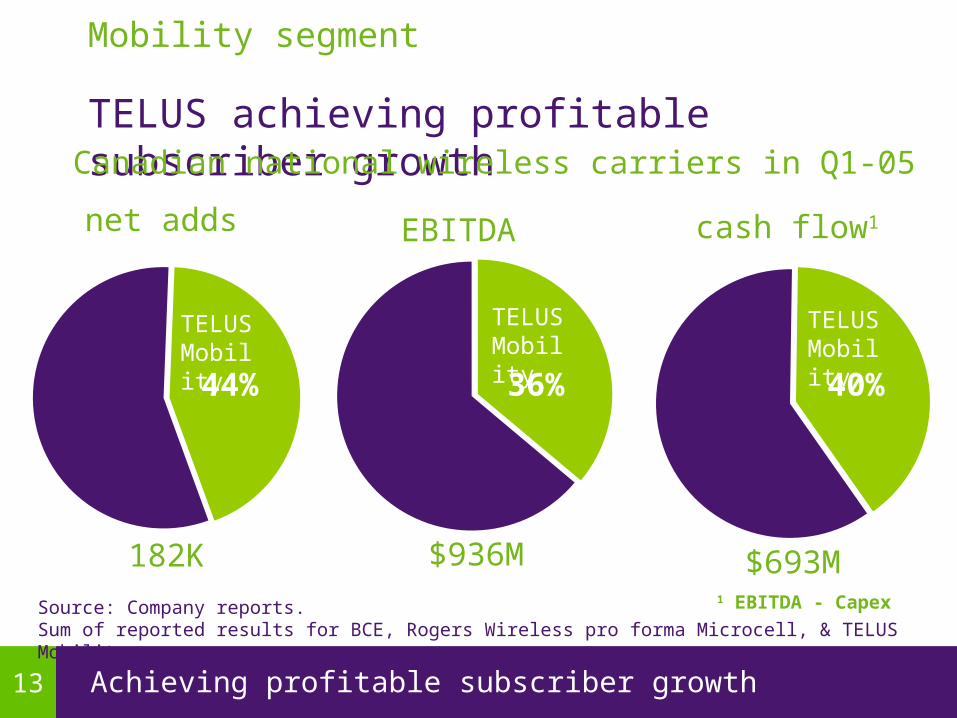
30 Achieving profitable subscriber growth
Mobility segment
TELUS achieving profitable subscriber growth
$936M182K
EBITDA
net adds
TELUSMobility
36%44%
TELUSMobility
$693M
cash flow1
40%
TELUSMobility
1 EBITDA - Capex
Canadian national wireless carriers in Q1-05
44%
TELUSMobility
40%
TELUSMobility
Source: Company reports. Sum of reported results for BCE, Rogers Wireless pro forma Microcell, & TELUS Mobility
13
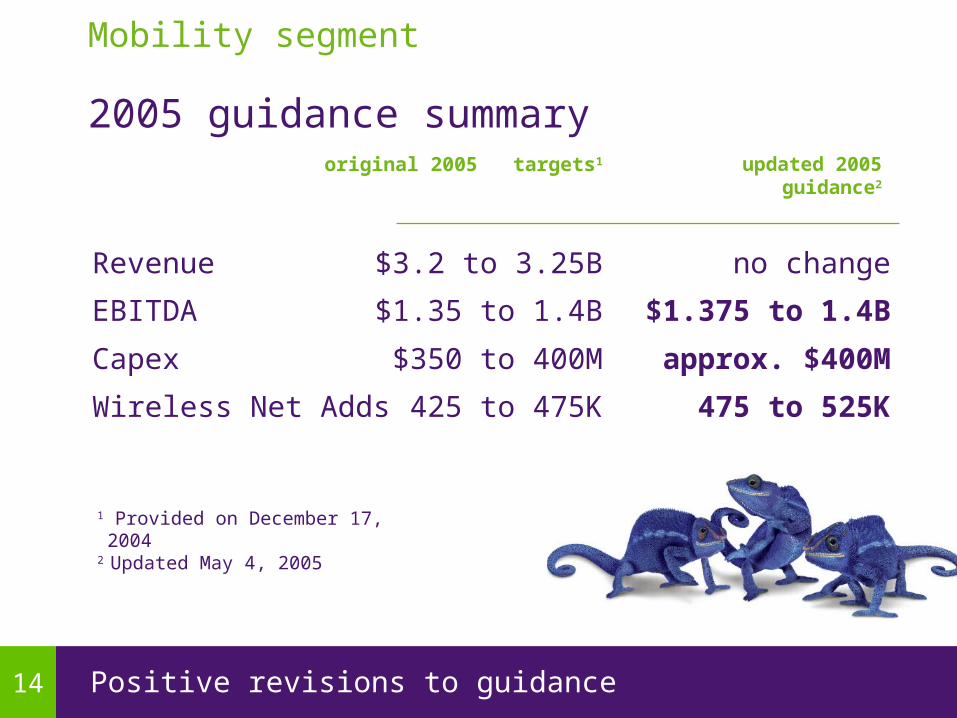
31 Positive revisions to guidance
2005 guidance summary
1 Provided on December 17, 20042 Updated May 4, 2005
425 to 475KWireless Net Adds
$350 to 400MCapex
updated 2005 guidance2
EBITDA
Revenue
original 2005 targets1
$1.35 to 1.4B
$3.2 to 3.25B
475 to 525K
approx. $400M
$1.375 to 1.4B
no change
Mobility segment
14
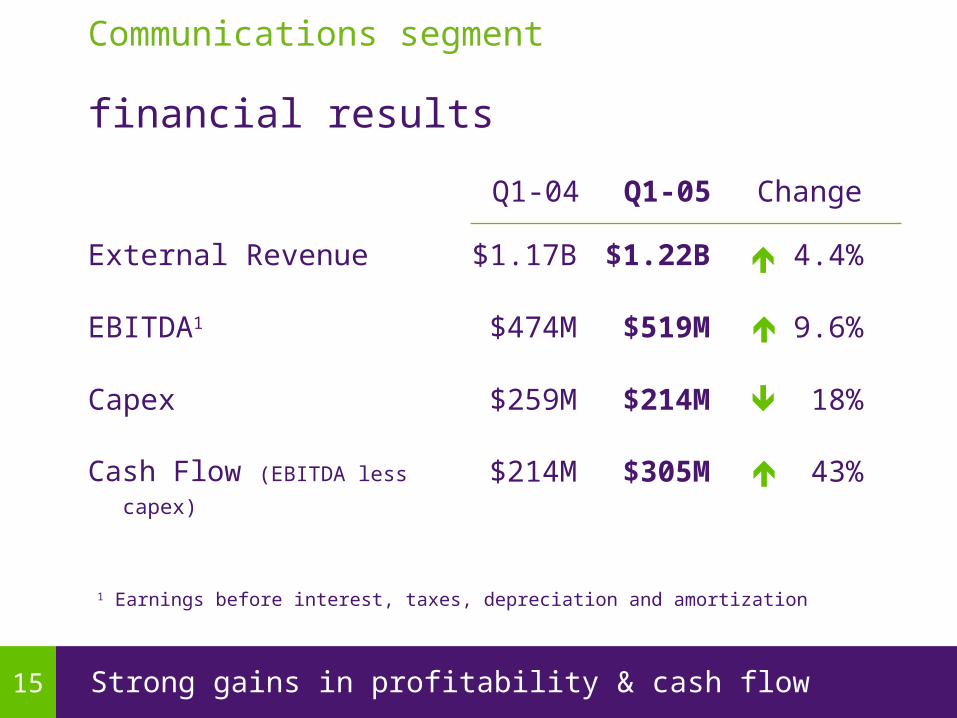
32 Strong gains in profitability & cash flow
43%$305M$214MCash Flow (EBITDA less capex)
18%$214M$259MCapex
9.6%$519M$474MEBITDA1
4.4%$1.22B$1.17BExternal Revenue
ChangeQ1-05Q1-04
1 Earnings before interest, taxes, depreciation and amortization
financial results
Communications segment
15

333rd straight quarter of year over year wireline revenue growth driven by data
10%6573Other
11%378340Data
1.4%226230Voice – Long Distance
4.5%553529Voice – Local
ChangeQ1-05Q1-04
External Revenue $1,171 $1,222
($M)
Communications segment
revenue profile
4.4%
16
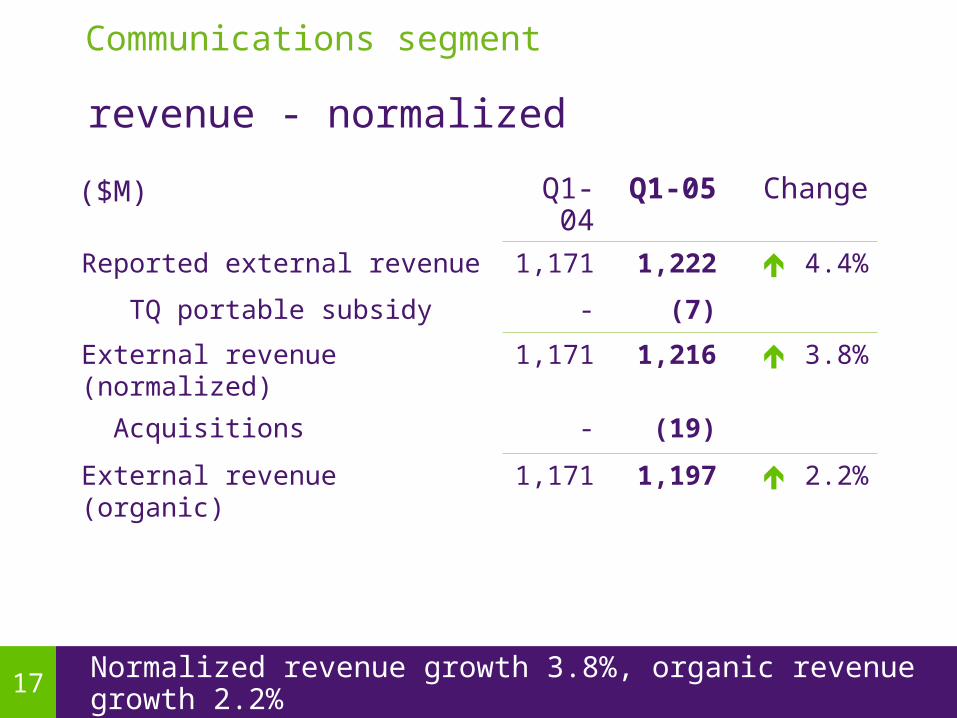
34 Normalized revenue growth 3.8%, organic revenue growth 2.2%
revenue - normalized
Q1-04 Q1-05 Change
Reported external revenue 1,171 1,222 4.4%
TQ portable subsidy - (7)
External revenue (normalized) 1,171 1,216 3.8%
Acquisitions - (19)
External revenue (organic) 1,171 1,197 2.2%
($M)
Communications segment
17

35 Normalized local revenue flat & data growth of 11%
Q1-04 Q1-05 Change
Local revenue (reported) 529 553 4.5%
TQ portable subsidy - (7)
CDNS - def. account - (18)
Local revenue (normalized) 529 528 0.2%
Data revenue (reported) 340 378 11%
Acquisitions - (19)
CDNS impact - data - 18
Data revenue (normalized) 340 377 11%
($M)
Communications segment
local and data revenue - normalized
18

36
Q1-04 Q2-04 Q3-04 Q4-04 Q1-05
-1.3% -1.4%-1.2% -1.3% -1.1%
Strongest NAL result in 5 quarters despite growing competition
% of network access lines lost, YoY
network access line results
Q4-03
-0.8%
Communications segment
19
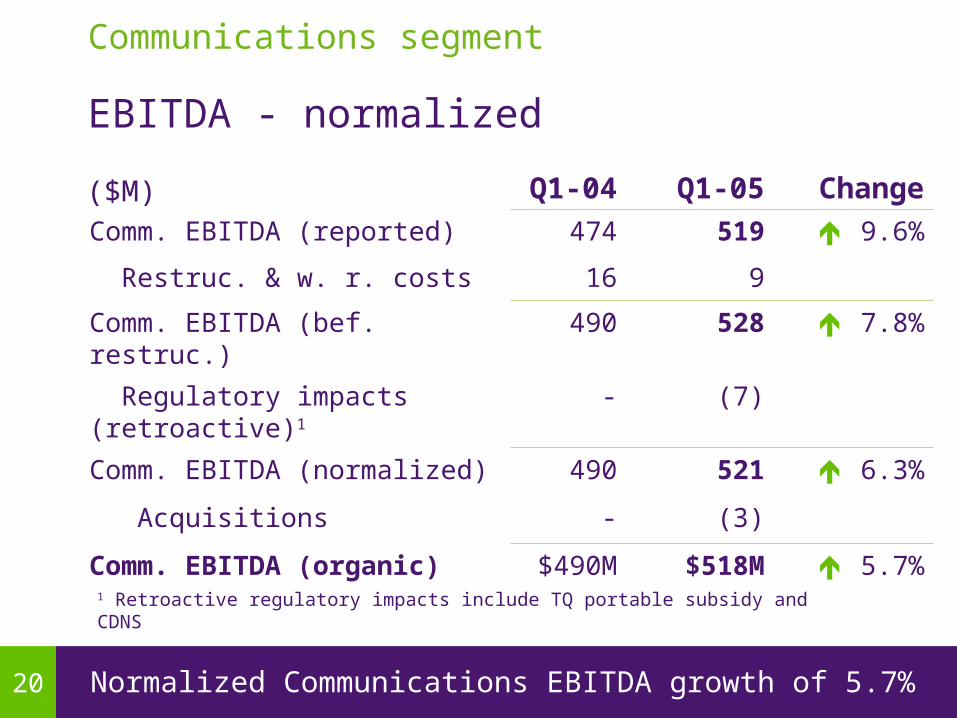
37 Normalized Communications EBITDA growth of 5.7%
EBITDA - normalized
Q1-04 Q1-05 Change
Comm. EBITDA (reported) 474 519 9.6%
Restruc. & w. r. costs 16 9
Comm. EBITDA (bef. restruc.) 490 528 7.8%
Regulatory impacts (retroactive)1 - (7)
Comm. EBITDA (normalized) 490 521 6.3%
Acquisitions - (3)
Comm. EBITDA (organic) $490M $518M 5.7%
($M)
Communications segment
1 Retroactive regulatory impacts include TQ portable subsidy and CDNS
20
38
8(3)(14) 4(9)
Q1-04 Q2-04 Q3-04 Q4-04 Q1-05
128145
131156 160
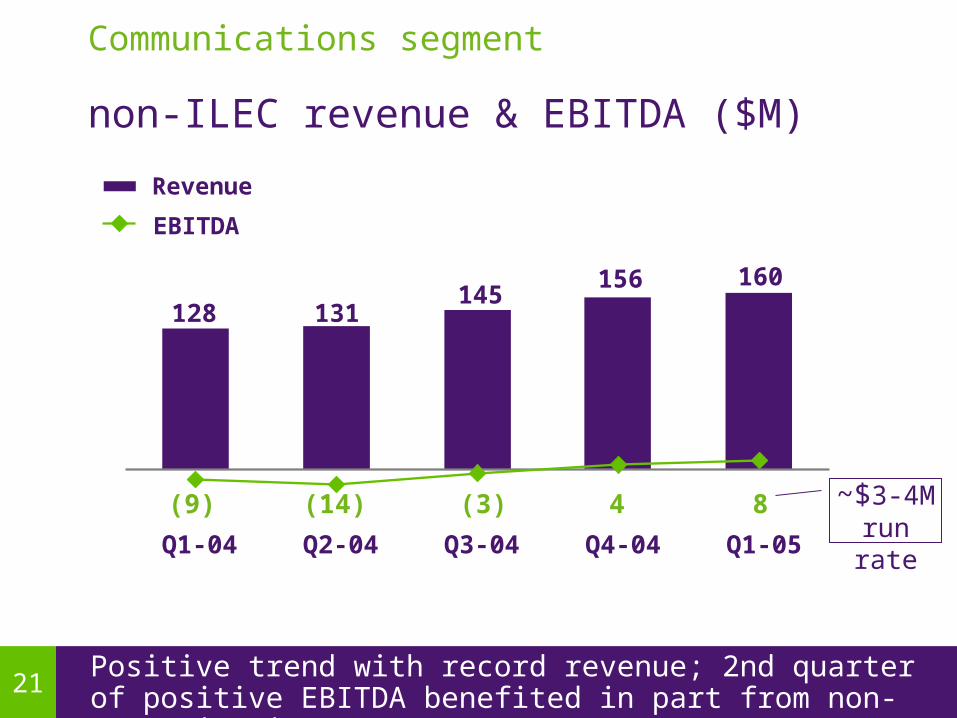
Positive trend with record revenue; 2nd quarter of positive EBITDA benefited in part from non-recurring items
Revenue
EBITDA
non-ILEC revenue & EBITDA ($M)
~$3-4M run rate
Communications segment
21
39
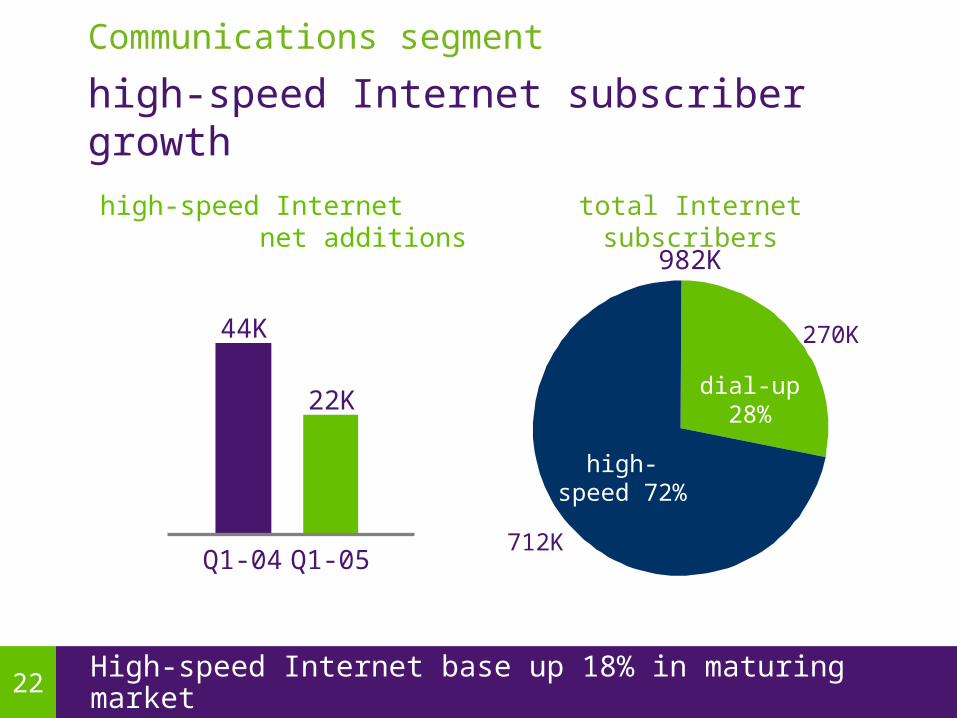
high-speed Internet subscriber growth
High-speed Internet base up 18% in maturing market
high-speed Internet net additions
Q1-04 Q1-05
44K
22K
982K
total Internet subscribers
high-speed 72%
dial-up28%
712K
270K
Communications segment
22

40
Business
Geographic expansion building high quality, recurring revenues in non-ILEC leveraging
IP network & application leadership
$245M long-term contract with Gov’t of B.C.
Consumer
“Future Friendly” home continued high-speed Internet growth launched suite of IP applications
Home Networking, HomeSitterTM launched in 2004 IPTV employee trials continue
Bundling bundling strategy protects legacy revenues
revitalizing wireline growth
Communications segment
23
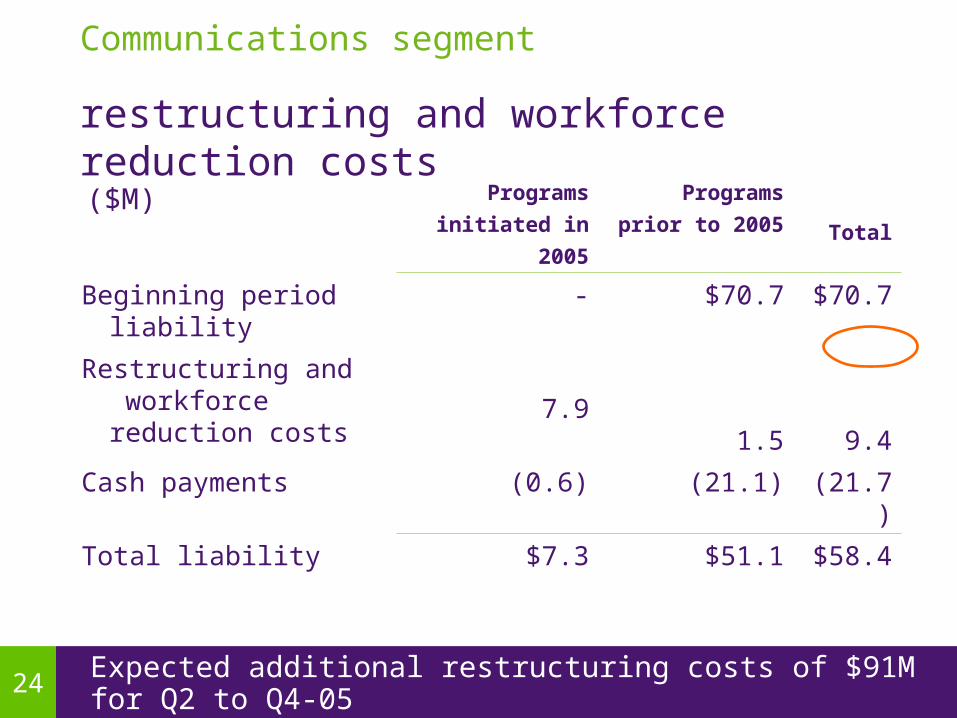
41 Expected additional restructuring costs of $91M for Q2 to Q4-05
restructuring and workforce reduction costs
Programs
initiated in 2005
Programs prior
to 2005 Total
Beginning period liability - $70.7 $70.7
Restructuring and workforce reduction costs
7.9
1.5
9.4
Cash payments (0.6) (21.1) (21.7)
Total liability $7.3 $51.1 $58.4
($M)
Communications segment
24
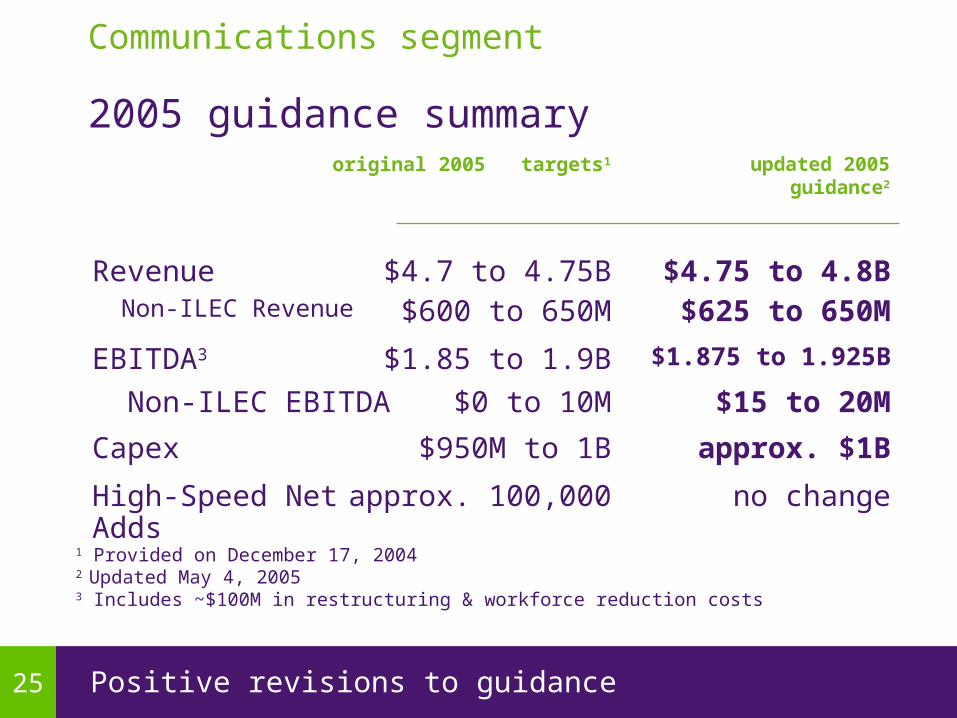
42 Positive revisions to guidance
2005 guidance summary
1 Provided on December 17, 20042 Updated May 4, 20053 Includes ~$100M in restructuring & workforce reduction costs
approx. 100,000High-Speed Net Adds
$950M to 1BCapex
updated 2005 guidance2
EBITDA3
Revenue
original 2005 targets1
$1.85 to 1.9B
$4.7 to 4.75B
no change
approx. $1B
$1.875 to 1.925B
$4.75 to 4.8B Non-ILEC Revenue $600 to 650M $625 to 650M
Non-ILEC EBITDA $0 to 10M $15 to 20M
Communications segment
25
43
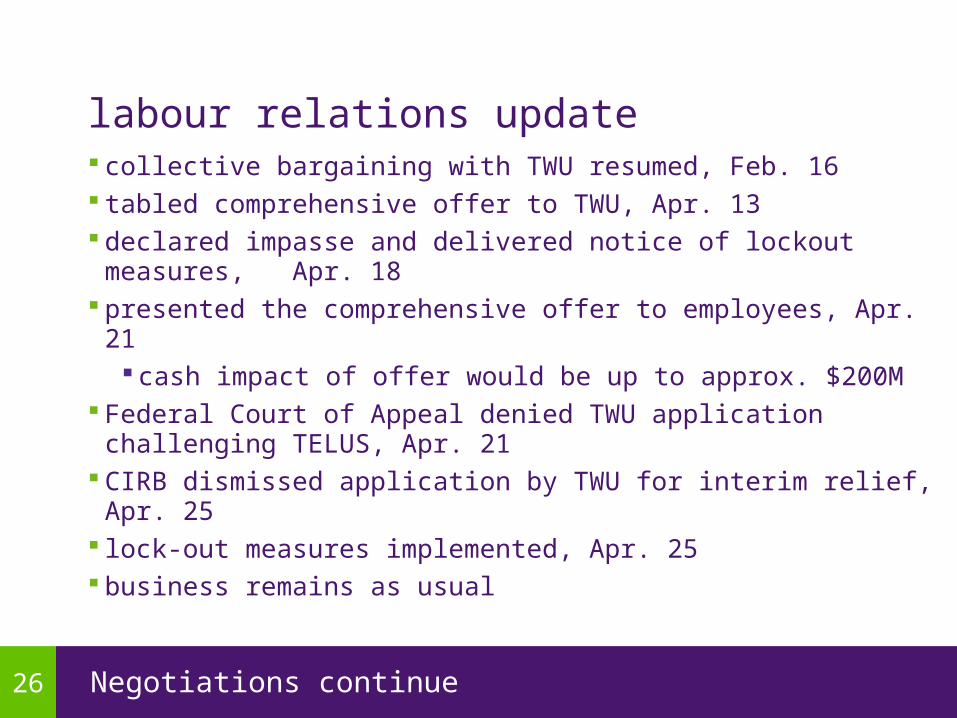
collective bargaining with TWU resumed, Feb. 16 tabled comprehensive offer to TWU, Apr. 13 declared impasse and delivered notice of lockout measures,
Apr. 18 presented the comprehensive offer to employees, Apr. 21
cash impact of offer would be up to approx. $200M Federal Court of Appeal denied TWU application challenging
TELUS, Apr. 21 CIRB dismissed application by TWU for interim relief, Apr. 25 lock-out measures implemented, Apr. 25 business remains as usual
Negotiations continue
labour relations update
26
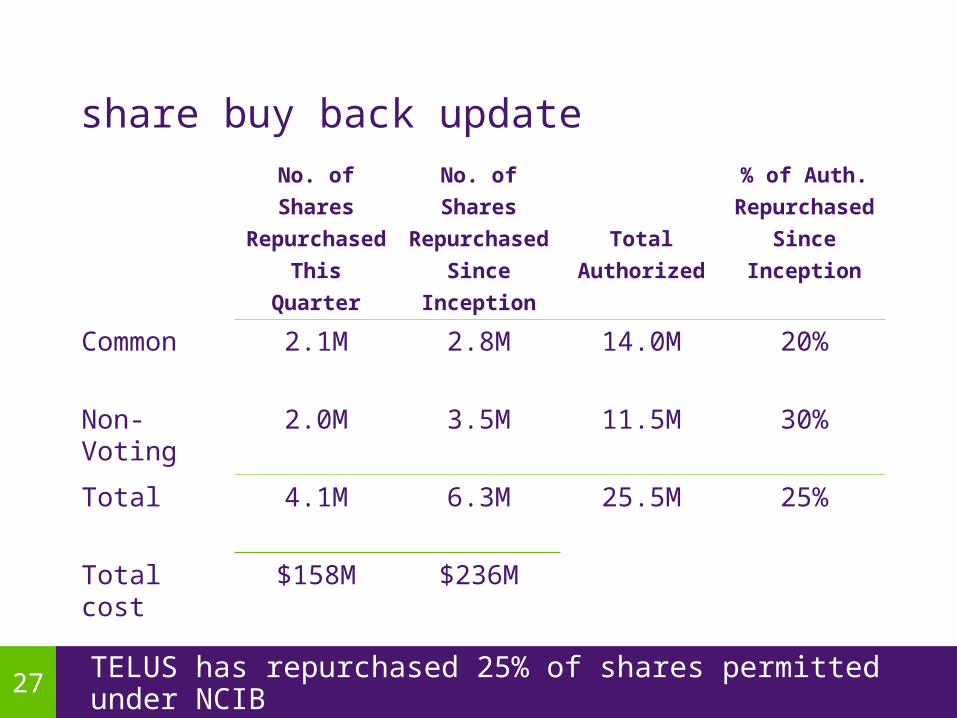
44 TELUS has repurchased 25% of shares permitted under NCIB
share buy back updateNo. of Shares
Repurchased
This Quarter
No. of Shares
Repurchased
Since
Inception
Total
Authorized
% of Auth.
Repurchased
Since
Inception
Common 2.1M 2.8M 14.0M 20%
Non-Voting 2.0M 3.5M 11.5M 30%
Total 4.1M 6.3M 25.5M 25%
Total cost $158M $236M
27

45
Effective May 4, 2005, TELUS entered into new credit facilities totaling $1.6 billion $800M five-year revolving term expiring May 2010$800M three-year revolving term expiring May 2008Facilities mature subsequent to 06/07 debt
maturities Will replace TELUS’ existing $1.6B committed facilities Favourable changes to pricing & extended terms
reinforce strong liquidity position
Renewal of credit facilities reflect strong financial position
renewed bank credit facilities
28

46 Positive changes reflect Q1 momentum and tax settlement
2005 consolidated guidance summary
1 Provided on December 17, 20042 Updated May 4, 20053 Includes ~$100M in restructuring & workforce reduction costs4 Updated guidance includes $0.15 in 2005 for favourable settlement of tax matters
$1.2 to $1.3BFree Cash Flow
$1.3 to $1.4BCapex
$1.65 to $1.85EPS4
updated 2005 guidance2
EBITDA3
Revenue
original 2005 targets1
$3.2 to $3.3B
$7.9 to $8.0 B
$1.25 to $1.35B
approx. $1.4B
$1.85 to $2.05
$3.25 to $3.325B
$7.95 to $8.05B
29

47
2005first quarter review
questions?