1. the light vehicle market, advertising & the economy phil brady, nada president national...
TRANSCRIPT

1

The Light Vehicle Market, Advertising & the Economy
Phil Brady, NADA PresidentNational Automobile Dealers Association, McLean, VAwww.nada.org
Television Bureau of AdvertisingAnnual Forecast ConferenceNew York CitySeptember 5, 2002
2

Franchised Auto Dealers are a Vital Cog in the U.S. Economy
Franchised Auto Dealers are a Vital Cog in the U.S. Economy
• At around a trillion dollars per year, the auto retailing business is the largest retail industry in America. Franchised New Car Dealers account for over $700 billion, or 70 percent
• Twenty-two percent of retail sales in the U.S. today are generated at franchised new car dealerships
• New light vehicle sales have enjoyed the 3 best years in history, 1999 - 2001.
• NADA expects 2002 to be 4th best sales year
3

Source: NADA Industry Analysis
4
6
8
10
12
14
16
18
20
Mill
ion
s o
f U
nit
s
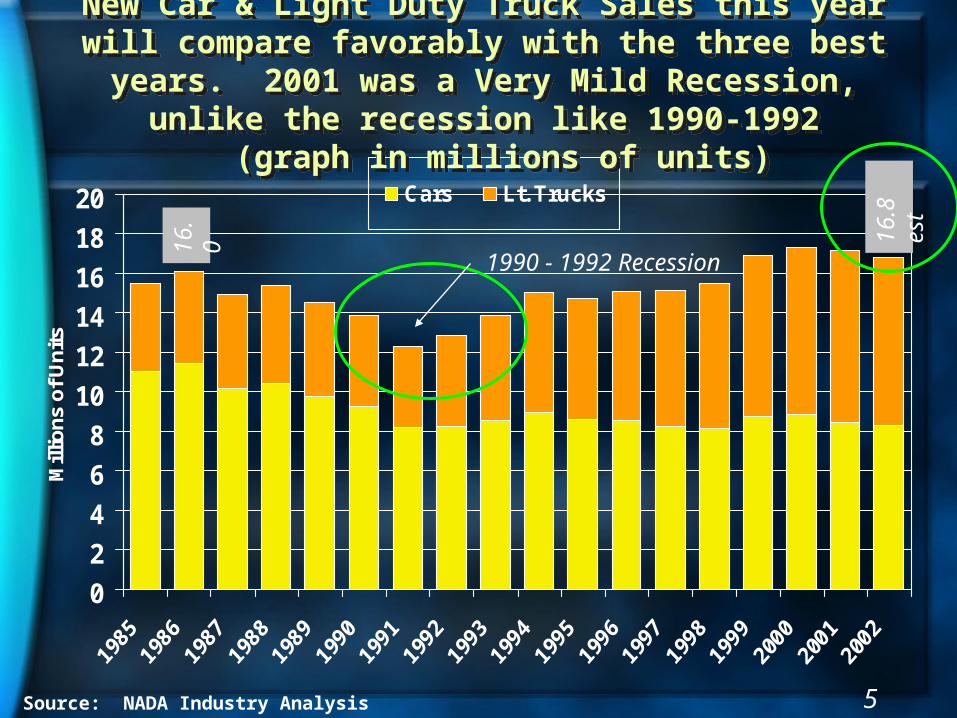
2001 = 17.1 million units (New)2002E = 16.8 million units (New)
2001 = 13.3 million units (Used)2002E = 13.2 million units (Used)
New Car & Light Duty Truck Sales were Well Above the Trend Line in Recent Years
(millions of units)
New Car & Light Duty Truck Sales were Well Above the Trend Line in Recent Years
(millions of units)
4
Source: NADA Industry Analysis
0
2
4
6
8
10
12
14
16
18
20
Mill
ion
s o
f U
nit
s
Cars Lt. Trucks
New Car & Light Duty Truck Sales this year will compare favorably with the three best years. 2001 was a Very Mild
Recession, unlike the recession like 1990-1992 (graph in millions of units)
New Car & Light Duty Truck Sales this year will compare favorably with the three best years. 2001 was a Very Mild
Recession, unlike the recession like 1990-1992 (graph in millions of units)
1990 - 1992 Recession
16.8
es
t
16.
0
5
Source: NADA Industry Analysis
0
2
4
6
8
10
12
14
16
18
20
Mill
ion
s o
f Un
its
Lt. Trucks
Cars
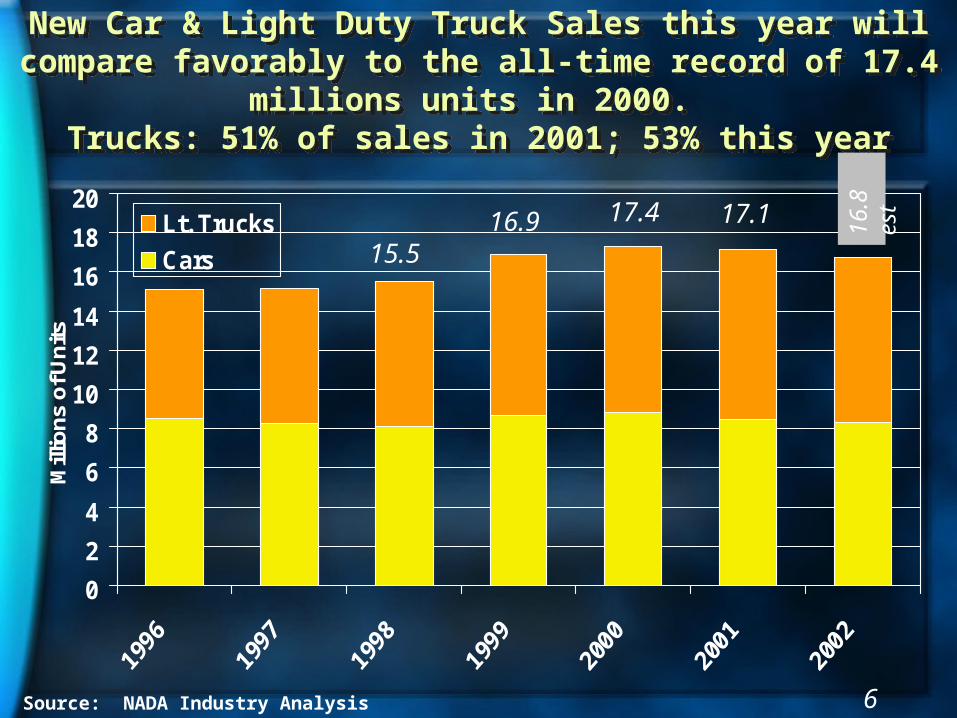
New Car & Light Duty Truck Sales this year will compare favorably to the all-time record of 17.4 millions units in 2000.
Trucks: 51% of sales in 2001; 53% this year
New Car & Light Duty Truck Sales this year will compare favorably to the all-time record of 17.4 millions units in 2000.
Trucks: 51% of sales in 2001; 53% this year
16.8
es
t
15.516.9 17.4 17.1
6

“Crossover” sales, a subset of SUVs, Show Most of the Growth in Sales and a Strong Change in U.S. Segment Share of New Light-Vehicle Sales (YTD July 2002 Vs YTD July 2001).Truck-based SUVs and Luxury Cars gained slightly in share.
“Crossover” sales, a subset of SUVs, Show Most of the Growth in Sales and a Strong Change in U.S. Segment Share of New Light-Vehicle Sales (YTD July 2002 Vs YTD July 2001).Truck-based SUVs and Luxury Cars gained slightly in share.
-1.0% -0.5% 0.0% 0.5% 1.0% 1.5% 2.0%
Small Car
Mid Car
Large Car
Luxury Car
Crossover Utility Vehicles
Truck-Based SUV's
Van
Pickup
Percentage Point Change in Share of Sales, YTD July 2002 and YTD July 2001
Source: Ward’s Automotive *Crossover Utility Vehicles are built on unitized car platforms 7

Korea and other lower volume countries show the largest Change in Sales by Country of Origin Share Change in U.S. New Light-Vehicle Sales, YTD July 2002 Vs. YTD July 2001
Korea and other lower volume countries show the largest Change in Sales by Country of Origin Share Change in U.S. New Light-Vehicle Sales, YTD July 2002 Vs. YTD July 2001
-2.5% -2.0% -1.5% -1.0% -0.5% 0.0% 0.5% 1.0% 1.5%
North America(Domestic)
Germany
Japan
S. Korea
Others
Percentage Point Change in Share of Sales, YTD July 2002 and YTD July 2001
Source: Ward’s Automotive 8
Source: Ward’s Automotive
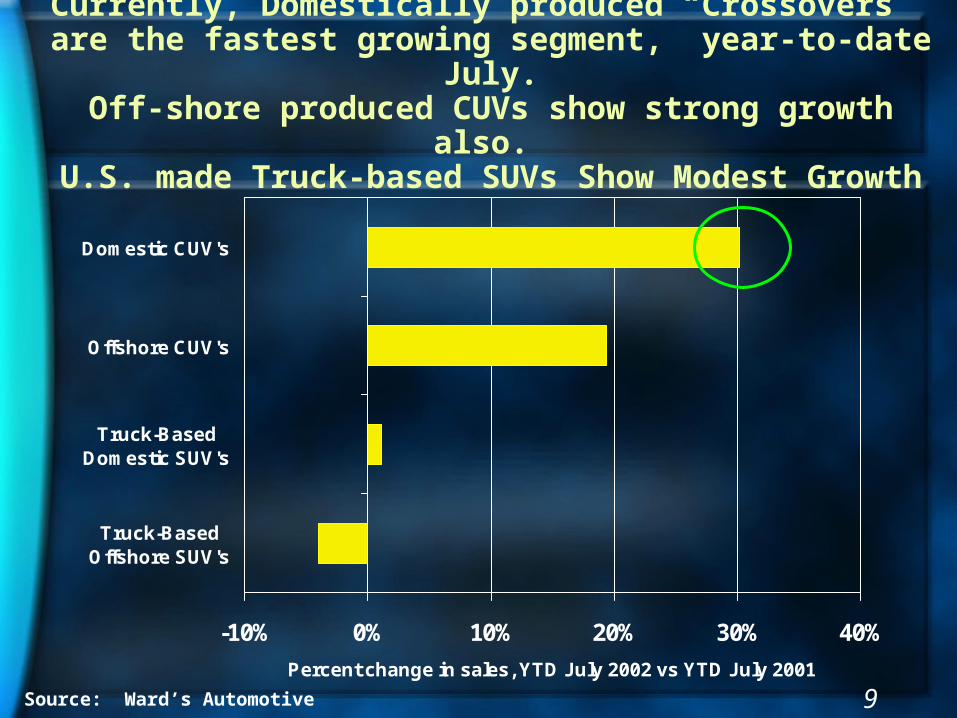
Currently, Domestically produced “Crossovers” are the fastest growing segment, year-to-date July.Off-shore produced CUVs show strong growth also. U.S. made Truck-based SUVs Show Modest Growth
-10% 0% 10% 20% 30% 40%
Truck-BasedOffshore SUV's
Truck-BasedDomestic SUV's
Offshore CUV's
Domestic CUV's
Percent change in sales, YTD July 2002 vs YTD July 2001
9

Net Household Wealth = Total Financial Assets - Total Liabilities
(excludes home equity but includes all mortgage debt)
Source: Federal Reserve Flow of Funds Data, Z.1., Table L.10.
$0
$5
$10
$15
$20
$25
$ T
rill
ion
sU.S. Household Net Financial Assets Doubled
from 1994 through 1999 (5 years)Then the impact of Equity Market Corrections ensued
U.S. Household Net Financial Assets Doubled from 1994 through 1999 (5 years)
Then the impact of Equity Market Corrections ensued
10

Net Household Wealth = Total Financial Assets - Total Liabilities
Source: Federal Reserve Flow of Funds Data, Z.1., Table L.10., Ward’s Automotive
$12
$14
$16
$18
$20
$22
$24
$ T
rilli
on
s
350000
370000
390000
410000
430000
450000
470000
490000
510000
Un
its
Net Houshold Assets (wealth) Luxury Vehicle Sales (right axis)
Looking at the Correction by Quarters:U.S. Net Household Assets fell during Stock Market
Corrections, which subdued Luxury Light Vehicle Sales(Blue Line)
Looking at the Correction by Quarters:U.S. Net Household Assets fell during Stock Market
Corrections, which subdued Luxury Light Vehicle Sales(Blue Line)
estim
ate
d
Incentives for Luxury Makes Have Helped Increase Sales Recently
11

How Have Light Vehicle Sales Remained So Strong?Total Dealership Advertising Spending Jumped
with Record Vehicle Sales
$0
$1
$2
$3
$4
$5
$6
$7
19
85
19
86
19
87
19
88
19
89
19
90
19
91
19
92
19
93
19
94
19
95
19
96
19
97
19
98
19
99
20
00
20
01
Bil
lio
ns
of
do
lla
rs
Source: NADA Industry Analysis 12

Franchised Dealers’ Overall Ad Spending increased 3.7% in 2001 compared with 2000,
shown below by media
Franchised Dealers’ Overall Ad Spending increased 3.7% in 2001 compared with 2000,
shown below by media
$0
$500
$1,000
$1,500
$2,000
$2,500
$3,000
$3,500
$4,000
Newspapers Radio TV & CableTV
Direct Mail Internet Other
Ad
Sp
end
ing
200
1 vs
200
0 (m
illi
on
s o
f d
oll
ars)
2000 2001
Source: NADA Industry Analysis
*Other includes items such as Community/Event Sponsorship,
Billboard/Transit Ads, Yellow Pages/Shopper Flyers,
and Magazines
13
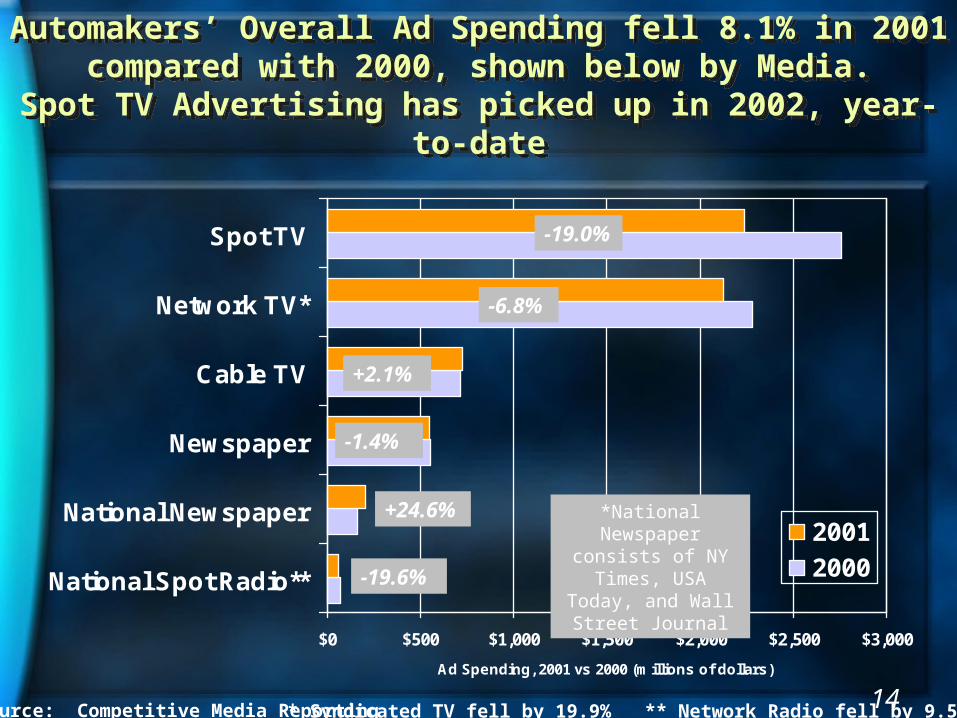
Automakers’ Overall Ad Spending fell 8.1% in 2001compared with 2000, shown below by Media.
Spot TV Advertising has picked up in 2002, year-to-date
Automakers’ Overall Ad Spending fell 8.1% in 2001compared with 2000, shown below by Media.
Spot TV Advertising has picked up in 2002, year-to-date
$0 $500 $1,000 $1,500 $2,000 $2,500 $3,000
National Spot Radio**
National Newspaper
Newspaper
Cable TV
Network TV*
Spot TV
Ad Spending, 2001 vs 2000 (millions of dollars)
2001
2000
Source: Competitive Media Reporting
*National Newspaper consists of NY
Times, USA Today, and Wall Street
Journal
14* Syndicated TV fell by 19.9% ** Network Radio fell by 9.5%
-19.0%
-6.8%
+2.1%
-1.4%
+24.6%
-19.6%

40
60
80
100
120
140
160
180
1977 III 1982 III 1987 III 1992 III 1997 III 2002
NA
DA
Ind
ex M
easu
re
Optimism
Sales
Source: NADA Industry Analysis
NADA Dealer Optimism Index in July Reflects Market Concerns, but Overall Consumer Confidence is still
Reasonably Strong
NADA Dealer Optimism Index in July Reflects Market Concerns, but Overall Consumer Confidence is still
Reasonably Strong
15

89 % of Dealerships now have a Website, Up from 47 % in 1997
Internet will help Future New Light Vehicle Sales
61%
82%89%
74%
47%
87%81%
52%
37%
69%
0%
10%
20%
30%
40%
50%
60%
70%
80%
90%
100%
1997 1998 1999 2000 2001
WebsiteInteractive Website
Source: NADA Industry Analysis 16

More Services are Offered on Dealership Websites in 2001 compared with 1997
More Services are Offered on Dealership Websites in 2001 compared with 1997
22%
9%
28%
26%
24%
26%
44%
55%
25%
27%
56%
57%
65%
73%
76%
89%
0% 20% 40% 60% 80% 100%
Order on-line
Link to fin'l., ins. & auto sites
Schedule sales appt
Fill out finance
Schedule service appt
View MSRP
Link to mfr web site
View stock
2002
1997
Source: NADA Industry Analysis 17

18