1 the pottery industry. 2 the premises of midway ceramics
TRANSCRIPT

1 The Pottery Industry

2 The Premises of Midway Ceramics

3. Product finishing line – Midway Ceramics. The roller conveyors enable fast and efficient movement of products to the various painting stations.

4 A wider view of the finishing department at Midway Ceramics showing the various painting spray booths
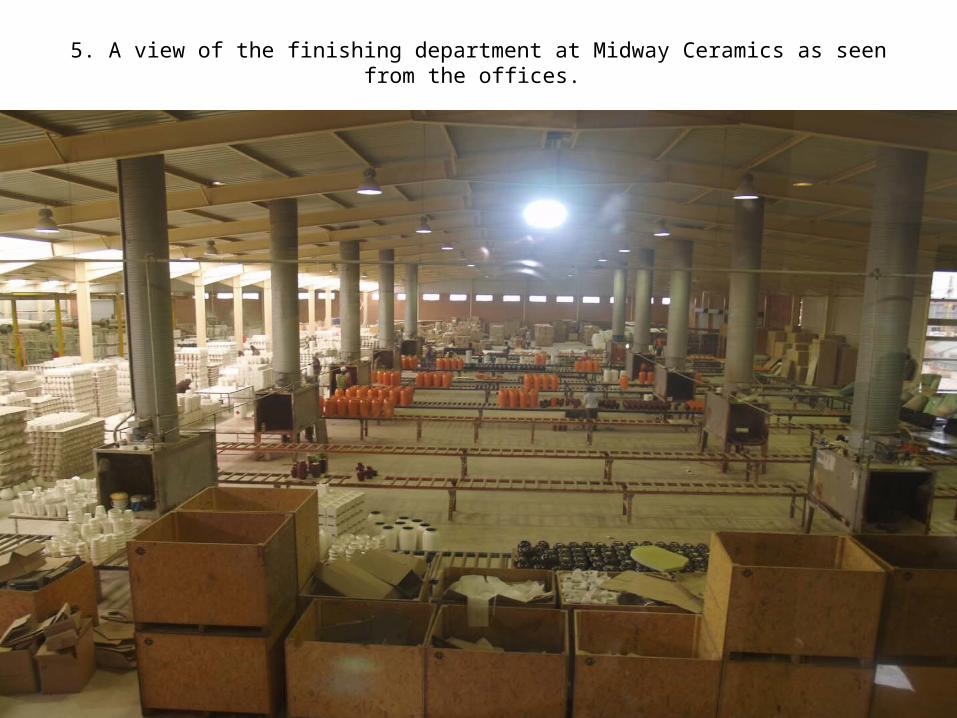
5. A view of the finishing department at Midway Ceramics as seen from the offices.

6. Work-in-progress at Midway Ceramics. Products awaiting finishing.
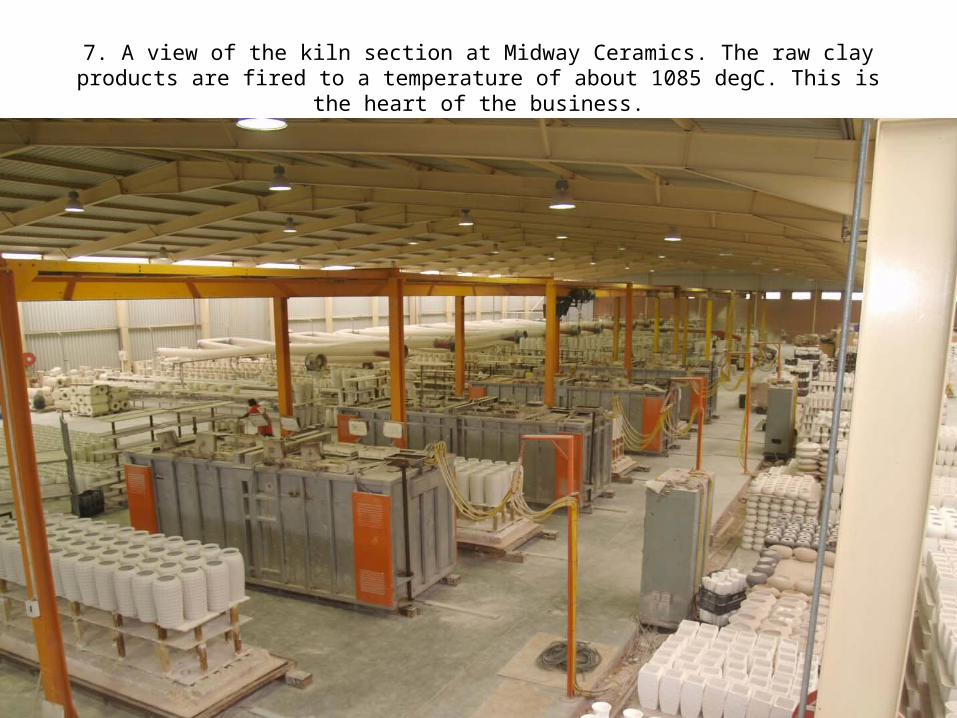
7. A view of the kiln section at Midway Ceramics. The raw clay products are fired to a temperature of about 1085 degC. This is the heart of the business.

8. A closer view of a kiln (or furnace)

9. A view of the manufacturing side of the business. The products are cast in moulds in a process known as slip casting

10. The premises of Progress Ceramics. Approximately 4500 square metres of factory space

11. Slip is stored in 3000 litre storage vats. The slip is pumped into the casting section to fill the moulds

12. The casting section. Clay is delivered through the hoses to fill the moulds.

13. This is a battery casting rack. Where products are open on both ends they may be produced on a battery rack which requires a lot less space than the traditional method of
casting for the same production.

14. Another view of a battery casting rack

Trimming Section
15. Product is stored here awaiting fettling. Fettling involves the removal of the mould split lines or seams and removing clay imperfections on the product before firing takes
place.

16. A closer view of a kiln. The kiln measures 6m long by 1.5m wide by 2m high and weighs about 5 tons

17. City Power Increases
Summer Winter %Inc %Inc
Cents/KwH R/kVA Cents/KwH R/kVA Cons kVA
Jan-08 16.94 52.33
May-08 25.05 54.95 37.17 81.52 47.87% 5.01%
Sep-08 25.13 77.62 0.32% 41.26%
May-09 37.17 81.52 49.06 107.6 47.91% 5.02%
Sep-09 33.17 102.47 -10.76% 25.70%

18. City Power Increases
Summer Winter %Inc %Inc
Cents/KwH R/kVA Cents/KwH R/kVA Cons kVA
Jan-08 16.94 52.33
May-08 25.05 54.95 37.17 81.52 47.87% 5.01%
Sep-08 25.13 77.62 0.32% 41.26%
May-09 37.17 81.52 49.06 107.6 47.91% 5.02%
Sep-09 33.17 102.47 -10.76% 25.70%
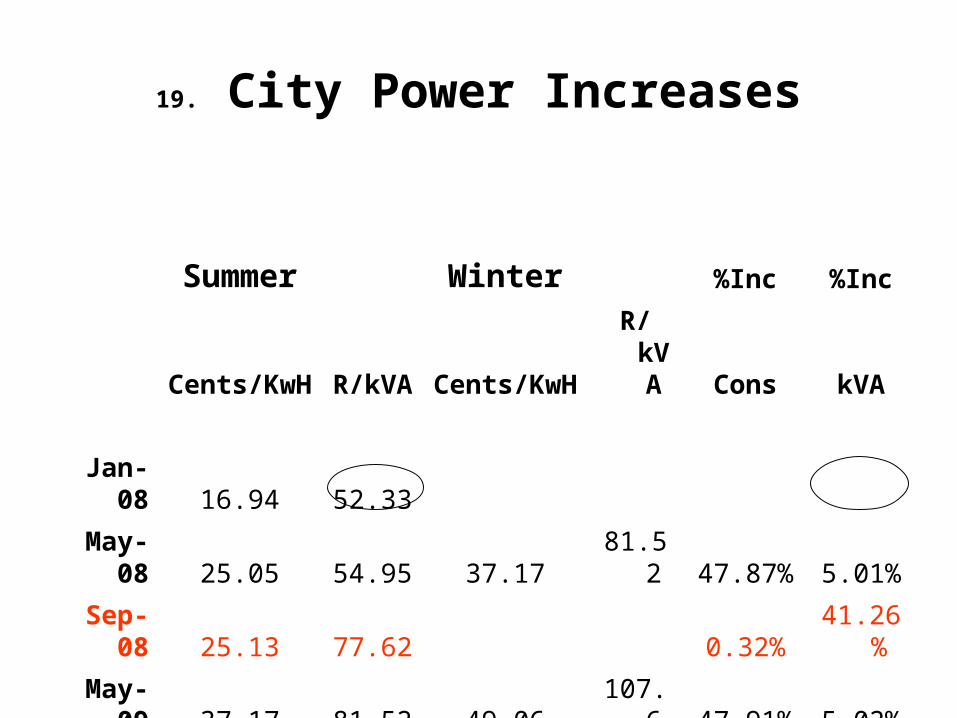
19. City Power Increases
Summer Winter %Inc %Inc
Cents/KwH R/kVA Cents/KwH R/kVA Cons kVA
Jan-08 16.94 52.33
May-08 25.05 54.95 37.17 81.52 47.87% 5.01%
Sep-08 25.13 77.62 0.32% 41.26%
May-09 37.17 81.52 49.06 107.6 47.91% 5.02%
Sep-09 33.17 102.47 -10.76% 25.70%

20. City Power Increases
Summer Winter %Inc %Inc
Cents/KwH R/kVA Cents/KwH R/kVA Cons kVA
Jan-08 16.94 52.33
May-08 25.05 54.95 37.17 81.52 47.87% 5.01%
Sep-08 25.13 77.62 0.32% 41.26%
May-09 37.17 81.52 49.06 107.6 47.91% 5.02%
Sep-09 33.17 102.47 -10.76% 25.70%

21. City Power Increases
Summer Winter %Inc %Inc
Cents/KwH R/kVA Cents/KwH R/kVA Cons kVA
Jan-08 16.94 52.33
May-08 25.05 54.95 37.17 81.52 47.87% 5.01%
Sep-08 25.13 77.62 0.32% 41.26%
May-09 37.17 81.52 49.06 107.6 47.91% 5.02%
Sep-09 33.17 102.47 -10.76% 25.70%

kVA Demand over Period of a MonthThe Maximum Demand of 560 kVA times the Rate is used to bill the
Demand Charge in any given month
kVA Demand
0
100
200
300
400
500
600
2 4 6 8 10 12 14 16 18 20 22 24 26 28 30
kVA Demand
Maximum Demand 560kVA
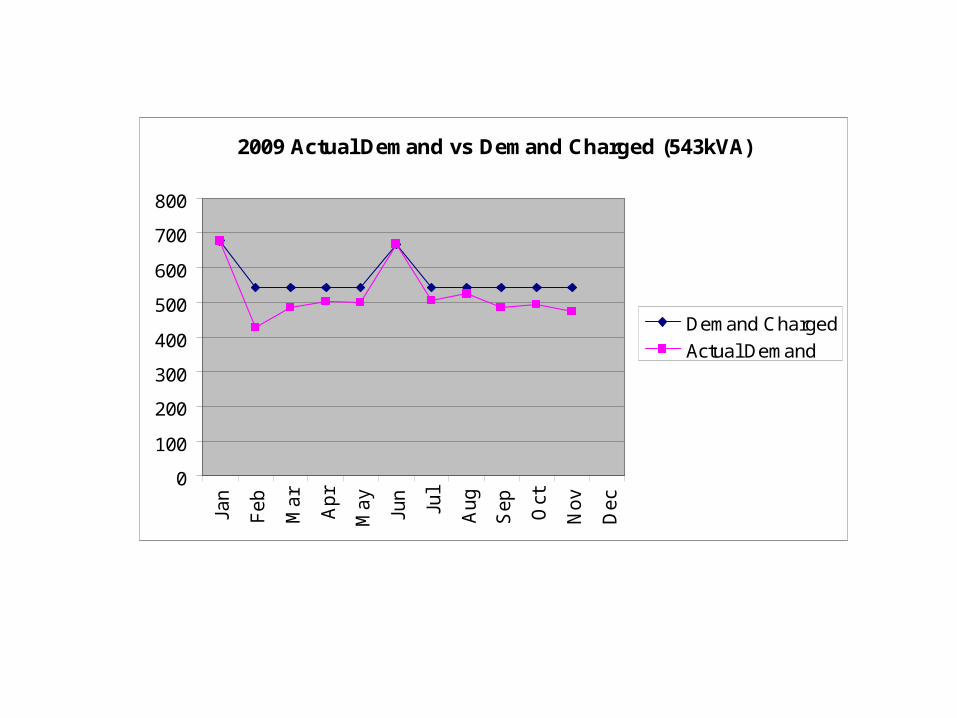
2009 Actual Demand vs Demand Charged (543kVA)
0
100
200
300
400
500
600
700
800Ja
n
Fe
b
Mar
Ap
r
May
Jun
Jul
Au
g
Se
p
Oct
Nov
Dec
Demand Charged
Actual Demand

Page 5 of City Power Tariff Booklet
• (4) Demand Tariffs
– (b) Minimum Demand Determination• The minimum demand charge payable monthly in terms of this tariff shall be
calculated using the greater of:
» i) The demand charge
» ii) A demand of 70 kVA
» iii) A demand based on the 80% average of the three highest demands recorded over the preceding 12 months.

18. Forecast cost of Electricity based on a 35% tariff hike
Effect of a 35% increase in tariffs
R 4,153,113.00
R 3,076,380.00
R 2,278,800.00
R 1,688,000.00
R 1,177,000.00
2008 2009 2010 2011 2012
An
nu
al C
ost
in
Ran
ds
Total Cost

19. Forecast Cost of Production as a result of the increase in Electricity Tariffs
(Other Costs: Wages + Plant Maintenance + Raw Materials)
R 0.00
R 2,000,000.00
R 4,000,000.00
R 6,000,000.00
R 8,000,000.00
R 10,000,000.00
R 12,000,000.00
2008 2009 2010 2011 2012
Electricity
Other Costs
Total Cost