1 the tension in standard big bang nucleosynthesis: deuterium, helium, lithium and the baryon...
Post on 21-Dec-2015
213 views
TRANSCRIPT
1
The Tension in Standard Big Bang Nucleosynthesis:
Deuterium, Helium, Lithiumand the
Baryon Density
David Tytler, David Kirkman, Nao Suzuki, Dan Lubin, Xiao-Ming Fan, Scott Burles, John O’Meara,
Tridi Jena, Pascal Paschos, Mike Norman
University of California San Diego
2
Summary of Nuclei made in Big Bang Nucleosynthesis
D/H gives highest accuracy
will get 1-5% - sufficient to reveal additional physics
Standard BBN +D/H agrees with baryon density from CMB, IGM
4He, especially 3He measurement lack desired accuracy
7Li remains a major surprise:
either 75% destroyed, or non-standard BBN6Li new observations show high abundance in many halo stars.
Not from SBBN.
Raises new questions about both 6Li and 7Li:
How made? How much made? How much destroyed?
3
Precision Measurements in Cosmology
– New issues for much of traditional spectroscopy• end-to-end checks of the experimental procedure• track implications of data and model assumptions• accurate calibrations• estimates of systematic errors• extend from internal to external errors
8
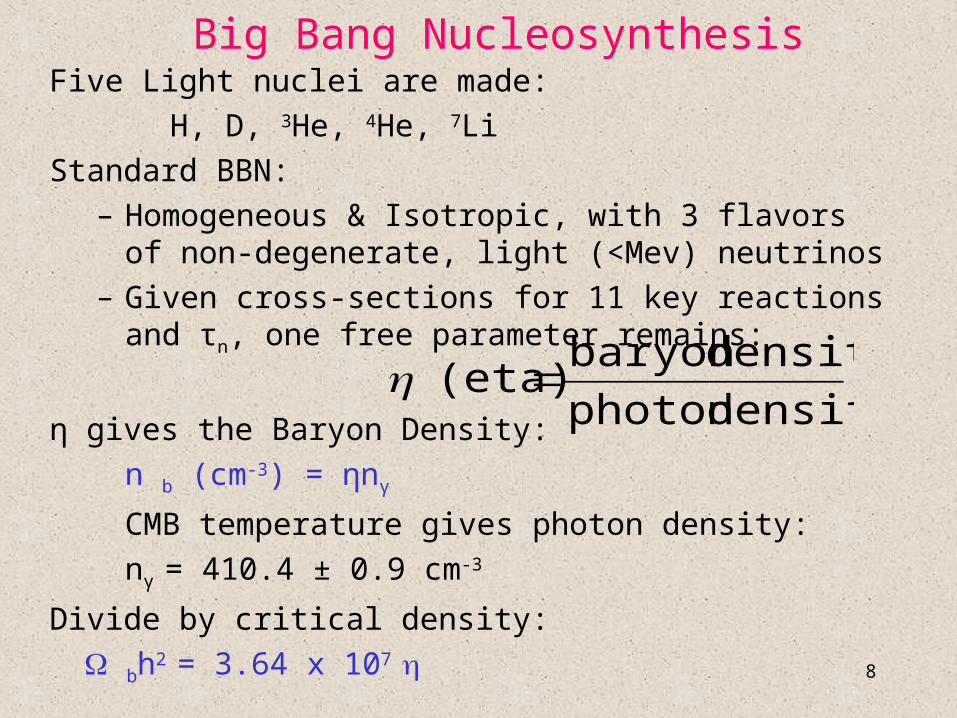
Big Bang NucleosynthesisFive Light nuclei are made:
H, D, 3He, 4He, 7Li
Standard BBN:
– Homogeneous & Isotropic, with 3 flavors of non-degenerate, light (<Mev) neutrinos
– Given cross-sections for 11 key reactions and τn, one free parameter remains:
η gives the Baryon Density:
n b (cm-3) = ηnγ
CMB temperature gives photon density:
nγ = 410.4 ± 0.9 cm-3
Divide by critical density:
bh2 = 3.64 x 10⁷
densityphoton
densitybaryon (eta) =
12
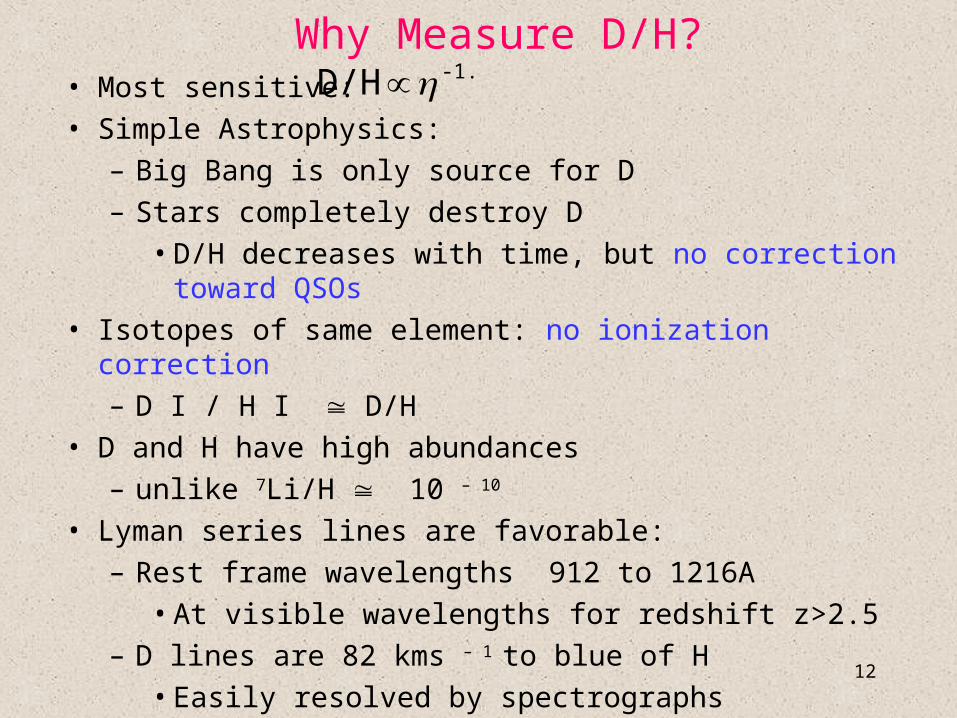
Why Measure D/H?• Most sensitive:
• Simple Astrophysics:
– Big Bang is only source for D
– Stars completely destroy D
• D/H decreases with time, but no correction toward QSOs
• Isotopes of same element: no ionization correction
– D I / H I D/H
• D and H have high abundances
– unlike 7Li/H 10 – 10
• Lyman series lines are favorable:
– Rest frame wavelengths 912 to 1216A
• At visible wavelengths for redshift z>2.5
– D lines are 82 kms – 1 to blue of H
• Easily resolved by spectrographs
-1.6D/H ∝
13
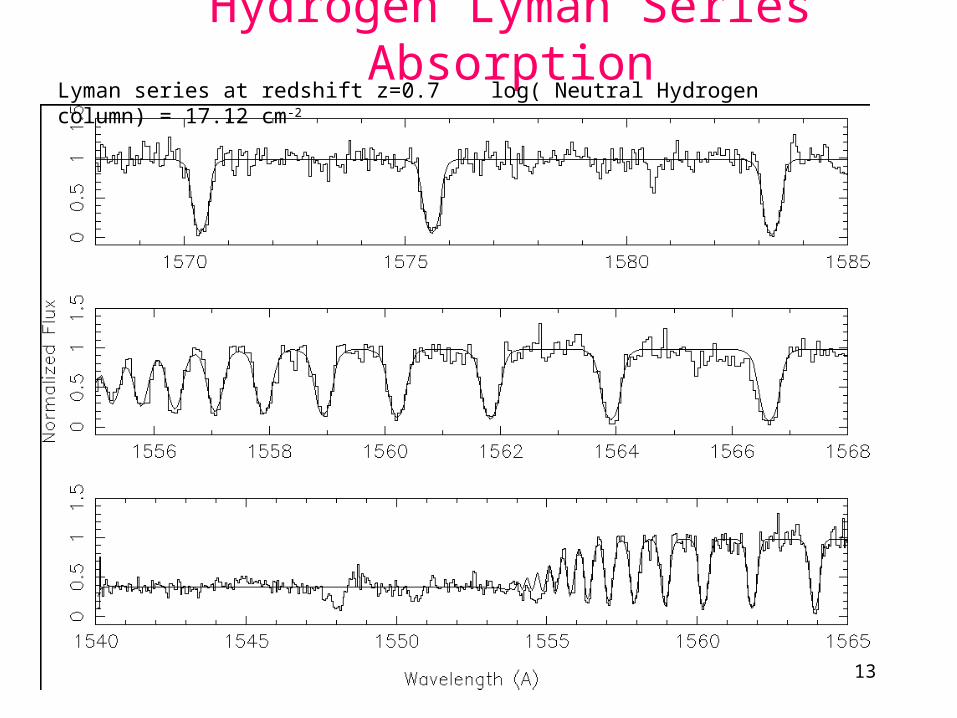
Hydrogen Lyman Series AbsorptionLyman series at redshift z=0.7 log( Neutral Hydrogen column) = 17.12 cm-2
15
Problems with QSOs
Need a lot of H to show DAbout one gas cloud per QSO at z=3
H usually absorbs most light at D wavelengthH is 30,000 times more abundant than D Doppler motions in the gas widen the H absorption linesAdditional H at similar redshifts often lie near D
wavelength
Result: only 1% of QSOs show D even fewer give required high accuracy
17
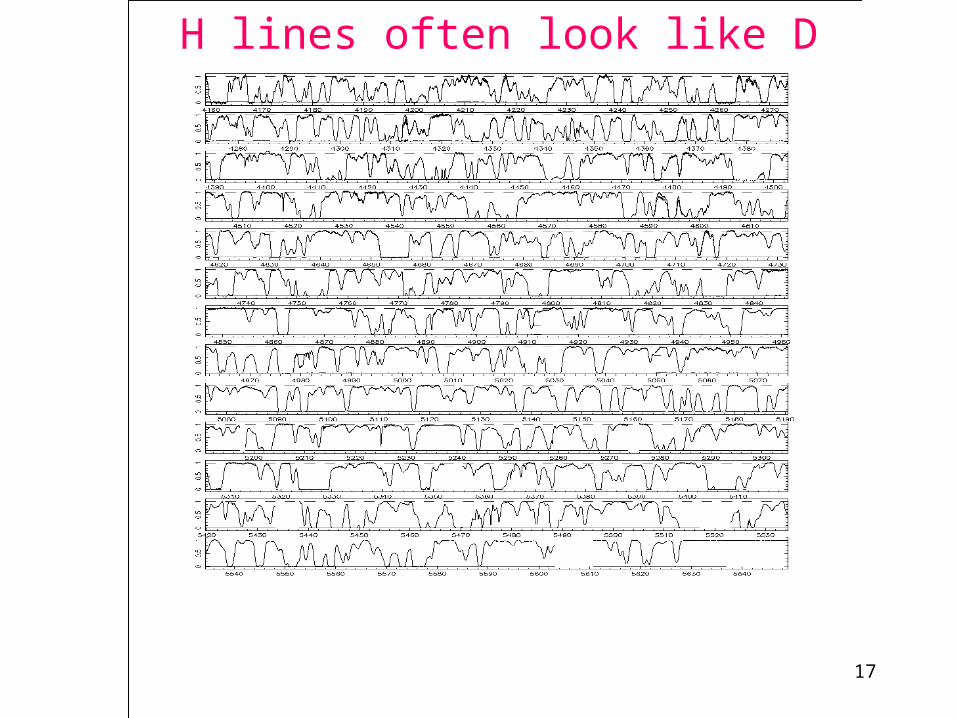
H lines often look like D
19
Is absorption D or H?
Absorption at the location of D is nearly always H
To show have D absorption
Exact velocity agreement
Exact line width agreement
No metals at D velocity (there is always H were see metals)
No simple solution using ordinary H instead of D
20
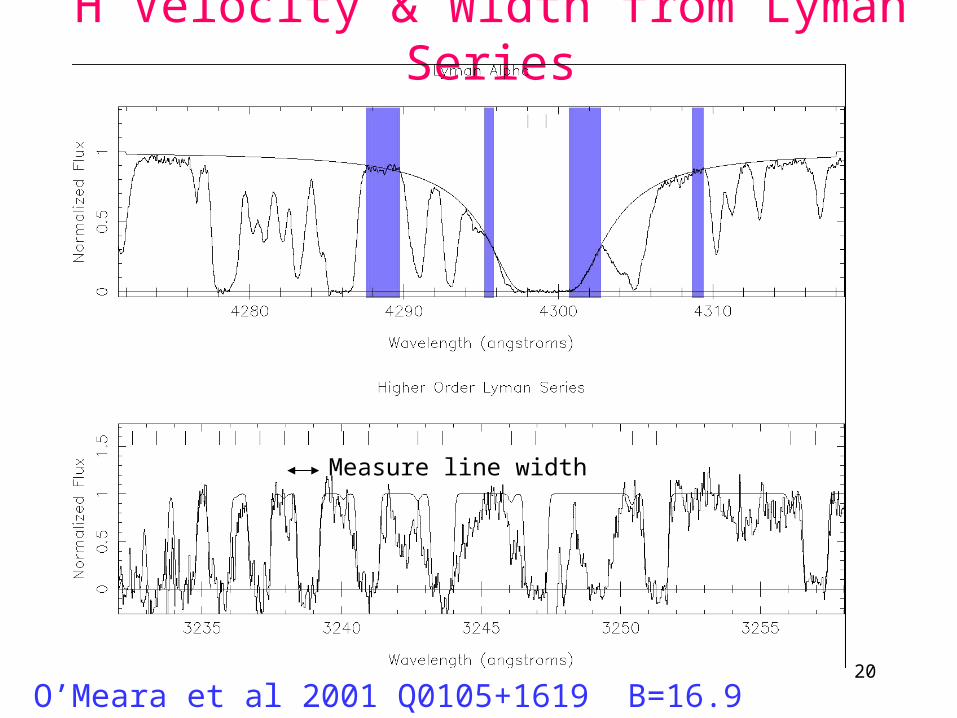
H Velocity & Width from Lyman Series
O’Meara et al 2001 Q0105+1619 B=16.9 23.6 hours HIRES
Measure line width
21
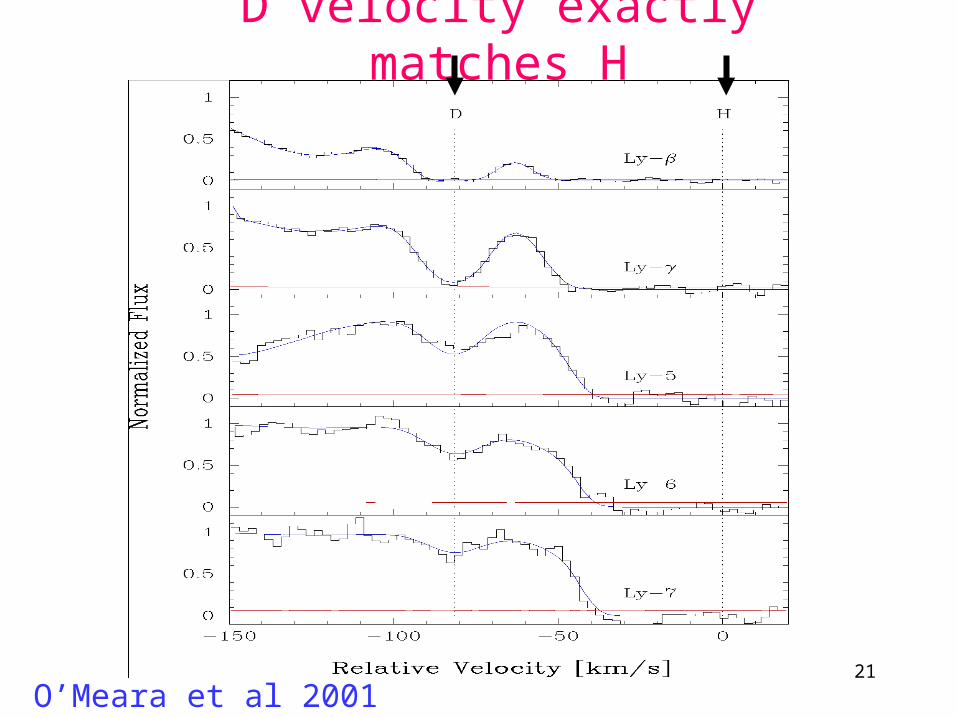
D velocity exactly matches H
O’Meara et al 2001 Q0105+1619
22
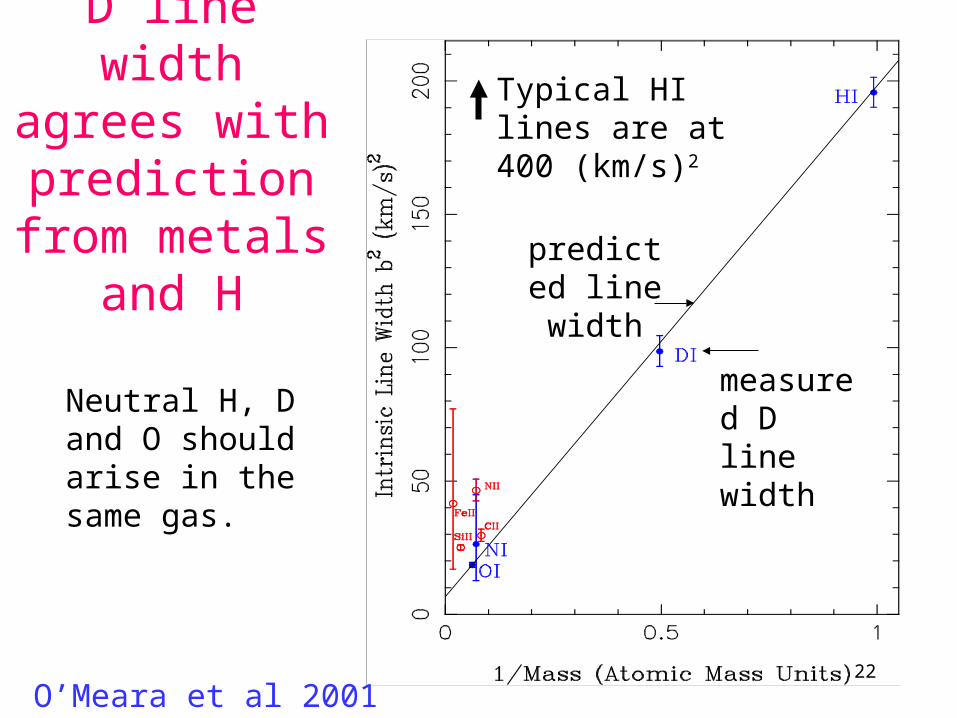
D line width agrees with
prediction from metals and H
Neutral H, D and O should arise in the same gas.
measured D line width
Typical HI lines are at 400 (km/s)2
predicted line width
O’Meara et al 2001 Q0105+1619
25
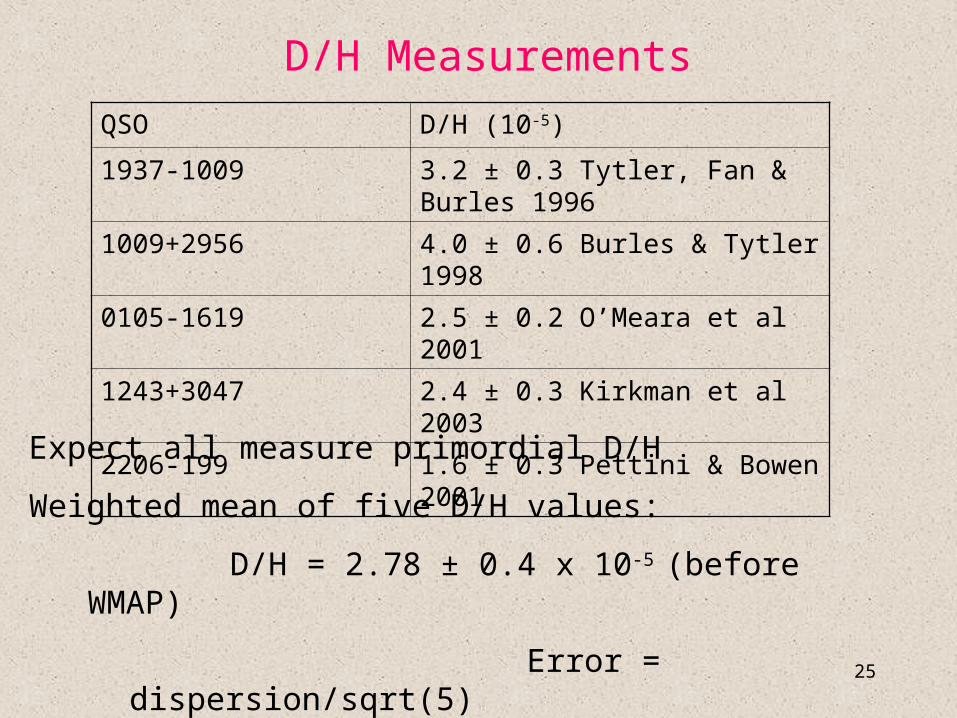
D/H Measurements
Expect all measure primordial D/H
Weighted mean of five D/H values:
D/H = 2.78 ± 0.4 x 10⁻⁵ (before WMAP)
Error = dispersion/sqrt(5)
D/H = 2.62 ± 0.19 x 10⁻⁵ WMAP 1st yr prediction
QSO D/H (10-5)
1937-1009 3.2 ± 0.3 Tytler, Fan & Burles 1996
1009+2956 4.0 ± 0.6 Burles & Tytler 1998
0105-1619 2.5 ± 0.2 O’Meara et al 2001
1243+3047 2.4 ± 0.3 Kirkman et al 2003
2206-199 1.6 ± 0.3 Pettini & Bowen 2001
28
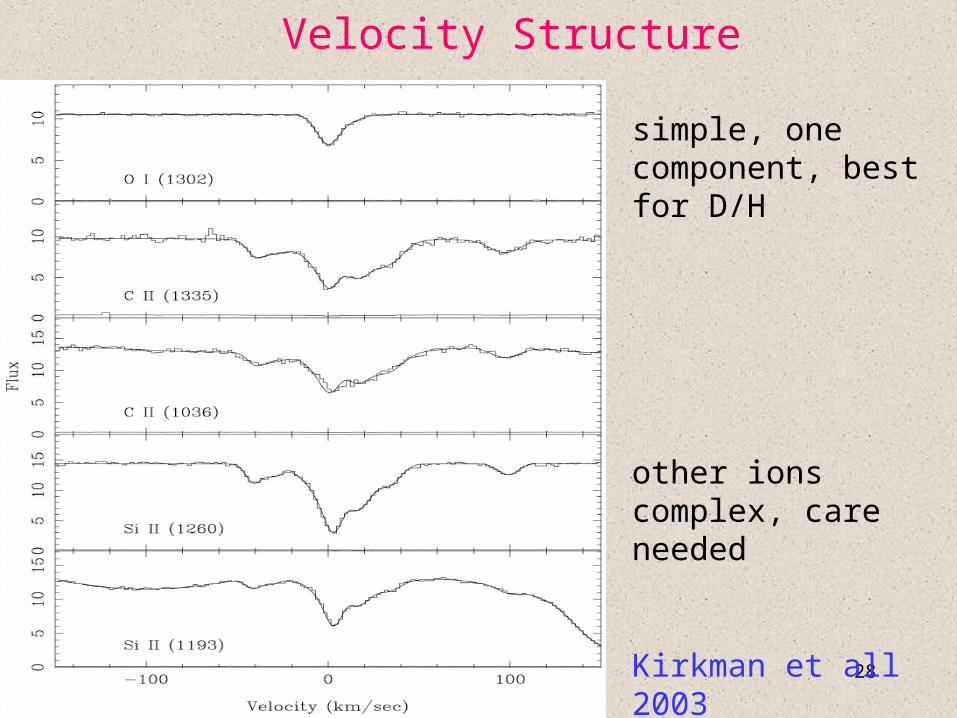
Velocity Structure
simple, one component, best for D/H
other ions complex, care needed
Kirkman et all 2003
Q1243+3047
29
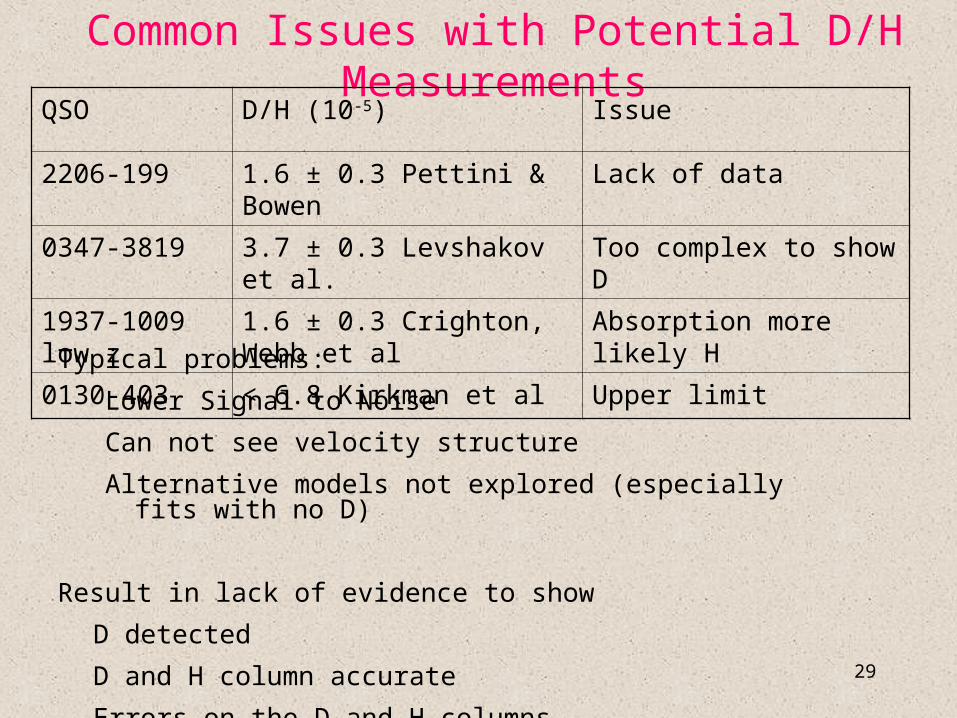
Common Issues with Potential D/H Measurements
Typical problems:
Lower Signal to Noise
Can not see velocity structure
Alternative models not explored (especially fits with no D)
Result in lack of evidence to show
D detected
D and H column accurate
Errors on the D and H columns
QSO D/H (10-5) Issue
2206-199 1.6 ± 0.3 Pettini & Bowen Lack of data
0347-3819 3.7 ± 0.3 Levshakov et al. Too complex to show D
1937-1009 low z 1.6 ± 0.3 Crighton, Webb et al Absorption more likely H
0130-403 < 6.8 Kirkman et al Upper limit
35
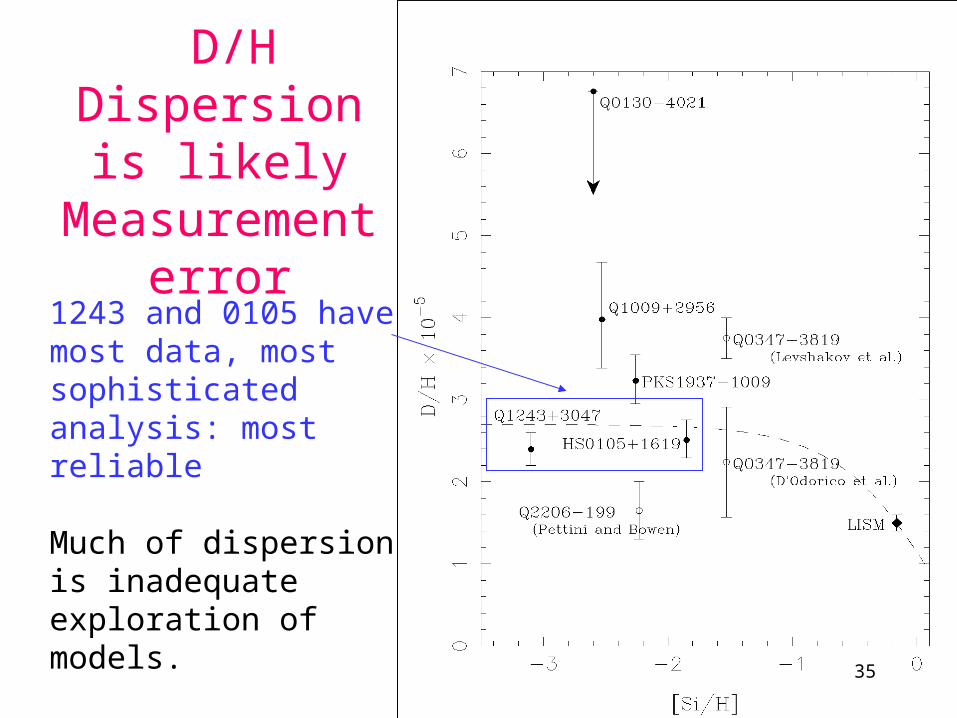
D/H Dispersion is likely
Measurement error
1243 and 0105 have most data, most sophisticated analysis: most reliable
Much of dispersion is inadequate exploration of models.
36
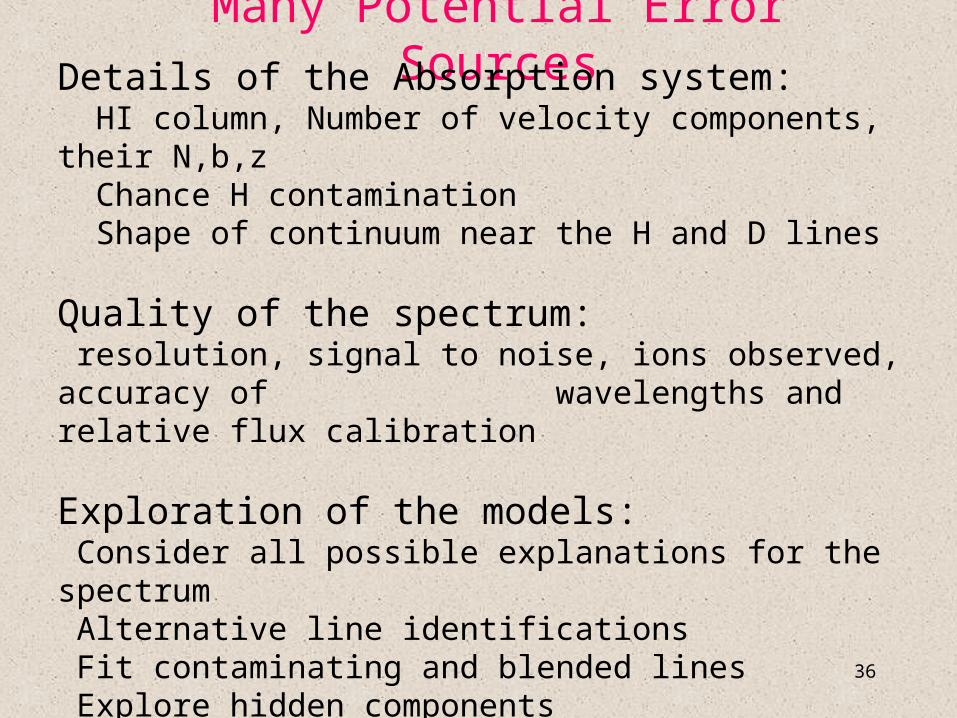
Many Potential Error SourcesDetails of the Absorption system: HI column, Number of velocity components, their N,b,z Chance H contamination Shape of continuum near the H and D lines
Quality of the spectrum: resolution, signal to noise, ions observed, accuracy of wavelengths and relative flux calibration
Exploration of the models: Consider all possible explanations for the spectrum Alternative line identifications Fit contaminating and blended lines Explore hidden components Avoid over or under-fit continuum Simultaneous fit to Lya forest, D system and continuum

37
Dominant Error is Random
The type of dominant error, and its likely sign, if any, varies from QSO to QSO.
By accident, some QSOs have favorable absorption lines.Those cases should give D/H errors < 3%
Already have a case with this accuracy on H

40
Q1243 best H column & Continuum
Kirkman et al 2003 ApJS 149, 1
Move points to optimize fit
Hydrogen absorption
10x residual
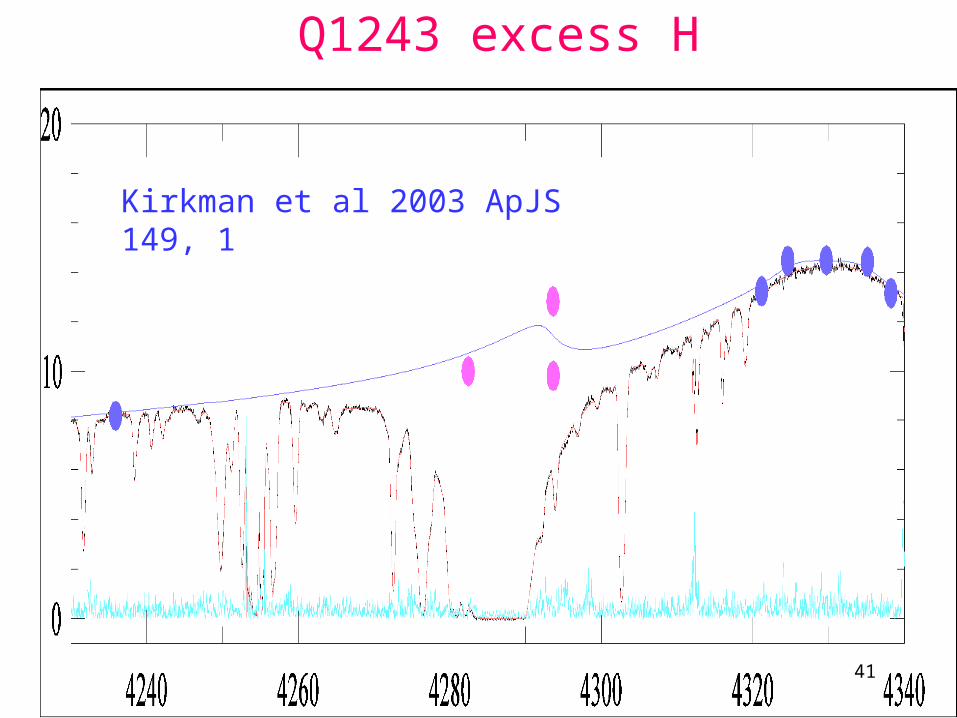
41
Q1243 excess H
Kirkman et al 2003 ApJS 149, 1
42
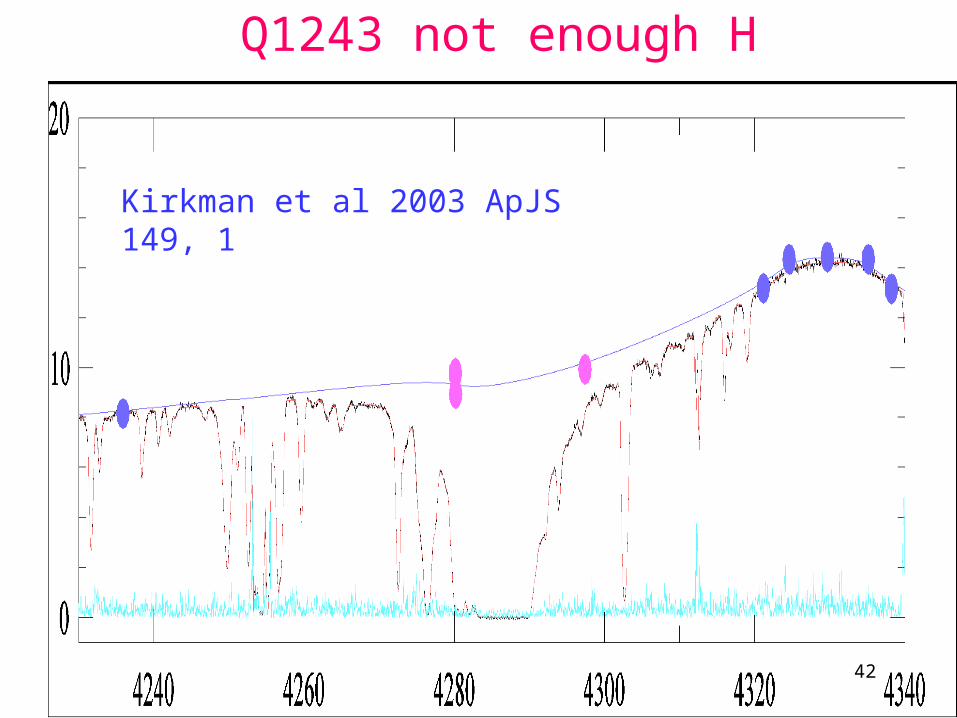
Q1243 not enough H
Kirkman et al 2003 ApJS 149, 1
43
Improved D/H
• Many suitable QSOs z>2.5 (4000 r<18.99, 8000 r<19.5)– we need only the rare QSOs giving best D/H
• Improved Signal to Noise– Key to choosing adequate set of models– New CCD detectors on HIRES
• 93% QE at 320 nm, <2 e read noise• Have demonstrated flux calibration to 1-2%• Monte Carlo modeling
– Include full range of models and parameters
• Expect to reach few percent error– 1-5% error on D/H or 0.6- 3% on η, baryon density
44
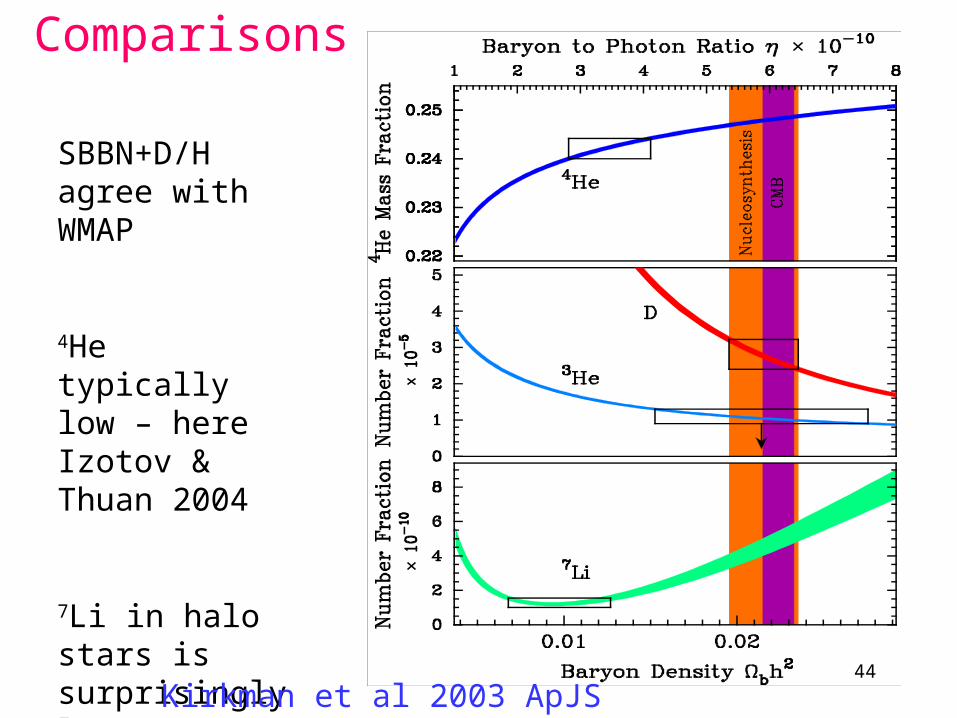
Comparisons
SBBN+D/H agree with WMAP
4He typically low – here Izotov & Thuan 2004
7Li in halo stars is surprisingly low
Kirkman et al 2003 ApJS 149, 1
45
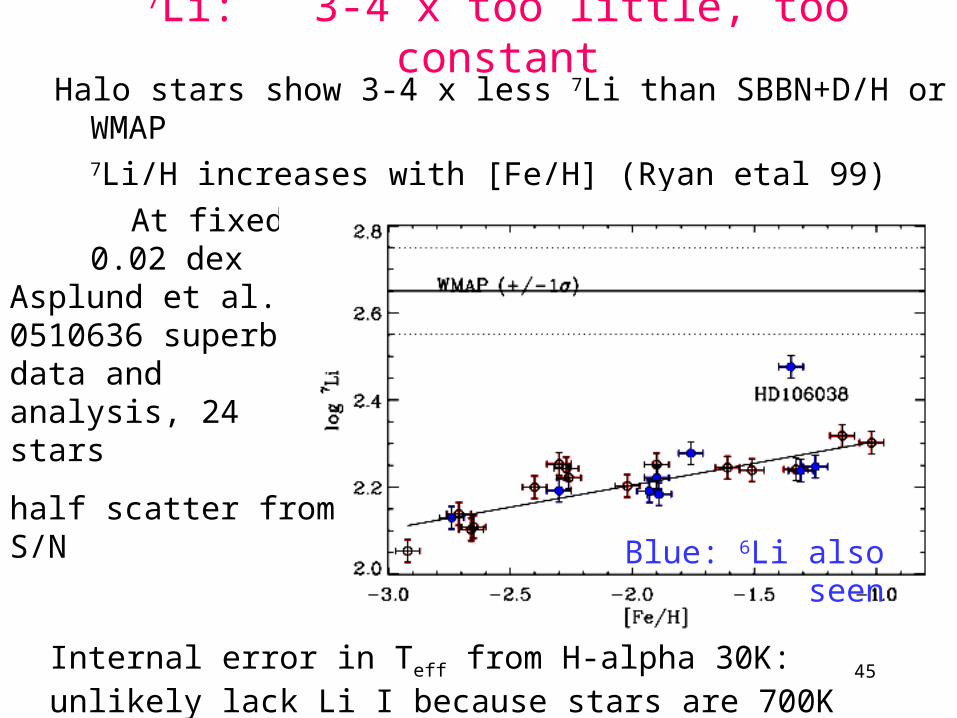
7Li: 3-4 x too little, too constantHalo stars show 3-4 x less 7Li than SBBN+D/H or WMAP
7Li/H increases with [Fe/H] (Ryan etal 99)
At fixed [Fe/H] intrinsic scatter 7Li/H < 0.02 dex
Asplund et al. 0510636 superb data and analysis, 24 stars
half scatter from S/N
Internal error in Teff from H-alpha 30K: unlikely lack Li I because stars are 700K hotter than measured
Blue: 6Li also seen
61
CMB
Can give b and η to 1% accuracy– Leaves no free parameters in SBBN– CMB bh2 value is degenerate with power spectrum slope ns
and optical depth τPowerful new test of Big Bang
– Expect (S)BBN and CMB give same ηDifferences constrain
– non-SBBN such as lepton number and neutrino energy spectrum
– Assumptions that connect BBN to CMB
62
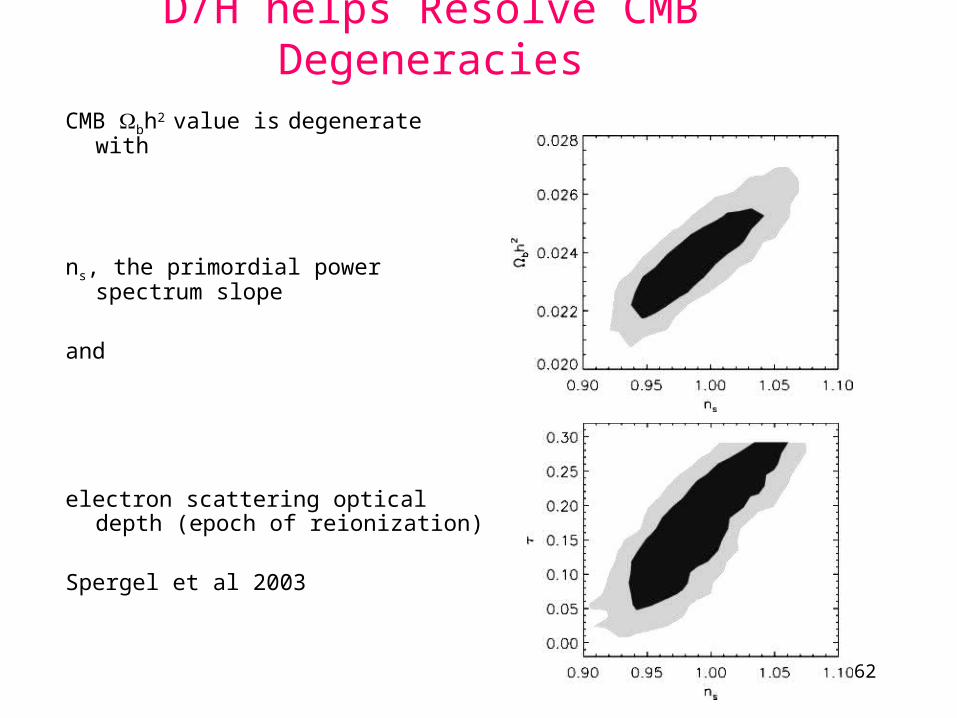
D/H helps Resolve CMB Degeneracies
CMB bh2 value is degenerate with
ns, the primordial power spectrum slope
and
electron scattering optical depth (epoch of reionization)
Spergel et al 2003
63
D is sensitive to Expansion Rate
D/H is sensitive to expansion rate as well as the baryon density
Could detect new particles, such as supersymmetric or sterile neutrinos that lack weak interactions (do not show in the Zo decay width)
A 3% D/H error, well within reach, gives effective number of neutrino species to +/- 1 (95% confidence).
68
Baryon Density from the Lyman-Alpha Forest
• Total absorption by Lyman alpha gives column of H I atoms
• Ionization correction factor total H– ionization from observed QSO and stellar UV flux– need simulations to deal with density and velocity fields
• Early resultsZhang et al, Rauch et al, Weinberg et al often needed too many baryons because … inaccurate cosmological parameters simulated spectra do not completely match data lacked corrections for box and cell size…
77
Decoding Absorption in the IGM
Precision measurement program with Mike Norman
Integrated sets of observations and simulations, Calibrated 1% error on H absorption 1.6 < z < 3.5 60+ large full hydrodynamic simulations of IGM
publicly available
We find sets of parameter values that match Lya forest within errors

79
H absorption is sensitive to many Parameters
cosmological parameters: Ho, ΩΛ Ωm Ωb, Pk (n, σ8)astrophysical parameters: UVB photoionization
heating (UVB spectrum)
We need to adjust all of these to fit the Lya Forest.
If we know all but one, can find that one, if priors well knownpotentially small error, competitive with best
81
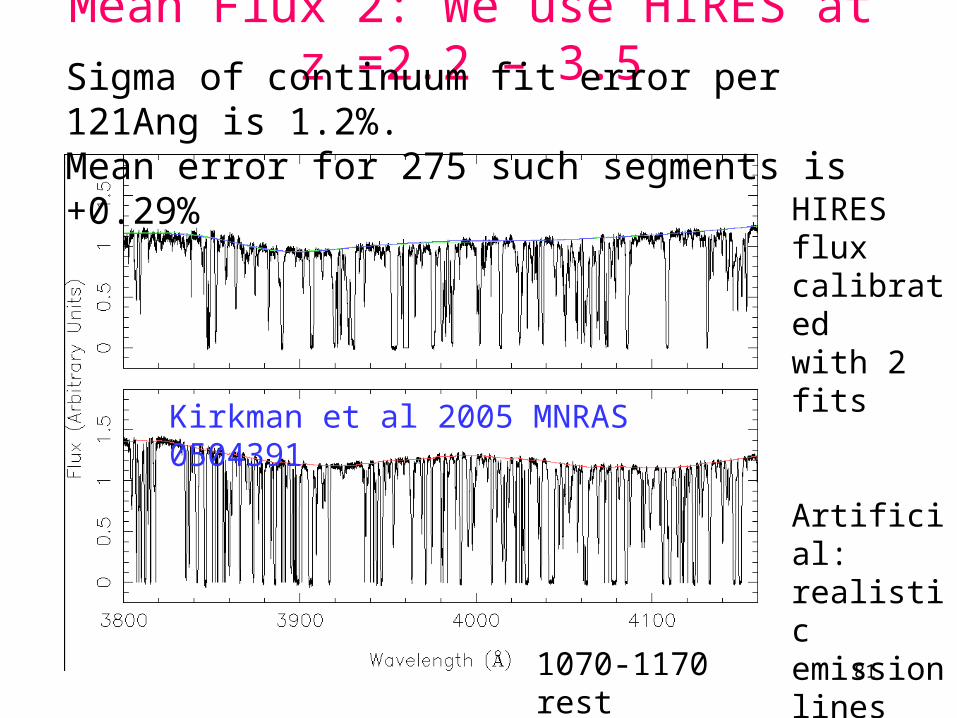
Mean Flux 2: We use HIRES at z =2.2 – 3.5Sigma of continuum fit error per 121Ang is 1.2%. Mean error for 275 such segments is +0.29%
HIRES flux calibratedwith 2 fits
Artificial:realistic emission lines and errors
1070-1170 rest
Kirkman et al 2005 MNRAS 0504391

89
60 large Hydrodynamic SimulationsCell size: 18, 37, 75, 150 kpc (comoving, h=0.71)Box size: 9, 19, 38, 77 Mpc (comoving)various: σ8, UVB intensity, heating from He II ionizationsAvailable on web: Jena et al. MN 2005 astro-ph/0412557 or email
log baryon density, z=2, from 1024 cube, 75 kpc cells

97
Three Baryon Density Measurement Agree
Baryon density measured in 3 independent ways:
D/H +SBBN (Kirkman etal 03) 0.0214 0.0020 (9%)
CMB + priors (Spergel WMAP) 0.0224 0.0010 (4%)
IGM + many priors (our work) 0.0210 0.0011 (5 30%)
±±± −
IGM result requires priors for all main cosmological and astrophysical parameters. The 5% error is from 1% error in mean flux alone. External error > 30%, eg UVB intensity.
If equivalence of values holds up:SBBN applies: no extra relativistic particlesconstancy of the baryon and photon densitiesno missing baryons at z=2
98
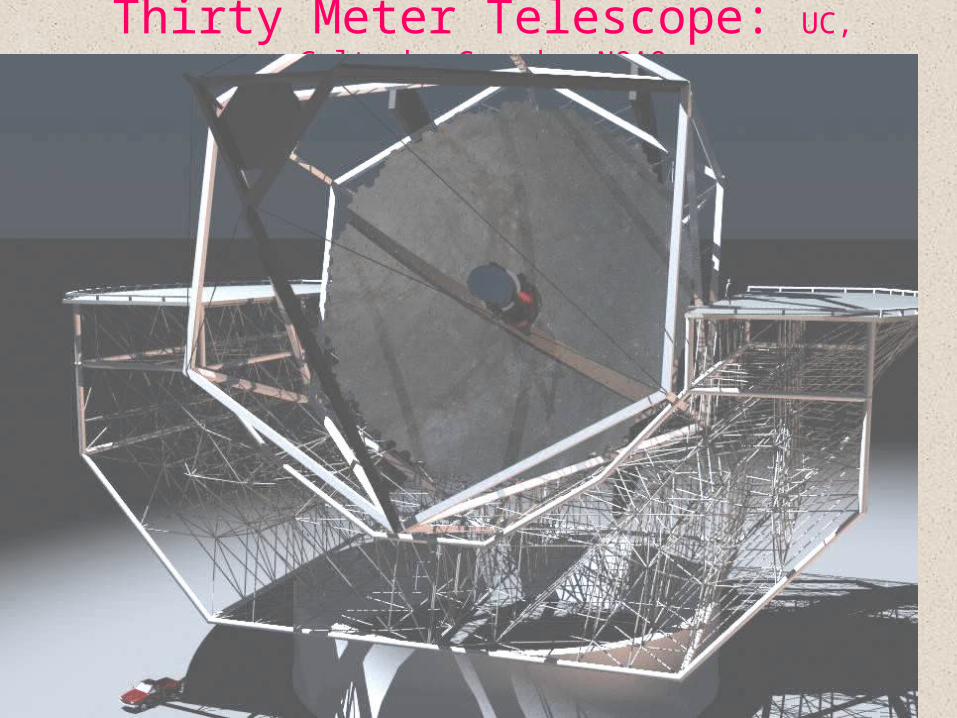
Thirty Meter Telescope: UC, Caltech, Canada, NOAO
99
END
100
Q1937-1009 z=3.2586: D is H
Crighton, Webb, Ortiz-Gil & Fernando-Soto 2004 claim low D/H
There is a solution that forces D to fit:
Requires a high log N(H)=18.25 to give low b(D)
Requires a low b(H) to allow D at -82 km/s
Exist family of solutions with lower N(H), higher b(H), no visible D.
We do not confirm their spectrum shape. They use
spectra with no flux calibration
3rd order continuum over 7 Angstroms: too much freedom
claim small absorption near 120 km/s is a damping wing
Our calibrated spectra show more absorption near 120 km/s, not damping wing.
101
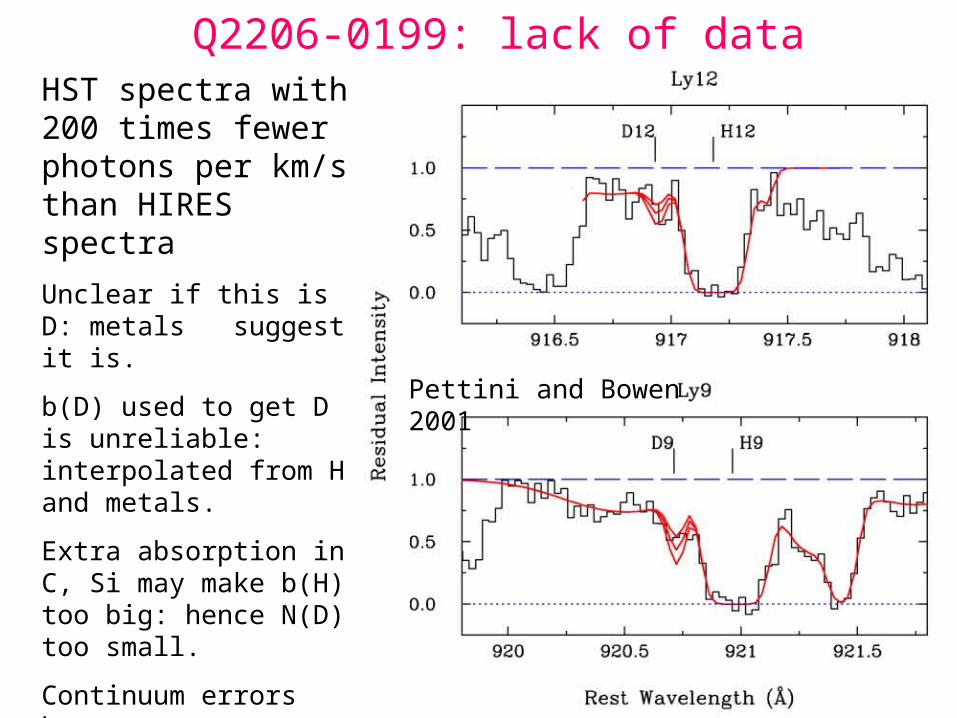
Q2206-0199: lack of dataHST spectra with 200 times fewer photons per km/s than HIRES spectra
Unclear if this is D: metals suggest it is.
b(D) used to get D is unreliable: interpolated from H and metals.
Extra absorption in C, Si may make b(H) too big: hence N(D) too small.
Continuum errors huge.
Contaminant in D-9
Allows much larger errors.
Pettini and Bowen 2001
102
Q0014+813: D is H
Songaila et al 1994 D/H < 25 x 10-5
Carswell et al 1994 D/H < 60 x 10-5
Burles, Tytler & Kirkman 1999better data D/H < 35 x 10-5
Highly unlikely to show D because:
velocity of potential D = 17 ± 2 km/s compared to H
D line width too large
distribution of absorption in velocity does not follow H
103
Q1718+4807: D is H
Webb et al 1997 possible large D/H value
Levshakov, Kegel, Takahara 1998, Tytler et al 1999: not D
Kirkman et al 2001 H spectrum shows velocity structure of H
Absorber is at wrong velocity to be D
Absorber is too wide to be D

104
Q0347-3819: too complex to see if D
D’Odorico, Dessauges-Zavadsky & Molaro 2001 claim D.
Levshakov, D’Odorico, Dessauges-Zavadsky & Molaro 2002 give higher D/H.
Absorber not well suited to D/H (Kirkman etal 2003):
D lines completely blended with H
D velocity unknown
Absorption can be H not D

105
106
107

108