1 title page 2016 - goodwood inc.€¦ · investment team continuing as portfolio manager for the...
TRANSCRIPT
GOODWOOD INC.
THE
GOODWOOD
FUNDS
2016 Annual Report Twenty-First Edition

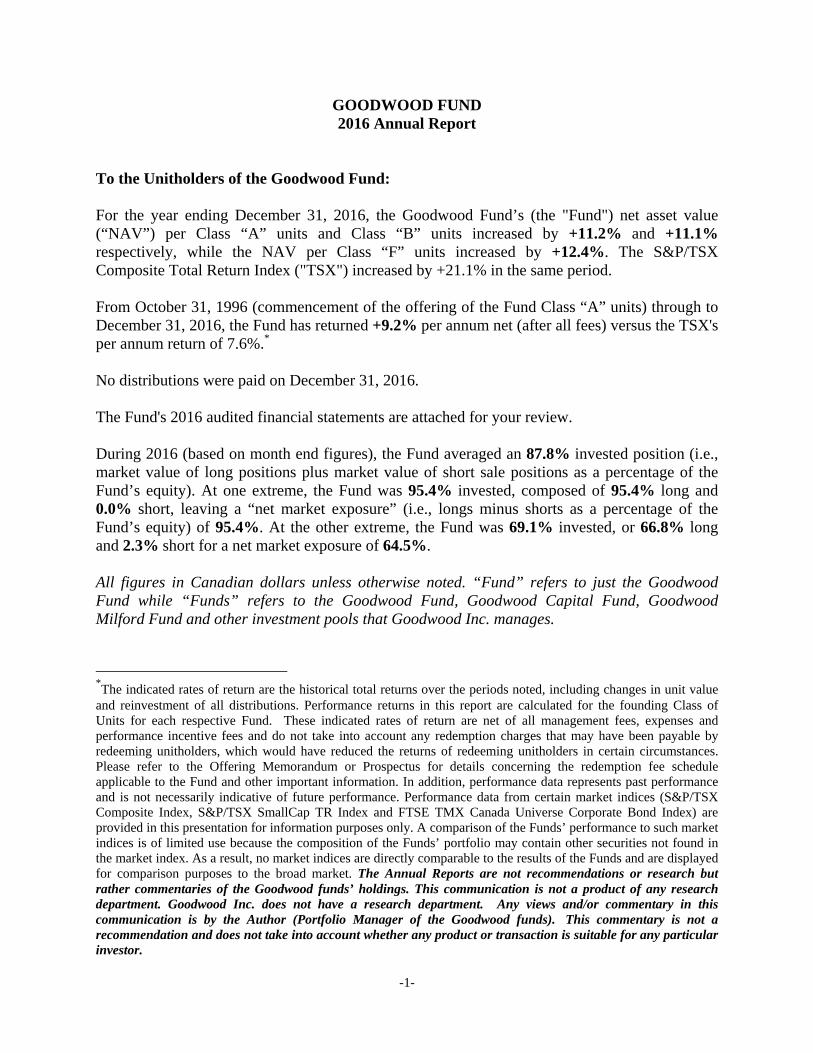
2016 Performance
11.2%12.7%
21.1%
12.3%
3.7%
0.0%
5.0%
10.0%
15.0%
20.0%
25.0%
Goodwood Fund Goodwood CapitalFund
S&P/TSX CompTRI
Goodwood MilfordFund
FTSE TMX CanadaUniverse
Corporate BondIndex
(net of fees)
Long-Term PerformanceValue of $100,000 invested since inception of Fund to December 31, 2016
$587,041
$436,104
$0
$100,000
$200,000
$300,000
$400,000
$500,000
$600,000
$700,000
GoodwoodFund
S&P / TSXComp TRI
$215,174
$275,348
$0
$100,000
$200,000
$300,000
$400,000
$500,000
$600,000
GoodwoodCapital Fund
S&P / TSXComp TRI
$443,189
$185,961
$0
$100,000
$200,000
$300,000
$400,000
$500,000
$600,000
GoodwoodMilford Fund
S&P / TSXComp TRI
CAGR:
Description:
Inception:
4.6%9.2% 14.5%
October 26, 1996 January 1, 2006December 23, 1999
Goodwood Fund is a long/short fundamental value oriented fund that uses a bottom-up, company specific approach to long-term
investing.
Goodwood Milford Fund uses a fundamental bottom-up, company specific focus with a strategy of
combining higher yielding corporate bonds and long/short
equity positions.
Goodwood Capital Fund is a long-only fundamental value oriented mutual fund that uses a bottom-up, company specific approach to
long-term investing.
FundSERV: Class B – GWD022Class F – GWD222
Class A – GWD001Class F – GWD004
Class A – GWD025 (Q2’17)Class F – GWD220(Q2’17)
Class A D– GWD501 (Q2’17)Class F D– GWD505 (Q2’17)
Goodwood Fund Goodwood Capital Fund Goodwood Milford Fund
Source: Goodwood Inc., Bloomberg, BMO Capital Markets. Past performance may not be repeated. Performance data from certain S&P/TSX Composite TR Index, S&P/TSX SmallCap TR Index and FTSE TMX Canada Universe Corporate Bond Index are provided in this report for information purposes only. comparison of the Fund’s performance to such market indices is of limited use because the composition of the Fund’s portfolio may contain other securities not found in the market index. As a result, no market indices are directly comparable to the results of the Fund. See annual report enclosed for full disclosure details.

-i-
GOODWOOD INC. 2016 Annual Letter
I am very pleased with our 2016 investment returns and proud to submit the 21st edition of the Goodwood Annual Report. I would like to thank all of our co-investors for their continued support and confidence. Goodwood has expanded as an organization; we have grown in assets and complexity with the addition of new investment fund strategies and individually managed segregated account offerings. The management team continues to provide the requisite oversight and guidance to ensure Goodwood successfully manages growth and continues to deliver on our long-term investment mandates. Our objective is to continue to generate above average, risk-adjusted, long-term rates-of-return by investing in undervalued securities at all levels of the capital structure. As significant investors in our own strategies, this unique and long-term perspective aligns our interests and motivates our actions. Net Investment Returns in 2016 and Annualized Since Inception 2016 Since Inception
Goodwood Fund +11.2% +9.2% (1996) Goodwood Capital Fund +12.7% +4.6% (1999) Goodwood Milford Fund +12.3% +14.5% (2006) Goodwood SPValue Fund +71.5% +20.9% (2014)
Investment Strategy Overview Peter Puccetti and Chris Currie have provided their 2016 investment summaries and outlooks for 2017 herein. Below, I wanted to outline the various investment fund strategies that are being provided at Goodwood. The Goodwood Fund’s investment objective is to maximize long term return through the purchase and short sale of equity securities based on a bottom-up, company specific approach. The portfolio is relatively concentrated with 8-10 core positions typically representing over 75% of the portfolio. The value-oriented, “special situations” stock picking strategy allows Peter Puccetti to focus on a limited number of ideas believed to offer superior potential and build strong relationships with senior management of investee companies. The Goodwood Capital Fund has a similar objective as the Goodwood Fund but is not permitted to enter into short sales. The Goodwood Milford Fund is our fixed-income solution. This Fund utilizes a core strategy of investing in corporate bonds specifically selected to provide higher coupon income and capital gains from credit upgrades and other credit enhancing events. Chris Currie uses a fundamental investment approach to provide above average risk-adjusted returns with low monthly volatility. To mitigate

-ii-
risk and enhance return, the Goodwood Milford Fund may invest a small portion of its assets in long/short equity investments. The Fund pays quarterly cash distributions; the 2017 starting yield is 4% per annum. The Goodwood SPValue Fund’s objective is to pursue activist and other unique investment opportunities. The investment objective is to generate long-term total returns through investments in companies deemed by us to be undervalued and where our active involvement via provision of capital, improvements in corporate governance and management and, strategic insight may positively influence or skew the outcome in our favour (see Polaris Infrastructure commentary within Peter’s 2016 Goodwood Fund Annual Report). We open and close the Goodwood SPValue Fund based on opportunities and their respective capital needs. Please contact Peter or myself if you would like to invest in our next Goodwood SPValue Fund opportunity. Investment Operations As a reminder, we publish regular updates including a quarterly fixed-income review. The goal of our regular correspondence is to communicate the performance results of our strategies and to inform our unitholders of the Funds’ activities and ideas. We subscribe to the notion that it is in the collective interest of the Goodwood Funds to have unitholders better understand the companies the Funds’ hold and the rationale for these investments. If you are not receiving our regular communications and would like to, please call or email directly. Respectfully submitted, Curt Cumming President Goodwood Inc. (416) 203-2022 [email protected] March 30, 2017

TABLE OF CONTENTS
PART ONE . . . . . . . . . . . . . . . . . . . . . . . . . . . . . . . . . . . . .GOODWOOD FUND 2016 Annual Report
PART TWO . . . . . . . . . . . . . . . . . . . . . . . . . . GOODWOOD CAPITAL FUND 2016 Annual Report PART THREE . . . . . . . . . . . . . . . . . . . . . . . . . GOODWOOD MILFORD FUND 2016 Annual Report
PART FOUR . . . . . . . . . . . . . . . . . . . . . . . . . . . . . . GOODWOOD FUND 2016 Financial Statements
PART FIVE . . . . . . . . . . . . . . . . . . . . . . .GOODWOOD CAPITAL FUND 2016 Financial Statements PART SIX . . . . . . . . . . . . . . . . . . . . . . . GOODWOOD MILFORD FUND 2016 Financial Statements
The information contained herein is drawn from sources believed to be reliable but the accuracy or completeness of the information is not guaranteed. The opinions expressed are based upon our analysis and interpretation of these particulars and are not to be construed as a solicitation or an offer to buy or sell the securities mentioned herein. The Goodwood Funds and/or the principals, officers, directors, employees of Goodwood Inc. may have a position in the securities mentioned herein and may make purchase and/or sales of these securities from time to time. Our valuations may contain forward-looking information which is subject to change. Actual results or performance may differ materially from those expressed or implied in this document as a result of unforeseen events and their effects on our valuations and opinions. Principals of Goodwood Inc. may, from time to time, accept officer positions and/or directorships from companies unrelated to Goodwood Inc. In this circumstance, such companies would be considered under relevant securities law to be “related” or "connected issuers" to Goodwood Inc. or to Funds managed by Goodwood Inc. Currently, The Westaim Corporation is considered a "connected issuers" in relation to Goodwood Inc. and/or the Funds managed by Goodwood Inc. Furthermore, Goodwood Inc., or an affiliate of Goodwood Inc., may provide services to and receive compensation from issuers in which the Funds are invested. Goodwood Management Services Ltd., an affiliate of Goodwood Inc., entered into a 5 year Consulting Agreement with Polaris Infrastructure Inc. (formerly Ram Power Corp) dated May 13, 2015. Goodwood Inc. has adopted appropriate policies and procedures to address conflicts of interest with respect to connected issuers. The Offering Memorandum (Goodwood Fund & Goodwood Milford Fund) and Prospectus (Goodwood Capital Fund) contain important information about the funds, including management fees, other charges and expenses and should be read carefully before investing. Fund performance is not guaranteed; net asset values change frequently and past performance is not indicative of future performance and may not be repeated. Performance returns in this report are calculated for the founding Class of Units for each respective Fund - Goodwood Fund Class A Units, Goodwood Capital Fund Class A Units and Goodwood Milford Fund Class S. The returns and are net of all management fees, expenses and incentive performance fees. The performance fee for Goodwood Fund Class A units is 20% of positive returns over a 10% hurdle. Therefore in periods of positive performance the Class A is subject to lower performance fees. Currently only the Class B and Class F units of the Goodwood Fund are offered. Goodwood Fund Class A and Goodwood Capital Fund Class A charge a 1.9% annual management fee and Goodwood Milford Fund Class S charges a 1.5% annual management fee, other classes may charge different fees and therefore returns between the different classes may vary. Goodwood Inc. became the Investment Manager of the Goodwood Milford Fund on October 1, 2013 and Chris Currie, CFA joined Goodwood Inc.’s investment team continuing as portfolio manager for the Fund. There has been no change to the investment strategy of the Fund.
-1-
GOODWOOD FUND 2016 Annual Report
To the Unitholders of the Goodwood Fund: For the year ending December 31, 2016, the Goodwood Fund’s (the "Fund") net asset value (“NAV”) per Class “A” units and Class “B” units increased by +11.2% and +11.1% respectively, while the NAV per Class “F” units increased by +12.4%. The S&P/TSX Composite Total Return Index ("TSX") increased by +21.1% in the same period. From October 31, 1996 (commencement of the offering of the Fund Class “A” units) through to December 31, 2016, the Fund has returned +9.2% per annum net (after all fees) versus the TSX's per annum return of 7.6%.* No distributions were paid on December 31, 2016. The Fund's 2016 audited financial statements are attached for your review. During 2016 (based on month end figures), the Fund averaged an 87.8% invested position (i.e., market value of long positions plus market value of short sale positions as a percentage of the Fund’s equity). At one extreme, the Fund was 95.4% invested, composed of 95.4% long and 0.0% short, leaving a “net market exposure” (i.e., longs minus shorts as a percentage of the Fund’s equity) of 95.4%. At the other extreme, the Fund was 69.1% invested, or 66.8% long and 2.3% short for a net market exposure of 64.5%. All figures in Canadian dollars unless otherwise noted. “Fund” refers to just the Goodwood Fund while “Funds” refers to the Goodwood Fund, Goodwood Capital Fund, Goodwood Milford Fund and other investment pools that Goodwood Inc. manages.
*The indicated rates of return are the historical total returns over the periods noted, including changes in unit value and reinvestment of all distributions. Performance returns in this report are calculated for the founding Class of Units for each respective Fund. These indicated rates of return are net of all management fees, expenses and performance incentive fees and do not take into account any redemption charges that may have been payable by redeeming unitholders, which would have reduced the returns of redeeming unitholders in certain circumstances. Please refer to the Offering Memorandum or Prospectus for details concerning the redemption fee schedule applicable to the Fund and other important information. In addition, performance data represents past performance and is not necessarily indicative of future performance. Performance data from certain market indices (S&P/TSX Composite Index, S&P/TSX SmallCap TR Index and FTSE TMX Canada Universe Corporate Bond Index) are provided in this presentation for information purposes only. A comparison of the Funds’ performance to such market indices is of limited use because the composition of the Funds’ portfolio may contain other securities not found in the market index. As a result, no market indices are directly comparable to the results of the Funds and are displayed for comparison purposes to the broad market. The Annual Reports are not recommendations or research but rather commentaries of the Goodwood funds’ holdings. This communication is not a product of any research department. Goodwood Inc. does not have a research department. Any views and/or commentary in this communication is by the Author (Portfolio Manager of the Goodwood funds). This commentary is not a recommendation and does not take into account whether any product or transaction is suitable for any particular investor.

-2-
Goodwood Fund Position Commentary
2016 was a year with some notably positive developments and attendant security performance, for example - Polaris Infrastructure Inc. ("Polaris") common shares, Great Canadian Gaming Corporation ("Great Canadian") common shares, Centric Health Corporation 6.75% 10/31/2017 Notes and BSM Technologies Inc. ("BSM", our old Webtech Wireless Inc. position which merged into BSM) common stock. And, some negative developments such as Merus Labs International Inc. and Emergent Capital Inc. (“Emergent”) common stock (though the Fund’s position in the Emergent 15% 09/14/2018 senior secured notes worked out reasonably well as a short term deployment of excess capital) which held back our overall annual return. As the largest unitholders of the Goodwood Fund, we naturally have much incentive and desire to see the potential of what we currently own surface fully and to not have the overall performance held back by negative contributors.
Polaris Infrastructure Inc. (20.8% Current Fund Weighting)
Polaris is a Toronto-based company engaged in the operation, acquisition and development of renewable energy projects in Latin America. Currently, the Company operates a 72 Megawatt ("MW") capacity geothermal project located in San Jacinto, Nicaragua.
Polaris common stock rallied in the back half of 2016 to a high of $18.59 per share having started the year around $8.00 per share, though ended the year at $15.29 per share. Solid execution by the new management team and, in particular, an effective drilling program which was financed by the capital we invested through the 2015 recapitalization (along with a number of co-investors we helped bring to the table) provided the impetus for the rally. But, we see much

-3-
more coming and we believe the stock will, over the next year to year-and-a-half, grow to a $25 to $30 per share intrinsic value. Given our large weighting in Polaris this would obviously have a material beneficial impact on the Fund's net asset value ("NAV") per unit.
Polaris is on a discernible path to get to a net 72 MW production level from circa net 51 MW when we put capital into the recapitalization (72 MW is the size of the current long term power purchase agreement or "PPA" and is the capacity of the two Fuji turbines). We believe the 72 MW net level is likely to occur at some point in mid-to-late 2018 pursuant to further drilling and the installation of an 8 MW to 10 MW binary unit for US$30 million. Further, it seems there is an opportunity for Polaris in future years to deliver and get paid for more than 72 MW from its San Jacinto plant as Nicaragua would welcome the additional clean and affordable power and as the San Jacinto site seems quite capable of delivering more MW's if dollars are wisely invested. [Note that Nicaragua's economy is estimated to be growing at a 4.5% annual rate and that electricity usage per capita is growing even faster. Also, note that Nicaragua does not have many other clean, cost-effective and baseload power sources and continues to burn imported dirty bunker fuel for a large share of its electricity production].
Canadian renewable power publicly-traded comparables are trading for between 9X and 16X the next twelve months' EV/EBITDA but these are companies that hold diversified portfolios of renewable power assets in more familiar jurisdictions than Nicaragua. Clearly, Polaris, with its single San Jacinto operating asset does not deserve the same valuation multiple (NB: Polaris as well holds majority interest in the Casita geothermal project also in Nicaragua and potentially larger than San Jacinto but it is at an early development stage). It is difficult to ascertain what EV/EBITDA multiple Polaris should trade for but our sense would be something in the 7X to 9X range. Ignoring the beneficial impact of another year of the 3% per annum price escalator embedded in Polaris' PPA, we estimate that a full year at 72 MW net would generate approximately US$61 million in EBITDA. At this level of EBITDA and using the current balance sheet metrics (i.e., the December 31, 2016 figures) of US$45.7 million in corporate cash (not including restricted cash), US$181.8 million in debt and the current share price of approximately $14.20 implies that the stock is trading at a 4.9X EV/EBITDA multiple of 2018 EBITDA exit rate. And, if the stock were to trade for say 8X EV/EBITDA using these figures, the stock would be at $30.19 per share or 113% higher than current share price.
While we wait for Polaris to deliver on this potential we take comfort that we are being paid a steadily-increasing dividend. Currently, the dividend is US$0.48 per share per annum or about a 4.5% dividend yield on the current share price. The fourth quarter 2016 dividend of US$0.12 per share represented an increase of 9% versus the third quarter 2016 dividend and is about 20% higher than the initial dividend from the March 2016 quarter. Management and the Board plan to continue to increase the dividend and are targeting a 40% to 60% payout ratio.
Importantly, Polaris now has a number of brokerage analysts covering the Company from a research point of view. The analysts' target prices range from $18.50 per share at the low end to $30 per share at the upper end. We believe this target price range will shift higher as Polaris delivers further results in 2017 and with the 2018 commencement of the binary unit. How the analysts will value Casita, if at all, is uncertain and will be a function of the capital required to bring Casita into production, the timelines involved, the composition and nature of available

-4-
project debt, the PPA economics and tenure awarded Casita and, various other factors. Clearly, a development stage geothermal asset's future value should be heavily discounted to factor in execution risk but we have much confidence in the CEO, Marc Murnaghan, to find a safe path forward to bringing this potentially valuable asset online.
Another area of potential value addition is if Polaris can intelligently diversify its portfolio with other infrastructure assets. We believe that, well-purchased, solid operating assets which contribute further to Polaris' free cash flow and diversify its asset base will ultimately result in less of a discount being accorded to Polaris' trading valuation. Depending on the size, quality, jurisdiction, inherited partners and purchase price, such a transaction or transactions could result in several additional multiple points of EV/EBITDA being priced into Polaris and effectively pay for itself rapidly (in a capital markets manner). Our sense is that Polaris is evaluating numerous opportunities in this regard.
Eventually, we believe Polaris itself will become an M&A target as larger infrastructure players, many of whom have been active in Latin America for many years but for whom Nicaragua is far off the current radar, start noticing the cash flows and inexpensive valuation and get increasingly comfortable with Nicaragua's desire to continue attracting foreign investment and progress economically. Certainly, a well-orchestrated asset diversification program will hasten this evolving reality for Polaris.
Great Canadian Gaming Corporation (12.3% Current Fund Weighting)
Great Canadian operates gaming, entertainment and hospitality facilities in British Columbia, Ontario, New Brunswick, Nova Scotia and Washington State. As at December 31, 2016, the Company’s twenty gaming properties consisted of twelve casinos, including a Four Diamond

-5-
resort hotel in Richmond, British Columbia and a four star hotel in Moncton, New Brunswick, four horse racetrack casinos, three community gaming centres and one commercial bingo hall. On January 11, 2017, the Company opened the new Shorelines Casino Belleville in Ontario - so this is the Company's 21st property and it was opened exactly one year after Great Canadian acquired the Ontario Lottery and Gaming Corporation’s (“OLG”) East Gaming Bundle. Shorelines Casino Belleville is the first such property opened in Ontario since 2006. In Canada, the Company operates its casinos both within managed markets that feature high barriers to entry and under agreements as partners with provincial lottery corporations. As at December 31, 2016, the Company had approximately 5,600 employees.
Great Canadian stock did well in 2016 rallying from approximately $15 per share to roughly $25 per share. And, the Company has resumed its voracious appetite for its own stock as on March 13, 2017 Great Canadian announced its intention to renew a normal course issuer bid for up to 3,995,203 of its common shares, representing approximately 10% of the Company’s common shares in the public float (as of March 8, 2017, the Company had 61,466,930 common shares outstanding in total). During the prior twelve months under its previous normal course issuer bid, Great Canadian had purchased and cancelled 4,668,925 common shares at a volume weighted average price of $17.57 per share. This continues a pattern of substantial share repurchases that Great Canadian has pursued over the last several years (for example, 5.5 million shares were repurchased during 2015) which we believe has had a materially positive effect on the value per share of those shareholders who remain (such as the Goodwood Fund). We think Board member (and CEO's father) Neil Baker's November 17, 2016 sale of roughly three quarters of his previously 18% position was definitely concerning but, with a much lower cost and given estate planning considerations and the size of what this stake had grown to become, perhaps then is understandable. We continue to have confidence that Rod Baker, the CEO, remains very committed to Great Canadian and that he will persist with meaningful share repurchases as a more tax-effective method of returning cash to shareholders (versus a dividend) and that these share repurchases will result in the remaining shareholders benefitting proportionally more in the future should a value-maximization event occur. In the interim we believe Rod and the senior management team will continue to be very attuned to minimizing operating costs and to smart and judicious capital deployment whether that's through share buybacks, acquisitions and/or new build and renovation opportunities.
As with any investment situation, there are potential risks, some of the known ones as it relates to Great Canadian are: the ongoing Canada Revenue Agency investigation into the Company's tax treatment of past Facility Development Commission amounts which could result in additional taxes being payable; the opening of Paragon Gaming's Parq Vancouver facility anticipated for fourth quarter of 2017; possibly final approval of competitor Gateway Casinos & Entertainment Limited's proposed new facility in close proximity to Great Canadian's prolific River Rock Casino and; the Company's legal action against British Columbia Lottery Corporation ("BCLC") in relation to a dispute over the collection of marketing contributions by BCLC from the Company since 2009. However, when we consider the ramifications of these risks and we compare to the potential upside available through continued solid management of the existing assets and especially the ongoing modernization of Ontario gaming opportunity, we feel the balance is decidedly in favour of remaining as shareholders. In fact, we believe the potential upside in Great Canadian stock is under-appreciated by analysts.

-6-
The Ontario gaming opportunity remains fertile. On February 9, 2017, Great Canadian submitted its bid on the OLG’s Request for Proposal for Gaming Bundle 1 (Ottawa). In addition, the Company is currently assessing OLG’s Requests for Proposals for Gaming Bundle 5 (Greater Toronto Area), which is due April 20, 2017, and Gaming Bundle 6 (West Greater Toronto Area), which is due July 13, 2017. Great Canadian anticipates the OLG to announce the successful proponents for these three bundles in the Spring, late Summer and Fall of 2017, respectively. While these are competitive bidding situations and so there can be no guarantees that the Company will win any further bundles, we do not believe any of the possible upside, which could be material, is priced into the stock today (i.e., we believe investors are valuing Great Canadian stock solely on the current results).
We like Great Canadian's combination of underleveraged balance sheet, free cash flow generation, protected business model, recession-resistant cash flows, high returns on invested capital and relatively inexpensive EV/EBITDA multiple. 2017 will be a heavy capital expenditure year for the Company as money is spent on existing operations. But, as at December 31, 2016, the Company had $229 million of cash and cash equivalents and $323 million of an undrawn senior secured revolving credit facility available to it (net of outstanding letters of credit). With the under-leveraged balance sheet and the prodigious free cash flow generation from operations, $178 million of cash from operations generated in 2016, Great Canadian is in a position to pay for its capital expenditures and consider further acquisitions and/or share buybacks. We are particularly enamoured of management's approach to maintaining a safe balance sheet which they correctly assert positions them well in the eyes of the OLG as a strong candidate for further bundle-allocations and also allows the Company to respond effectively should an opportunity arise when and if another operator gets stretched.
Great Canadian is currently being valued at approximately 7X 2018 estimated EV/EBITDA (assumes no further Ontario bundle wins nor any acquisitions and assumes approximately $240 million in 2018 EBITDA versus $221 million in 2017). A group of publicly-traded, regional gaming comparables are trading for 8X 2018 expected EV/EBITDA. This despite the fact that two of the three peers are considerably more levered than Great Canadian - in our opinion a less-levered entity in the same industry, all other things being equal, should trade for a higher multiple not less. We are also ignoring here, the other benefits of being a primarily Canadian operator with a more favourable competitive dynamic and, that Great Canadian, through the OLG modernization program, is on the doorstep of potentially meaningful additional business growth while these other operators generally do not have the same near-at-hand upside optionality. A one point increment in Great Canadian's 2018 EV/EBITDA multiple would result in an extra $4 of per share value (or an extra 17% on the current share price). If you believe, as we do, that Great Canadian deserves to trade at a bit of a premium given its balance sheet strength, then note that a two point increment equals $8 per share (or an extra 34% on the current share price). Now factor in the possibility of the Company fully executing on its latest normal course issuer bid via repurchasing and cancelling its own stock at the current share price (so shrinking the shares outstanding from 61.5 million to 57.5 million) and assume perhaps another $30 million in 2018 EBITDA acquired via the OLG process (the cost of acquisition of such financed through free cash flow generated in the interim, given the terms of Great Canadian's January 11, 2016 purchase of the OLG's East Gaming Bundle, we believe this is a very realistic

-7-
assumption). Now we have a potential situation where the stock could be worth almost $38 per share or 61% higher than the current share price.
Alterra Power Corporation ("Alterra", 7.1% Current Fund Weighting)
Alterra is a global renewable energy company, managing the following power plants totaling 825 MW of generation capacity (385 MW net share owned by Alterra): Shannon Wind Farm (202.4 MW capacity in Texas, 50% owned by Alterra and is operator/50% by Starwood Energy Group, Alterra's portion of project adjusted EBITDA equalled US$1.0 million in 2016); Dokie 1 Wind Farm (144 MW capacity in northeastern British Columbia, 25.5% owned by Alterra and is operator/74.5% by Axium Infrastructure, Alterra's share of project adjusted EBITDA equalled US$4.4 million in 2016); Toba Montrose run-of-river hydro (235 MW capacity in southwest British Columbia, 40% owned by Alterra and is operator/60% by Axium Infrastructure, Alterra's share of project adjusted EBITDA equalled US$17.0 million in 2016); Jimmie Creek run-of-river hydro (62 MW capacity in southwest British Columbia, 51% owned by Alterra and is the operator/49% by Axium Infrastructure, Alterra's portion of project adjusted EBITDA equalled US$4.1 million in 2016); Svartsengi and Reykjanes Geothermal plants (74 MW and 100 MW capacity respectively in Iceland, 67% owned by Alterra and is operator/33% by Icelandic pension plans, Alterra's share of project adjusted EBITDA equalled US$19.0 million in 2016); Kokomo solar farm (5.4 MW ac/7 MW dc capacity in Indiana U.S., 85% plus owned by Alterra and is operator/balance of ownership to be settled shortly, began operations on December 29, 2016). Alterra also has an extensive portfolio of exploration and development projects.
Between June and August of 2016 Alterra stock rallied from circa $4.50 per share to a high of $7.50 and we sold some of our position at an average of approximately $6.00 per share during that time frame. Then came a not-well-executed bought deal financing at the beginning of

-8-
October 2016 featuring a big discount to the preceding day's share price and an even larger discount to where the stock was trading just a month earlier. With the benefit of hindsight it is clear that this financing was, to some degree at least, placed with investors who were expecting a rapid share price bounce post the bought deal and so, absent the bounce, they rapidly turned to becoming aggressive sellers. Exacerbating the situation was the surprise November election of Donald Trump to which the stock price reacted by collapsing further to a low of $4.20 per share on November 14, 2016 (currently the stock trades for $4.77 per share). For Alterra, or any other renewable power developer active in the U.S., the negative connotations arising from Trump's presidency are twofold: the prospect of higher interest rates and the prospect of less support for (or even hostility) towards U.S. renewable power development. We think both concerns are likely overdone and have bought a bit more stock for the Fund and expect we will buy more over time.
On interest rates, renewable power developers/operators are sensitive to the level of interest rates as projects are built and owned by long term owners typically employing significant amounts of project debt. For North American wind or hydro projects, this can often be 85% to 90% of the overall project capital requirement and can be easily sourced with what is now inexpensive long term debt. The lenders are typically very comfortable with the predictability of the long-term PPA's that accompany these projects. Equity rates of return for the owner are very sensitive to the amount and cost of the project debt. So, assuming a step-change increase in the level of overall interest rates in the U.S. can potentially make some renewable development projects uneconomic, absent other mitigating factors. As well, it should be noted that, when a long-term, contracted, renewable project has been built and is in operation, its valuation from a capital markets perspective is also interest-rate-sensitive. The dividend flows coming from the project for the equity owners are going to be constantly compared against the amount of interest income available from Government bonds.
We are skeptical that the Trump administration's plans for massive infrastructure spending, financed by a large increase in the U.S. government annual deficit, will make it through the U.S. government gauntlet unscathed. Rather, we believe the program will be much watered-down. This program platform has been a significant factor in the justification for U.S. interest rates rising post the election. The reality of government process taken together with the ever-present demographic factor being an ageing U.S. population that looks set to spend less as they age (thus dampening overall economic spending and growth) and the sobering impact on economic growth of massive levels of overall indebtedness already extant, put us in the camp of slow growth for longer and low rates for longer (we would cite the Japanese experience post 1989 as illustrative in this regard, though a more extreme case of the issues the U.S. faces). If interest rate expectations do moderate, Alterra and other interest sensitive stocks will react positively.
On U.S. government support, or lack thereof under the new Trump administration, we think this concern is misplaced. By-and-large U.S. renewable power demand is driven by State policies and there is a clear intention, desire and willingness to keep adding clean, renewable power. Large corporations too are significant supporters of further renewable energy generation (as an example, note that Facebook takes power from Alterra's Shannon Wind Farm operation). States and large corporations look beyond the near-term political winds and plan for the long-term.

-9-
Similar to our past experience owning Boralex Inc. common stock, we believe Alterra's upside will come from the Company's continued build-out of its development pipeline coupled with the free cash flow generated from its existing operating assets. Over the next few years Alterra, which only recently initiated a modest dividend of $0.05 per share per annum in December 2016, should be able to start paying a more meaningful dividend while still financing growth from internal cash flows. And, the growth could be consequential as Alterra has a further 1,200 to 1,700 MW of U.S. wind projects for which it is in the process of seeking qualification for production tax credits (some of these projects are wholly-owned by Alterra while others are in partnership with other developers). As compared to Alterra's current 385 MW net share of its 825 MW gross production portfolio, this is a substantial potential growth profile.
As a further illustration of Alterra stock's undervaluation we would point out that, should the Company cease all development activities (and related expenses) and instead pay out all its free cash flow, we estimate the 2018 dividend would translate to an approximate 14% yield. We emphasize though that this is purely an illustrative exercise as the Company is not about to cease its development activities nor would we recommend it do so as we think there is much value to be created through development of its pipeline of projects. Balancing current cash generation and the future pipeline value we believe Alterra stock's intrinsic value to be $7.50 per share (or 56% higher than the current trading price).
Aritzia Inc. ("Aritzia", 9.9% Current Fund Weighting)
Aritzia was founded in 1984 by the Hill Family (Brian Hill is the CEO) with its first store in Vancouver. The Company is a Canadian women's fashion retailer with in-house design for its collection of exclusive brands selling under the Aritzia banner in 78 retail stores - 60 stores in Canada and 18 in the U.S. with an average 5,000 square foot store footprint located in high-
-10-
performing retail malls and/or on prominent retail streets. The Company has a diverse range of apparel and accessories addressing a broad range of style preferences and lifestyle requirements. The Company is very popular with its Canadian base and is expanding in the U.S. including this year's opening of flagship locations in Los Angeles, Chicago and San Francisco. Fiscal 2018 plans (the Company's fiscal year end is February) also call for three other new stores and the expansion and repositioning of six existing locations on track with the Company's stated goal of a minimum of 25 to 30 new locations in North America, and expansion or repositioning a minimum of 20 to 25 existing stores between fiscal 2017 and to the end of fiscal 2021. Another growth focus is its online presence, www.aritizia.com. Aritzia's offerings can be described as providing exclusive, high-quality women's fashion essentials at a medium to a bit higher price point (but below luxury brand prices) - in the Company's vernacular, its positioning is somewhere between "fast fashion" and "affordable luxury". Interestingly, in the Company's entire 32 year history they have never closed a store.
We began buying Aritzia stock shortly after the January 10, 2017 $17.45 per share bought deal secondary offering and concurrent block trade and, at prices below that transaction level as the placement has not been well-received by investors. The secondary and concurrent block trade almost doubled the Company's share float (i.e., not the totals shares outstanding but rather the amount of shares held by non-insiders) and happened fairly soon after the October 2016 IPO. Further, the sellers were the founding CEO, Brian Hill, plus the U.S. private equity firm, Berkshire Partners, which had purchased a majority stake in 2005 (while Aritzia was still a private company), and other members of management and the Board. These people and entities were also sellers via the IPO. In fairness, during the IPO process, Mr. Hill had stated an intention to maintain a 20% to 25% equity interest (i.e., he would look to sell some more of his holdings post the IPO) but still the transaction has left a sour taste in investors' mouths. After this transaction Mr. Hill's equity ownership drops from 29.8% to 22.6% (so ongoing ownership of 24.5 million shares worth $371 million at today's share price) while Berkshire Partners drops from 40.5% to 28.7% (so remaining ownership of 31.2 million shares worth $473 million at today's share price). As they own multiple-voting shares, their collective equity ownership of 51.3% translates to roughly 91% of all votes. We are reminded of the insider ownership history of Canadian discount retail chain, Dollarama Inc. In 2004 the founding Rossy family sold an 80% stake to Bain Capital for a rumoured $1 billion and remained private. Then, via the 2009 IPO and subsequent sales through to December 2010, Bain Capital sold its ownership at prices between $17.50 per share (IPO price) and $29 per share (the last sales price) while the current share price of Dollarama is $99.64! Clearly, one should not judge future share price performance by insider selling alone.
Between the insider selling and the general malaise surrounding retailers these days (e.g., online sales encroachment, U.S. border tax, etc.), the stock has continued to weaken, now trading at just $15.15 per share which is below the $16 per share IPO price. But, what of the fundamentals? On that front things look considerably more encouraging as we suspect Aritzia is in the early stages of strong U.S., international and online sales growth. A supposition which would be supported by our observations on numerous visits to Toronto area stores (always busy), chats with customers and staff (always positive) and, the Company's recent disclosure of results for its third quarter of fiscal 2017 (the 13 weeks ending November 27, 2016) which featured net revenues increasing by 20% to $186.5 million from $155.4 million in the prior year. This increase was

-11-
primarily driven by comparable sales growth of 15.2%, with strong in-store performance and continued momentum in the Company’s eCommerce business, as well as the revenue from five new store openings and five expanded or repositioned stores since the year ago third quarter of fiscal 2016. As well, the Company's fourth quarter is off to strong start as results for the 5 weeks ending December 2016 were pre-released and are up 12.9% versus the comparable year ago period.
Aritzia's track record of good growth is impressive. The number of stores has grown at a 15.6% compound annual rate between fiscal 2005 and fiscal 2016 while net revenues during the same time frame grew at a 20.6% rate. Store economics are compelling - fiscal 2016 average sales per square feet were $1,465 and the median investment payback has been 18 months for stores opened since fiscal 2011 and operating for at least 18 months. The Company has identified and vetted 125 additional locations across North America that have met their qualifications for a new store. The eCommerce business was launched in fiscal 2013 and accounted for 12% of total net revenues in fiscal 2016. And, in the fall of 2016, Aritzia launched international shipping for its eCommerce platform. Information gleamed from this new distribution channel will be used to help identify promising international markets to further grow the Company's store presence.
Aritzia has meaningful growth plans which, should they come to fruition, could drive the stock much higher. And, these growth plans are supported by a well-capitalized balance sheet with November 27, 2016 (i.e., at the end of fiscal 2017 third quarter) cash of $59.4 million, working capital of $70.9 million and total debt of $133.7 million versus consensus EBITDA expectations for fiscal 2018 of $141 million (so net debt/fiscal 2018 estimated EBITDA = a lowly 0.53X). From the third quarter fiscal 2017 management discussion and analysis ("MD&A") filed on January 9, 2017 ("Outlook" section):
"We believe that we have an opportunity to grow our annual net revenue to between $1.1 billion and $1.2 billion by the end of fiscal 2021. This growth, from fiscal 2017 to the end of fiscal 2021, will be primarily driven by opening a minimum of 25 to 30 new stores, expanding or repositioning a minimum of 20 to 25 existing stores and continuing to drive comparable sales growth, including growing our eCommerce net revenue to approximately 25% of total net revenue. During this period, we believe there is an opportunity to grow our annual Adjusted EBITDA from $85.0 million in Fiscal 2016 to approximately $195 million to $220 million by the end of fiscal 2021, and annual Adjusted Net Income from $40.3 million in Fiscal 2016 to approximately $115 million to $130 million by the end of fiscal 2021. In fiscal 2018, we have plans to open three flagship locations in Los Angeles, San Francisco and Chicago, along with the addition of three new stores and the expansion or reposition of six existing locations. This keeps us on track to open our planned minimum 25 to 30 new locations in North America, and expand or reposition a minimum of 20 to 25 existing stores between fiscal 2017 and to the end of fiscal 2021." Also from the same document, note that Aritzia's outlook per the above paragraph is based on the following key assumptions: "...the achievement of continued comparable sales growth, including growing eCommerce net revenue to approximately 25% of total net revenue, the investment of approximately $5 million per year on maintenance capital expenditures, the investment of approximately $11 million in fiscal 2017 on infrastructure investments, a U.S.

-12-
dollar to Canadian dollar exchange rate of 1:1.3, taxation rates consistent with historical levels, debt repayments consistent with the terms set out in the MD&A, a new store operating model with average store size of approximately 6,000 square feet, average sales per square foot of $1,000 in the first year, at an average net investment of approximately $2.5 million and an average payback period of approximately 24 months on our initial net investment, and our store expansion model with incremental selling space of 3,500 square feet, averages sales per square foot of $1,000, at an average net investment of approximately $2.0 million and an average payback period of approximately 24 months on our initial net investment." Analysts who cover Aritzia have one year target prices between $23 and $26 per share. Given the growth outlook, in particular with the potential for 2.6X the North American store network versus today (ignoring the potential for stores to be developed outside North America and ignoring the impact of upsizing existing stores through the remodel program) and the impressive commensurate growth of the Company's eCommerce platform, we believe these are reasonable target valuations. Longer term it is possible that Aritzia could grow into something much more substantial. Consensus expectations for fiscal 2019 earnings per share (given February fiscal year end, fiscal 2019 is mostly calendar 2018) is $0.81. We believe fiscal 2020 (or mostly calendar 2019) EPS could easily hit $1.05 given the growth rate in hand. And, absent a much more aggressive growth plan, cash generation will become noteworthy in the coming years. We note that, while there are some clear differences between Aritzia's focus and Lululemon Athletica Inc.'s, during the latter's period of 20% to 25% earnings growth, its stock regularly traded for 32X EPS (we can find many past examples of 30X plus EPS multiples for retail chains during their 20% plus earnings growth phases).
UrtheCast Corp. ("UrtheCast", 3.9% Current Fund Weighting)

-13-
UrtheCast is a Vancouver-based technology company that serves the geospatial and geoanalytics markets with a range of information-rich products and services. The Company operates Earth Observation ("EO") sensors in space, including two satellites, Deimos-1 and Deimos-2, to produce imagery data that is displayed on UrtheCast's cloud-based web platform and sold to partners and customers. Through its subsidiary Deimos Imaging, UrtheCast processes and distributes imagery data and value-added products on behalf of the PanGeo Alliance, a network of eight satellite operators with a combined 15 medium- and high-resolution EO sensors. UrtheCast is also developing and expects to launch two new EO satellite constellations: the world's first fully-integrated constellation of sixteen multispectral optical and synthetic aperture radar ("SAR", which allows for imagery regardless of weather or night conditions) satellites, called "OptiSAR", and an eight-satellite constellation designed to capture high-quality, medium-resolution optical imagery of the Earth's entire landmass (excluding Antarctica) every day, called "UrtheDaily". Together, the Company believes these constellations will provide important new Earth-monitoring capabilities which many customers will find attractive given the medium- and high-resolution, high-coverage and high-revisit imagery in all weather conditions. We played a role in UrtheCast going public as we once were management of a public shell which UrtheCast "rolled into" (via a reverse-takeover or "RTO") taking itself from being a private company to public. The RTO happened at $1.77 per share in 2013 and the stock subsequently has been as high as $4.99 and as low as $0.69. We had exited our earlier position during 2015 and then began modestly repurchasing shares for the Fund recently below $1.00. And, this month we participated in the Company's $19.5 million bought deal financing at $1.50 per share as we believe an important turning point has been passed in UrtheCast's progression. UrtheCast is a much different business today than what was rolled into the former shell company. The business is a mix of revenues generated from the 2015 acquisition of the Deimos satellites and from various engineering services work being performed for a variety of international customers. We estimate the Company will generate between $65 million and $70 million in revenues and between $15 million to $20 million of EBITDA in 2017. The Deimos EO business will keep growing as illustrated by the recently-announced multi-year, indirect transaction (via a subsidiary of Elecnor, S.A.) with the Ukrainian Space Agency to provide a Direct Receiving Station for Deimos-2 data (this will result in further Deimos-2 imagery sales for UrtheCast). But, the real potential catalysts for a materially higher stock price come from the two new proposed satellite constellations which are garnering significant industry and government support. These new constellations offer the prospect of a significantly higher earnings base for UrtheCast. While actual satellite operations and the associated imagery monetization are years away, the UrtheDaily targeted launch date is 2019 while the OptiSAR targeted launch date is late 2021, in the interim we believe there will be substantial building and engineering revenues earned by UrtheCast. Our sense is that the stock will continue to firm up from here on in reflecting the greater certainty of these future material earnings streams as they get de-risked. The pace of positive news has been picking up as the below chronology of announcements highlights and we think will be continued through 2017: May 26, 2016 - UrtheCast to Receive Industry Canada Technology Development Program Award of $5 Million to Support Development of its OptiSAR™ Constellation

-14-
July 29, 2016 - UrtheCast and OmniEarth Sign Strategic Partnership in Support of the UrtheDaily(TM) Constellation [NB: OmniEarth is a leading data analytics company and a large consumer of Earth imaging serving customers in agriculture, energy, civil and military markets] January 17, 2017 - UrtheCast Enters into Binding Agreement Worth US$180 Million to Sell and Operate Two Satellites in the OptiSAR™ Constellation [A confidential government customer for the sale and shared operation of the first two satellites in the OptiSAR Constellation, for US$180 million and the customer has agreed to pay an additional US$30 million for other products and services related to the sale of the satellites] February 7, 2017 - GEOSYS Becomes Anchor Customer of UrtheDaily Constellation [GEOSYS is already UrtheCast's largest agricultural customer and will become an anchor customer for the UrtheDaily Constellation. GEOSYS is one of the world's leading providers of digital agricultural solutions and will use the UrtheDaily data to improve decision-making processes for their global customers] February 21, 2017 - UrtheCast Welcomes New CFO and Updates Guidance [Mr. Sai W. Chu is the new CFO. Prior to joining UrtheCast he served as CFO of Vancouver-based Seaspan Corporation where he was a key part of the Company's growth from a US$500 million enterprise value, privately-held company to a an NYSE-listed company with an enterprise value in excess of US$7 billion. During his tenure Seaspan became the largest container ship lessor in the world and raised over US$10 billion in capital] March 14, 2017 - UrtheCast Receives C$17.6 million of Funding from Innovation, Science and Economic Development Canada to Support Development of OptiSAR Satellite Constellation March 22, 2017 - UrtheCast Closes C$19.6 Million Offering of Common Shares [Priced at $1.50 per share, now approximately 118 million shares outstanding] It is estimated that the first three pairs of OptiSAR satellites being the January 17, 2017 announced deal as per above and two earlier memorandum of understandings ("MOU", while not yet formally disclosed by UrtheCast, it appears that one MOU is with the Saudi Arabian space agency and the other with the Kazakhstan space agency) for a combined value of $640 million, will collectively be under firm contract at some point in 2018. And, so we would expect UrtheCast to begin earning good margin "build revenue" related to the OptiSAR Constellation in 2019. The materiality of this OptiSAR and UrtheDaily revenue and EBITDA and that the current base of business now provides for positive free cash flow in and of itself, positions the stock well for the next few years. As well, we think that the ever-increasing "Americanization" of heretofore Canadian tech darling, MacDonald Dettwiler and Associates Ltd., which is in the process of acquiring U.S.-based Digital Globe Inc. and thus further remaking itself as an American company, creates an opening for UrtheCast to become the de facto Canadian darling and reap the benefits of significant Canadian support. As evidence of this we would point to the recent $17.6 million of very inexpensive Canadian Government funding received by UrtheCast in support of OptiSAR -funding from Innovation, Science and Economic Development Canada's Industrial Technologies Office as part of its Strategic Aerospace & Defense Initiative ("SADI") program. This is in addition to previous Government of Canada support received for various UrtheCast initiatives. This positions the Company well for further Government of Canada support and could include for example UrtheCast having a role in future Canadian Government-mandated satellite programs.
-15-
While timing questions and execution risk are always present in a rapidly-changing situation such as that which UrtheCast finds itself in, there is clearly a meaningful opportunity in hand, one which we believe could result in a tripling of the stock over the next 3 to 5 years.
Brief Comments on Smaller Fund Positions
BSM Technologies Inc. ("BSM", 2.4% Current Fund Weighting) - Our investment in BSM stems from our previous investment in WebTech Wireless Inc. The two companies merged with the management team of BSM continuing in most leadership roles. The combined entity is clearly much stronger and has been reaping cost synergies stemming from the merger. We think management is taking the right steps to further strengthen the business via intelligent "tuck-in" acquisitions that, while small individually, collectively can have a big positive impact - an example of this being the October 2016 acquisition of Mobi Corp. which gives BSM complementary strengths in appointment scheduling, route optimization, and analytics software solutions. Management's goal is to reach $100 million per annum of revenues with 15% to 20% EBITDA margins. For now though, we assume BSM is on track to generate $65 million and $70 million in fiscal 2017 and 2018 revenues respectively with recurring revenues representing $46 million and $49 million respectively (fiscal year end is September 30th). We are assuming here, probably too conservatively, no further acquisitions. And, we expect $10 million and $12 million in 2017 and 2018 EBITDA respectively. The telematics industry continues to consolidate as the larger players strive to gain economies of scale. For companies with defensible customer entrenchment and high levels of recurring revenues, takeover multiples in the space have the potential to get "silly high" (such as Verizon Inc.'s 2016 acquisition of Fleetmatics for 17X EV/EBITDA). And, with an activist shareholder represented on the BSM Board, we are confident that maximizing the value of the business in an M&A sense is front and centre. We estimate fair value for the stock to be in the $2.00 to $2.25 per share range but we believe we could see further upside with good execution managing customer churn and solid acquisitions.
AMP Solar Group Inc. ("AMP", 1.4% Current Fund Weighting, Private Company) - AMP is a global solar developer with strong partners and a large pipeline of development projects in Japan, USA, India and elsewhere. Our equity position has a zero cost basis as it was the result of us having provided, along with other investors, a senior secured loan to AMP which was repaid a few years ago. As solar panel prices continue to decline, solar development is becoming increasingly competitive and in some jurisdictions is now below the incumbent cost of power (though absent a viable battery storage solution, solar still cannot provide 24/7 baseload power). Over the last four or so years, AMP has secured significant project-level financing from the large New York City-based private equity firm, Apollo Global Management, LLC (in respect of AMP's United Kingdom projects) and recently a $300 million plus facility from Toronto-based private equity and infrastructure investment firm, Caledon Capital Management. AMP is now exploring options to raise significant capital on its own balance sheet rather at the project level and an IPO is under active consideration. Management is targeting a pricing level that would be many multiples of our current carrying value. However, it is still too early to tell what the outcome of this process will be though we do expect some clarity within the next 6 months.
-16-
Elite Imaging Inc. (soon to be named Akumin Inc.) ("Akumin", 3.0% Current Fund Weighting, Private Company) - Akumin plans to go public in the very near term as it has been successfully accelerating its "roll-up" acquisition strategy of U.S. medical imaging (and other services) clinics. We are impressed with management's attention to detail, smart organizational re-alignments and cost-control focus which have allowed for strong profit margins despite the steep decline in pricing for some medical services in some States. An IPO will allow Akumin to continue and/or accelerate its acquisition strategy and grow very rapidly. We believe a good comparable for what Akumin is striving to do, albeit in a different medical service area, is the TSX-listed CRH Medical Corp. which has made ten acquisitions of anesthesia companies since 2014 and has seen its stock appreciate by over 100% in the last six months. We believe an IPO of Akumin could happen at a price almost twice our carrying value and we believe the next couple of years could deliver much further appreciation should management continue to execute. Medexus Inc. ("Medexus", 2.2% Current Fund Weighting, Private Company) - After many years of modest revenues and profitability, management of Medexus are on the cusp of a step-change in their business given recent provincial formulary acceptance for one of Medexus' products, Metoject (for the treatment of rheumatoid arthritis, "RA"). We think it is reasonable to assume a 10% to 30% portion of the Canadian RA population over the next few years will adopt Metoject as a safer and more convenient delivery method for their Methotrexate dosage now that the cost will be covered in the same manner as some of their other options. The next few years will tell but it is possible that Medexus' annual pre-tax income will start exceeding our current carrying value giving us the possibility of a substantial gain on the position. Should this unfold as described here then the next question will be how to maximize value? An IPO/RTO, a sale to a third party, or maximizing dividends out to the private shareholders, or a mix of all these.
Summarizing the Fund's Potential Upside
As always, we have no idea when we might see our various positions trade closer to our estimates of intrinsic or fair value nor do we know if they will all happily do so at the same time (unlikely). All we can do is outline the collective hypothetical "Fund Upside" should all these discussed holdings (and some others) move to our estimates at the same time. On that basis then, we note with restrained excitement (did we mention we are the largest unitholders?) that the Fund's collective potential upside as per our estimates is 68%. Respectfully submitted, Peter Puccetti, CFA Chief Investment Officer Goodwood Inc. March 30, 2017

-17-
GOODWOOD CAPITAL FUND 2016 Annual Report
To the Unitholders of Goodwood Capital Fund: For the year ending December 31, 2016, the Goodwood Capital Fund’s (the "Capital Fund") net asset value (“NAV”) per Class “A” unit increased +12.7%. The S&P/TSX Composite Total Return Index ("TSX") increased +21.1% and the S&P/TSX SmallCap Total Return Index (“SmallCap Index”) increased +38.5% in the same period.* A new class of units, Class “F” was issued in 2016 and increased +11.3% for the period beginning July 8, 2016 (the date on which Class “F” units were first sold). From December 23, 1999 (commencement of the offering of the Capital Fund Class “A” units) through to December 31, 2016, the Capital Fund has returned +4.6% per annum net versus the TSX's per annum increase of +6.2%. No distributions were paid on December 31, 2016. The Capital Fund's 2016 audited financial statements are attached for your review. For a more detailed discussion of Goodwood Inc.’s investment philosophy and information regarding the Capital Fund’s core holdings, please refer to the Annual Management Report of Fund Performance available on SEDAR (www.sedar.com) and pages 2 through 16 of the Annual Report of The Goodwood Funds enclosed. Please feel free to call if you have any questions, thoughts or comments. Respectfully submitted, Peter Puccetti, CFA Chief Investment Officer Goodwood Inc.
March 30, 2017 * The proportion of assets of the Fund invested in any particular market capitalization will vary and may include a large portion invested in small-cap issuers The S&P/TSX Composite Total Return Index is a broad-based market capitalization weighted index of the largest, most widely held stocks traded on the Toronto Stock Exchange. The S&P/TSX SmallCap Total Return Index provides an investable index for the Canadian small cap market. These indices include reinvestment of dividends and capital gains
Note that the indicated rates of return are the historical total returns over the periods noted, including changes in unit value and reinvestment of all distributions. These indicated rates of return are net of all management fees, expenses and performance incentive fees and do not take into account any redemption charges that may have been payable by redeeming unitholders, which would have reduced the returns of redeeming unitholders in certain circumstances. Please refer to the Prospectus for details concerning the redemption fee schedule of the Fund and other important information. In addition, note that performance data represents past performance and is not necessarily indicative of future performance.

-18-
GOODWOOD MILFORD FUND 2016 Annual Report
To the Unitholders of the Goodwood Milford Fund: For the year ending December 31, 2016, the Goodwood Milford Fund’s (the "Fund") net asset value (“NAV”) per “Class S” unit increased by +12.3%. The S&P/TSX Composite Total Return Index ("TSX") increased by +21.1% in the same period. The FTSE TMX Canada Universe Corporate Bond Index returned +3.7% in 2016. From January 1, 2006 (commencement of the offering of the Fund Class “S” units) through to December 31, 2016, the Fund has returned +14.5% per annum net (after all fees) versus the TSX's per annum return of 5.8%.* The Fund's 2016 audited financial statements are attached for your review. During 2016 (based on month end figures), the Fund averaged a 151.9% invested position (i.e., market value of long positions plus market value of short sale positions as a percentage of the Fund’s equity). At one extreme, the Fund was 164.9% invested, composed of 163.6% long and 1.3% short, leaving a “net market exposure” (i.e., longs minus shorts as a percentage of the Fund’s equity) of 162.3%. At the other extreme, the Fund was 131.1% invested, or 113.0% long and 18.1% short for a net market exposure of 94.9%. The Fund’s investment focus is on creating investment return by recognizing companies whose bonds will rise in price as a result of improving credit quality. We forecast improvements in credit quality by analyzing fundamental bottom up factors and watch for improvements in corporate performance, implementation of successful new business lines, asset sales, deleveraging and equity raises.
*The indicated rates of return are the historical total returns over the periods noted, including changes in unit value and reinvestment of all distributions. These indicated rates of return are net of all management fees, expenses and performance incentive fees and do not take into account any redemption charges that may have been payable by redeeming unitholders, which would have reduced the returns of redeeming unitholders in certain circumstances. Performance returns in this report are calculated for the founding Class of Units. Other classes may charge different fees and therefore returns between the different classes may vary. Goodwood Inc. became the Investment Manager of the Goodwood Milford Fund on October 1, 2013 and Chris Currie, CFA joined Goodwood Inc.’s investment team continuing as portfolio manager for the Fund. There will be no change to the investment strategy of the Fund. Please refer to the Offering Memorandum for details concerning the redemption fee schedule applicable to the Fund and other important information. In addition, performance data represents past performance and is not necessarily indicative of future performance. Performance data from certain market indices (S&P/TSX Composite and FTSE TMX Canada Universe Corporate Bond Index) are provided in this report for information purposes only. A comparison of the Fund’s performance to such market indices is of limited use because the composition of the Fund’s portfolio may contain other securities not found in the market index. As a result, no market indices are directly comparable to the results of the Fund.

-19-
The Goodwood Milford Fund The Goodwood Milford Fund is a yield-oriented Fund that shares a similar value investing philosophy with the other Goodwood Funds. To achieve its yield goals the Fund invests in fixed income securities, including government bonds, corporate bonds and high yield bonds, preferred shares and equities. The notional target ranges for each investment class is 70 % fixed income, 10% preferred shares and 20% equities. Leverage can be used to increase yield and short sales can be used to protect capital. Within the fixed income segment, the Fund has the ability to shift the risk/reward profile by moving from government bonds to higher yielding, lower rated bonds. The Fund has historically focused on the corporate bond sector as the manager is attracted to the higher coupons available and believes that within this sector there is the opportunity to generate capital gains by identifying securities which will improve in credit quality from any combination of improved business fundamentals, equity deleveraging, sales of subsidiaries or assets, mergers and credit rating upgrades. In reviewing the investment year of 2016, three notable events standout: The emergence of negative interest rates on sovereign securities from Japan and several
European countries;
The apparent bottom in interest rates occurring in the summer; and,
The surprise election victory of Donald Trump. The Fund generated a +12.3% return in 2016 from reducing exposure to investment grade corporate bonds over the summer and emphasizing high yield bonds. Comments on Fund Asset Classes Investment Grade Corporate Bonds Investment grade corporate bonds were a very attractive asset class from January to September. The FTSE TMX Canada Universe Canadian Bond Index, All Corporates return for those respective 9 months was 5.7% outpacing the 9 month return generated by the Composite component of the index of 5.1%. The lowest tier of investment grade credit, BBB’s, performed even stronger generating a 6.8% return for the first 3 quarters of 2016. The combination of steadily falling interest rates from January to September and spread tightening led to the outperformance. Spreads tightened as a result of a recovery in the stock market indices combined with a re-opening of the capital markets as investors searched for ways to invest funds that had been on the sidelines. The increase in the price of crude oil from the lows experienced in January 2016 was another factor in the stock market gains. As the US election campaign kicked into high gear we started to believe a change in fiscal and monetary policy was potentially in the works. Both the Republicans and the Democrats advocated increased fiscal stimulus as a means to invigorate economies that were becoming less
-20-
responsive to monetary policy. The negative rates experiment in Japan and several European countries also focused the debate on the fiscal versus monetary stimulus. These factors led us to start selling our lowest yielding bonds over the summer as we felt there was little value in holding these bonds. Government bonds weakened after Donald Trump’s election in November. His policies of cutting taxes and increased fiscal stimulus were seen as creating a new wave of government debt to finance programs. More supply than demand results in prices falling (yields rising). The FTSE TMX Canada Universe Canadian Bond Index Composite ended the year at 1.7% (versus 5.1% for the first 9 months), the All Corporates segment was 3.7% for the year (versus 5.7% for the first 9 months) and the BBB segment of the Index was 5.2% for the year (versus 6.8% for the first 9 months of the year). As protection against a backup in rates, we shorted a number of government bonds over the Fall. This short position worked out well after the Trump election as described in the section below describing the short sale of the Government of Canada 1.5% due 2026 bond. High Yield Bonds High yield bonds had a very strong year in 2016 as a result of rising equity markets, a recovery in the price of crude oil and investor demand for riskier asset classes. Performance of high yield bonds increased after Trump’s win as his policies of stimulating economic growth and cutting taxes are seen as a boost to the value of lower rated bonds. In the US, the benchmark ETF HYG (iShares iBoxx $ High Yield Corporate Bond ETF) generated a 2016 annual return of 13.9%. In Canada, the FTSE TMX Canada Universe Corporate BBB Index generated a return of 5.15%. High yield bonds were the strongest contributor to returns in the Fund in 2016 generating both high levels of coupon income and capital gains. Some examples of high yield bonds that performed well include: Paramount Resources Ltd. 7.625% due 2019 purchased at $80.50 and redeemed by the company at $102.54 in November, Canexus Corporation 6% convertible bond due 2020 which started the year at $94.20 and were priced at $100.25 at year end and Algonquin Power & Utilities Corp. 5% convertible debenture represented by instalment receipts, purchased at $33.33 and sold at various prices in 2016 the lowest being $39.00. Preferred Shares Preferred shares experienced steady gains in 2016 as a result of falling interest rates into the Fall and demand from investors for risk based assets. The preferred share market was active with a number of new issues. Importantly for the Fund, the new type of preferred, the minimum rate reset preferred, was the dominant type in new issue volume. Also of note is that the three largest issues in 2016, the TransCanada Corp. 5.5% Series 13 at $500mm, the TransCanada Corp. 4.9% at $1B and the Enbridge Inc. 5.15% Series 17 at $750mm attracted significant institutional interest due to their liquidity and attractive terms. The Fund purchased each of these issues and all are currently trading above their issue price.

-21-
Equities
Long Equities To mitigate risk and enhance return, the Fund may invest a small portion of its assets in long/short equity investments. Equities provided a strong contribution to the Fund’s return as equity markets in Canada and the US were solid performers in 2016. The TSX Total return index was up 21.1% in 2016 and the Dow Jones Industrial average was up 13.4%. The Fund generated gains in a number of positions. Highlights include strong gains in Olin Corporation, which is described more fully below, Polaris Infrastructure Inc., which is a Nicaragua based geothermal power producer and StorageVault Canada Inc., a newly listed REIT in the Canadian self-storage industry.
Short Equities The short equity segment of the Fund was the weakest contributor to performance. January and February of 2016 presented several attractive opportunities in the energy industry as oil prices hit very low levels. However, as energy and equity markets recovered in the spring, profitable short selling opportunities declined. We had more success shorting Government of Canada bonds as described in the section below. Comments on Goodwood Milford Fund Portfolio Holdings
Empire Life Financial 3.38% due December 16, 2026 (“Empire Life”)
98
99
100
101
102
103
104
Dec‐16
Dec‐16
Dec‐16
Jan‐17
Jan‐17
Jan‐17
Jan‐17
Jan‐17
Feb‐17
Feb‐17
Feb‐17
Feb‐17
Mar‐17
Mar‐17
Mar‐17
Mar‐17
12/16/2026 The Empire Life Insurance Company 3.383%

-22-
Empire Life is an infrequent issuer in the capital markets and this works in investors favour as the company usually has to pay a higher coupon to attract interest in their securities. Empire Life is owned by E-L Financial Services Ltd. and is rated A (low) by DBRS. These bonds have a 5yr + 5yr fixed to floating structure. We felt these subordinated bonds offered an attractive spread at +230 bps for a 5 year bond, well back of other better known Canadian insurers such as Sun Life Financial Inc., Manulife Financial Corp. and Great-West Lifeco Inc. We bought the bond primarily because of its attractive yield for a 5 year bond given its credit rating. In addition, the bonds have a unique feature that unless called they are exchangeable into a new 5 year bond that carries a floating rate at a spread of 195 bps over the floating 3 month CDOR rate. The prospect of rising interest rates which would make the floating rate feature attractive, has become more tenable with the election of Donald Trump and his policies to cut taxes and spend heavily on infrastructure and defense. Athabasca Oil Corp. 7.5% due November 19, 2017 (“Athabasca”)
We were attracted to the Athabasca situation as we saw upside in the Company`s debt as the company undertook a number of deleveraging strategies. Athabasca was highly levered and had exposure to heavy oil production which was uneconomic at below US$50 oil. In January 2016, Athabasca announced a joint venture with Murphy Oil Corporation (“Murphy”) to develop Athabasca`s Duvernay lands. Athabasca was to receive $250mm on closing, expected in May 2016. At the time this deal was announced, oil prices were selling off to below $US40 per barrel so this announcement did not receive much attention. The Fund bought its position in Athabasca in April after a modest rise in oil prices, as we believed a sustainable higher level of oil prices
90
92
94
96
98
100
102
Mar‐16
Apr‐16
May‐16
Jun‐16
Jul‐16
Aug‐16
Sep‐16
Oct‐16
Nov‐16
Dec‐16
Jan‐17
Feb‐17
11/19/2017 Athabasca Oil Corp 7.50%

-23-
would motivate Murphy to close the joint venture. The joint venture did close on schedule in May 2016. At that point Athabasca had $880mm in liquidity against $820mm of debt. Athabasca further increased its liquidity by selling a bitumen royalty to Burgess Energy Holdings LLC for $129mm and repaying its term loan of US$221mm. Athabasca was also able to refinance its revolving debt. As a result of its improved financial situation Athabasca raised US$450mm of high yield bonds in the U.S. which enabled the Company to tender for the bonds we hold in the Fund at $100.425 plus interest. Olin Corporation (“Olin”) Olin is one of North America’s largest chemical producers and is the leader in the production of chlorine and chlor-alkali. The company acquired The Dow Chemical Company’s (“Dow”) chlorine business in 2015 in a US$5B transaction. We initially came into contact with Olin in the course of our research relating to a takeover bid for Canexus Corporation (“Canexus”), a Canadian sodium chlorate producer which the Fund holds bonds of. We found Olin to be an attractive investment opportunity as we felt that demand for the chemical products that Olin produces would increase as the US economy improved and that there were potential opportunities to increase profits from realizing synergies as the former Dow assets were integrated. This thesis proved to be accurate as after investing in March 2016 at a cost of US$16.85 per share, the stock rose appreciably. This was a result of strong equity markets in the U.S., an improving economic outlook and prices for the Company’s main products increasing. Interestingly, in regard to the takeover of the Canadian chemical producer Canexus, the company that made the original takeover offer, Superior Plus Corp. had its bid rejected by US regulators, but another Canadian chemical producer Chemtrade Logistics Income Fund quickly stepped in and announced a take-over offer for Canexus which closed in March, 2017.

-24-
TransCanada Corp. 5.5% Series 13 Preferred Shares (“TransCanada”)
The preferred share market has become more interesting as new structures have replaced preferred shares being reset at lower than original dividends on their 5 year reset dates. A new breed of preferred share – the minimum rate reset – started to appear in the market in 2016. With these types of securities, investors get a reset dividend every five years but this dividend can never be lower than the original issue dividend. TransCanada Corp in April 2016 issued the then largest of these minimum reset issues at $500mm. Rated P-2 by S&P the issue had a high enough credit quality, was large enough and had a high enough dividend that it attracted institutional interest which is rare in the preferred share market. We liked the attractive dividend, which for our Fund allows us to flow through the dividend gross up tax advantages of preferred shares to investors. We bought at $25.00 per share and the shares have traded up since our purchase.

-25-
Government of Canada 1.50% due June 1, 2026 – Short Sale
We shorted the benchmark Government of Canada ten year bond in September of 2016. Over the summer we had come to the view that the record low in bond yields was not sustainable, especially since politicians were campaigning on a platform of increased fiscal spending. The extremity of the negative yield experiment in Japan and several European countries also influenced our decision. Over the summer, we took gains by selling the Fund’s lowest yielding investment grade corporate bonds. We viewed shorting the ten year Government of Canada 1.5% due June 2026 at a yield of 1.18% (price @ $102.88) as an extension of that investment viewpoint. The position was moderately profitable into the Fall as the chart above indicates. That all changed after the surprise election victory of Donald J. Trump on November 6. His policies of tax cuts and infrastructure spending were seen as negative for the bond market and bonds sold off dramatically increasing the profits on this short position. Please contact us if you have any questions or comments and thank you for your support in 2016, we look forward to 2017.
Respectfully submitted, Chris Currie, CFA Portfolio Manager Goodwood Inc.
March 30, 2017
94
96
98
100
102
104
106
Apr‐16
May‐16
Jun‐16
Jul‐16
Aug‐16
Sep‐16
Oct‐16
Nov‐16
Dec‐16
Jan‐17
Feb‐17
Mar‐17
6/1/2026 Government of Canada 1.50%

Goodwood Fund
Goodwood Capital Fund
Goodwood Milford Fund
Strategy:
Long/Short fundamental bottom-up
value oriented
Long-only fundamental bottom-up
value oriented
Long/Short fundamental corporate
credit with equity overlay
Exposure:
Valuation/Liquidity:
Fund Type:
North America
Weekly & Monthly
Mutual Fund Trust
North America
Weekly & Monthly
Mutual Fund Trust
North America
Weekly & Monthly
Limited Partnership
Inception Date: October, 1996 December, 1999 January, 2006
RRSP Eligible: Yes Yes N/A
Prime Broker/ Custodian:
National Bank Correspondent Network
(NBCN Inc.)
National Bank Correspondent Network
(NBCN Inc.)
National Bank Correspondent Network
(NBCN Inc.)
Trustee/ General Partner:
Computershare Trust Company of Canada
Computershare Trust Company of Canada
Milford Capital Management Partners Inc.
Fund Accounting: CommonWealth Fund Services Ltd.
CommonWealth Fund Services Ltd.
CommonWealth Fund Services Ltd.
Auditor: KPMG, LLP KPMG, LLP KPMG, LLP
Legal Counsel: Borden Ladner Gervais, LLP
Borden Ladner Gervais, LLP
Borden Ladner Gervais, LLP
FundSERV Code: Class B – GWD022 Class F – GWD222
Class A – GWD001 Class F – GWD004
Class A – GWD025 Class F – GWD220
Class AD – GWD501 Class FD- GWD505
Series Codes - Q2 2017

GOODWOOD INC.
212 King Street West, Suite 200 Toronto, Ontario, M5H 1K5
Main Line: (416) 203-2022 Fax: (416) 203-0734 Toll-free: 1-866-681-4393
Email: [email protected] Website: www.goodwoodfunds.com