1. - tn.gov · that displays a summary of student data from a district’s student information ......
TRANSCRIPT

1
2
1. What is ImpactTN?
ImpactTN is a web-based, visualization tool designed for Tennessee educators
that displays a summary of student data from a district’s student information
system and other state sources.
ImpactTN includes the following sections:
o School Information, which includes contact information, student
demographics, and students by grades, and staff and teacher lists.
o The academic dashboard, which includes student attendance and
discipline incidents, state standardized assessments (TCAP and EOCs),
and grades and credits.
o Goal planning options for administrators, which include goals for student
attendance and discipline, state assessments, and grades and credits.
2. Who developed ImpactTN?
The department developed ImpactTN with input from various stakeholders
throughout the state. Double Line Partners provided early development support;
however, the software is now fully managed by the department.
3. How can I use ImpactTN?
District and school administrators may use the data to monitor and analyze
student attendance, discipline, grades, and performance on state assessments.
They may also use the data for decision making planning, and setting goals.
Teachers may look up individual students. ImpactTN data can be used to spot
trends, group students that may require additional behavior or instructional
support, and allow for ongoing monitoring of progress.
4. How do I receive my login credentials?
Once your district has agreed to fully activate ImpactTN, you should receive an
email with your login credentials. If you have not received an email with login
information, please contact your district Student Information System (SIS)
manager. If you’ve received your state Single Sign On (SSO) credentials, you may
use that login to access ImpactTN.

3
Table of Contents
Getting Started: Access to ImpactTN……………………………………………………...........4
Logging into ImpactTN.............................................................................................5
Navigating ImpactTN ............................................................................................6-7
Teacher Landing Page………………………………………………………………………….…..……8
Customize View……………………………………………………………….....……………….………..9
Create or Add to Watch List……………………………………………………………….………..10
Students’ Landing Page…………………………………………………………………….…….……11
Student Information Tab…………………………………………………..………….….………….12
Student Academic Dashboard Tab……………………………………….…………...……13-15
State Assessments……………………………………………………….………..….……….14
Grades/Credits……………………………………………………………….………...……….15
Student Transcript Tab………………………………………………………….…………….….16-18
Current Courses……………………………………………………………….……….……….16
Course History…………………………………………………………………………….……..17
Historical Assessments…………………………………………..………….…….………..18
Training Exercise Activities………………………………….………………….…………..……19--31
Exercise 1: Customize View ................................................................. ..20-21
Exercise 2: Change Data View ................................................................22-23
Exercise 3: View a Student’s page......................................................... 24-26
Exercise 4: Create or Add to a Watch List ............................................ 27-31
Additional Information...................................................................................... 32-35
Using the EXPORT ALL, PRINT, SUPPORT, and LOGOUT icons
EXPORT ALL..........................................................................................32
PRINT. ...................................................................................................33
SUPPORT...............................................................................................34
LOGOUT...............................................................................................34
Information about the MORE icons under the DETAILS column ........ 35

4
Getting Started: Access to ImpactTN
1. How do I log in?
ImpactTN is a web-based system. You can access here:
https://educatordashboards.tnedu.gov. Once there, select “TN SSO” and input
your credentials. If you are already logged in to a Microsoft account in your
browser, it is recommended that you use a different browser and/or use a
private or incognito window to sign in to avoid conflicts with other Microsoft
accounts.
Once you select “TN SSO” input your credentials on the next page.
Figure 1: Select TN SSO

5
Logging into ImpactTN
(For training purposes if you do not have a user ID)
For access to the Teacher ImpactTN Dashboard Demo site, visit:
https://edfidashboards-demo.azurewebsites.net
Using the following login information for the training website:
User name: [email protected]
Password: Demo2016
Once the information is entered, click Sign in. (Don’t forget to LOG OUT when you are finished)
Figure 2: Enter user name that ends in @tnk12.gov

6
Navigating Teacher Landing Page
Once logged into the dashboard, this will be your view.
You will see the STUDENT names; GRADE LEVEL; DESIGNATIONS; and the larger
ATTENDANCE/DISCIPLINE tab with: Last Four Weeks Attendance; Last Eight Weeks Attendance;
Year to Date Attendance; Last Four Weeks Class Absences; Year to Date Class Absences.
Figure 3: Teacher Home Page
Program Designation:
Gifted & Talented
Special Education
504 Designation
Dropdown
Menu for
Student
Lists and
Data Views
(See page
8)
Teacher Name
Customize
View Options
(see page 9)
Student Names
(Student,
Grade Level,
Metrics, etc.)
Click on the
white headings
to sort the
rows in an
ascending
order. Click
again to sort in
descending
order.
EXPORT
ALL, PRINT,
SUPPORT,
and LOG
OUT
selections
Testing
Information
Codes
Program
Designation
Testing Information Codes:
State Assessments
ESL, LEP or Bilingual
State Assessments ALT
Late Enrollment
Test Accommodation
Partial Transcript
See Glossary
for
definitions:
Metric Value
Indicators
and
Trend
Indicators

7
SUPPORT
Note: there is a SUPPORT
button should you require
help; the snapshot to the
right shows the Submit
Request Window:
(Using the scroll bar at bottom of the page to pull up more information to the right side
of the window)
Then you will
see the GRADES
tab which
contains #
Grades Below C;
and Grades
Falling > 10%.
(Note: there
may be more
than one page
of students.)

8
Teacher Home Page Dropdown Menus
Figure 4: Student List Dropdown Menu
Figure 5: Data View Dropdown Menu
Student Dropdown Menu:
Individual Classes
4 or more Days
Absent
Low Attendance
Data View Dropdown Menu:
General Overview
Prior Year
Assessment Details
State Standardized
Assessments
o ELA/Reading
(State)
o Writing (State)
o Mathematics
(State)
o Science (State)
o Social Studies
(State)

9
Customize View
The “CUSTOMIZE VIEW” feature in the Dashboard allows you to see the data most relevant
to you each time you open a class view.
Figure 5: Customize View Options
1. Select See More Data to see the following additional columns: Grades
# of Grades Below C
Grades Falling ≥10%
ELA Advanced Enrollment
Math Advanced Enrollment
Science Advanced Enrollment
Social Studies Advanced Enrollment
(Data varies by grade span)
2. Select Maximize Grid to view in separate window. (Larger landscape view)
Customize View
Options
See More
Data
Maximize
Grid
Create or
Add to
Watch List
Attendance/Discipline
Year to date attendance
Number of days absent
Number of unexcused days
absent
Last four weeks class absences
Last eight weeks class absences
Year to date class absences
State reportable offences
School Code of Conduct
All Discipline Incidents
School Code of Conduct
Incidents

10
Create or Add to Watch List
1. Navigate to a class homepage and Select Create or Add to Watch List to add students to a
special Watch List. (Example: RTI2, Chronic Absenteeism, and/or Tier II and Tier III
students)
Figure 6: Add Students to Watch List
Remember: You can select the Export All button at the top of your home page and export all data
in an Excel spreadsheet.
Figure 7: Export data from teacher home page
11
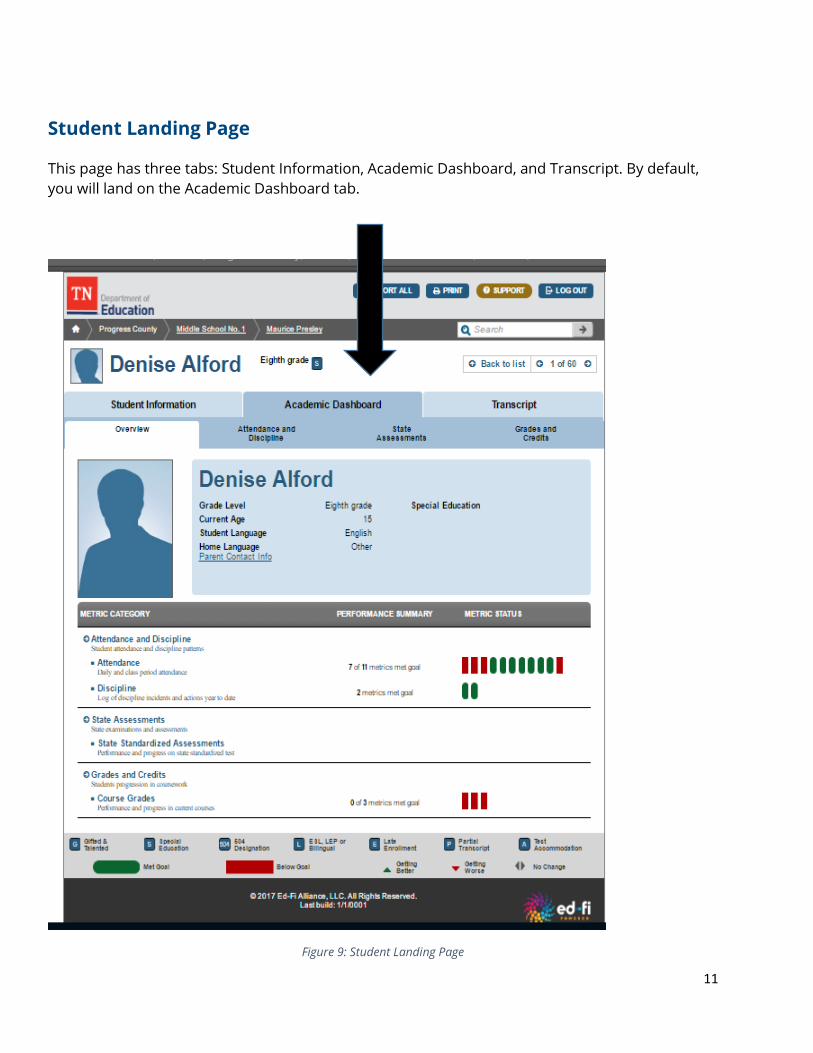
Student Landing Page
This page has three tabs: Student Information, Academic Dashboard, and Transcript. By default,
you will land on the Academic Dashboard tab.
Figure 9: Student Landing Page

12
Student Information Tab: Student’s Home Page
Figure 10: Student Information Page
Student Information
Parent/Guardian
Information
School Information
o Grade Level
o Late Enrollment
o Homeroom
o Date of Entry
o Date of
Withdrawal
o Expected
Graduation Year
Program Status
o 504 Designation
o Bilingual
Program
o Career &
Technical
Education
o English as
Second Language
o Gifted/Talent
o Special Education
Other Student
Information
o Homeless
o Immigrant
o Limited English
Proficiency
o Migrant
o Over Age

13
Student Academic Dashboard Page: Attendance and Discipline Tab
Figure 11: Student Academic Dashboard Page: Attendance and Discipline Tab
Student Academic
Dashboard
Overview
Attendance and
Discipline
Hover over metrics with your
mouse to get more detailed
explanations/definitions.
Click the “More” button to get
more detailed data about a
student’s activity.
State Assessments
Clicking on “More” will show
how a student performed on
each TCAP/EOC objective for a
given assessment.
Grades and Credits
In the Course Grades section
clicking “More” will show a
student’s current courses,
grades & teachers. In the
Credit Section click “More” to
view course history and
grades.

14
Student Academic Dashboard Page: State Assessment Tab
Figure 12: Student Academic Page: State Assessment Tab
Student Academic
Dashboard
Overview
Attendance and
Discipline
Hover over metrics with your
mouse to get more detailed
explanations/definitions.
Click the “More” button to get
more detailed data about a
student’s activity.
State Assessments
Clicking on “More” will show
how a student performed on
each TCAP/EOC objective for a
given assessment.
Grades and Credits
In the Course Grades section
clicking “More” will show a
student’s current courses,
grades & teachers. In the
Credit Section click “More” to
view course history and
grades.

15
Student Academic Dashboard Page: Grades and Credits Tab
Figure 13: Student Academic Page: Grades and Credits Tab
Student Academic
Dashboard
Overview
Attendance and
Discipline
Hover over metrics with your
mouse to get more detailed
explanations/definitions.
Click the “More” button to get
more detailed data about a
student’s activity.
State Assessments
Clicking on “More” will show
how a student performed on
each TCAP/EOC objective for a
given assessment.
Grades and Credits
In the Course Grades section
clicking “More” will show a
student’s current courses,
grades & teachers. In the
Credit Section click “More” to
view course history and
grades.

16
Student Transcript Tab: Three 3 Subcategories
Current Courses
Figure 14: Student Transcript Page: Current Courses

17
Student Transcript Tab: Three Subcategories
Course History
Figure 15: Student Transcript Page: Course History

18
Student Transcript Tab: Three Subcategories
Historical Assessment
Figure 16: Student Transcript Page: Historical Assessment
19
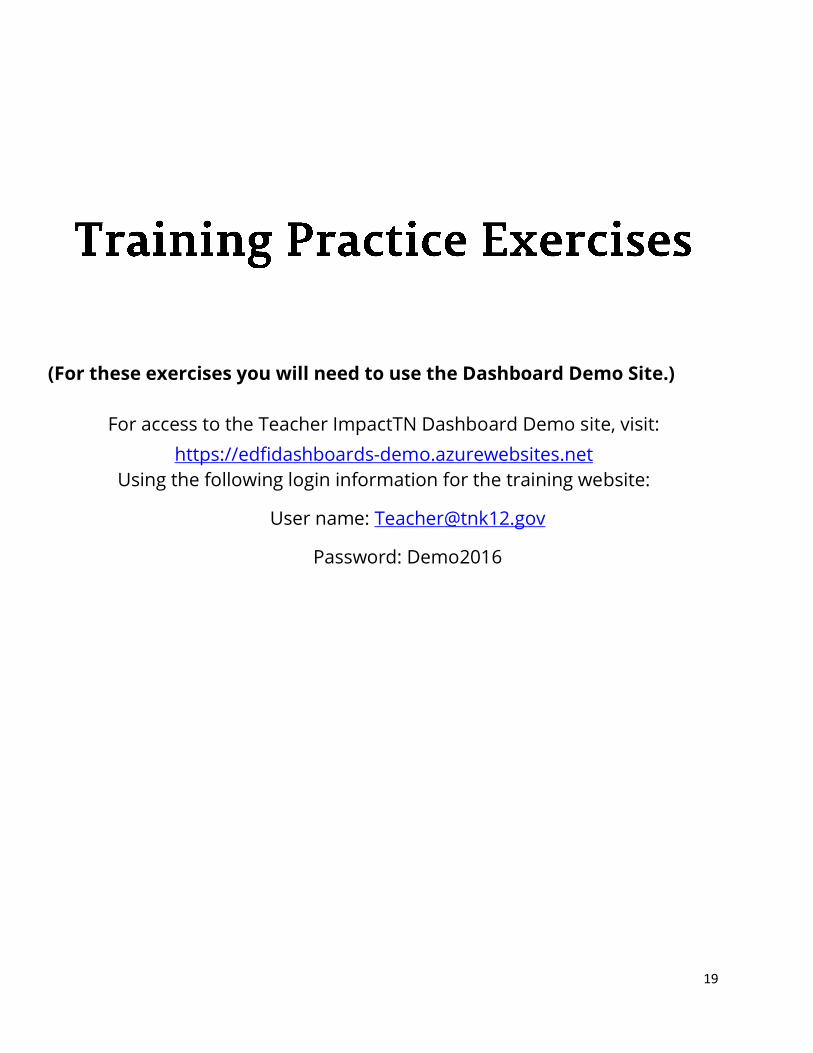
(For these exercises you will need to use the Dashboard Demo Site.)
For access to the Teacher ImpactTN Dashboard Demo site, visit:
https://edfidashboards-demo.azurewebsites.net
Using the following login information for the training website:
User name: [email protected]
Password: Demo2016

20
Exercise 1: Customize View, continued
1. Click the “SEE MORE
DATA” button on the
left.
2. Columns will populate
for all available metrics. You
can select (check) the box
below the metric to add it
or deselect the box to
remove it. For this exercise,
the Number of Days
Absent metric has been
added.

21
Exercise 1: Customize View, continued
3. Click the “SAVE
COLUMNS” button to
retain this additional
column in your default
class view before going
forward.
It is essential to note that all columns/metrics can be added or removed at any time by
following these steps. The metric is never permanently lost, only selected (displayed) or
unselected (hidden).
Adding and removing metrics based upon an educator’s specific needs is a very powerful
method of organizing the available information. For example, the Number of Days Absent
metric can demonstrate the very powerful correlation between a student’s performance
and their attendance.

22
Exercise 2: Change Data View
The classroom view has several options to view student performance in teacher or issue
specific contexts. You can select different views from the drop down menu highlighted on
the right side of the window.
The options shown are:
▪ General Overview
▪ Prior Year – current students’ prior year performance to be populated in the future
▪ Subject Specific – students’ performance on metrics relevant to the subject of the
section
(elective teachers default to ELA / Reading metrics)
▪ Assessment Details– students’ performance on assessment strands or reporting
categories ▪ State Standardized
Each column in each view can be sorted by ascending or descending order, so that a teacher
can view the group of students not meeting the metric goal or look at the top performers.
For this exercise, we will view the data for “Prior Year”. (Other selections have NO DATA
AVALIABLE for this exercise)
1. Begin at your class
homepage and click on
“Data View” to view
selections. Keep on
Prior Year.
(The default view is
“General
Overview”)
2. Go to Student
List; keep it on the
other
(035_2017_96858) –
Homeroom (01)
Year Round
selection.

23
Exercise 2: Change Data View, continued
3. Click on column
header #Grades Below
C to sort student results
by performance (click
once to switch from
ascending to descending
or vice versa).
(Note: Once you have
clicked on any heading an
automatic sort will take
place.)
An up or increase icon, or
a down or decrease icon
will appear just behind
the columns’ name (ᶺ or
ᵛ will appear).

24
Exercise 3: View a Student’s Page Select a student by clicking on the student’s name:
This tab contains a photo of the student, student name, address, age, student language,
home language; designation such as the example is in Special Education; and Parent Contact
Info.
The following student information is also available:
Attendance and Discipline
State Assessments
Grades and Credits
(See the following student page)

25
Exercise 3: View a Student’s Page, continued
By selecting and clicking on the tab of interest, such as Attendance and Discipline; or
Attendance under that heading, you will bring up the student’s record (see following
example):

26
Exercise 3: View a Student’s page Continued
Snapshot of student record showing Attendance and Discipline

27
Exercise 4: Create or Add to a Watch List
The Watch List feature in the Dashboard allows you to monitor students based on
selected filters and can serve as an early warning system.
This exercise details the process for creating a watch list for students who have more
than three days absent.
1. Click on “CUSTOMIZE
VIEW” button
2. Select “CREATE OR ADD
TO WATCH LIST” which will
open the students’
selection page.

28
Exercise 4: Create or Add to a Watch List, continued
3. Select those students by
the criteria filters you wish
by putting a check in the
box before each student’s
name.
4. Name your watch list:
“4 or more Days Absent”
You can also add the
selected student(s) to an
existing list which was
established earlier.

29
Exercise 4: Create or Add to a Watch List, continued
5. To view your
watch list, go
to the
Student List
selection
window, scroll
to and select
the
information /
list you want
to see; and it
will be
propagated.
Here we select:
4 or more Days
Absent.
6. Select the:
CUSTOMIZE VIEW
icon

30
Exercise 4: Create or Add to a Watch List, continued
This will bring up the following window: showing the selection of: SEE MORE DATA;
MAXIMIZE GRID; and EDIT WATCH LIST
7. To remove
students from a list:
select the desired
list; in this case use:
4 or more Days
Absent.
8. Select: EDIT
WATCH LIST then
check those names
you wish to
remove.
(Notice that you can
also RENAME WATCH
LIST and DELETE
WATCH LIST)

31
Exercise 4: Create or Add to a Watch List, continued
9. The Remove students from list window will open telling you that “The following
students will be removed from the list.
Press OK, or cancel.

32
Additional Information
There will be more to choose from the ATTENDANCE/DISCIPLINE and GRADES tabs. You
check off those columns you wish to have as your permanent view, and select the SAVE
COLUMNS on the bar above. You can CANCEL or RESET COLUMNS back to the original
view at any time you wish to make changes.
Using the EXPORT ALL, PRINT, SUPPORT, and LOG OUT icons
At any time, you can use the icons at the top right of the page to: 1. EXPORT ALL which will export the data into an Excel document;
You can use the EXPORT ALL button at the top right of the page to export all to an excel
file. See the below example:

33
2. PRINT. Depending upon how your computer/device is set up, you can print to a printer; or print to a PDF document. (You make the print selection.)
When the Print selection page appears; click on the ▼ icon in the Name window to open the
full window; scroll down to select which printer you want to use; or print to Adobe PDF or
PDFCreator. Then depress the OK button.

34
3. SUPPORT. For help use the SUPPORT icon which will bring you help.
Note: the SUPPORT button should you require help; the snapshot below shows the
Submit Request Window:
4. LOGOUT. Log Out when you are finished.
Information about the More icons under the DETAILS column
By selecting the More icon to the right in the DETAILS column you will see the following selections:
ATTENDANCE DETAILS

35
Daily Attendance Rate (Last Event
January 5, 2017)
More provides: Attendance Rate Chart
Historical Chart
▪ Days Absent (Last Event January 5,
2017)
More provides: Absences by Grading Period
▪ Unexcused Days Absent (Last
Event December 15, 2016)
More provides: Unexcused Absences by
Grading Period
Class Period Absence Rate (Last Event
January 5, 2017)
More provides: Calendar and Historical
Chart
Tardy Rate (Last Event October 4, 2016) More provides: Calendar and Historical
Chart DISCIPLINE DETAILS
Discipline Referrals (No Incidents Found) More Incidents Log
▪ State Reportable Offenses More Historical Chart
▪ School Code of Conduct More Historical Chart
You can always HIDE PRIOR YEAR information. (See tab at top of Details column).