1 torricelli’s barometer. 2 a simple manometer for measuring gas pressure in a container
Post on 21-Dec-2015
222 views
TRANSCRIPT
1
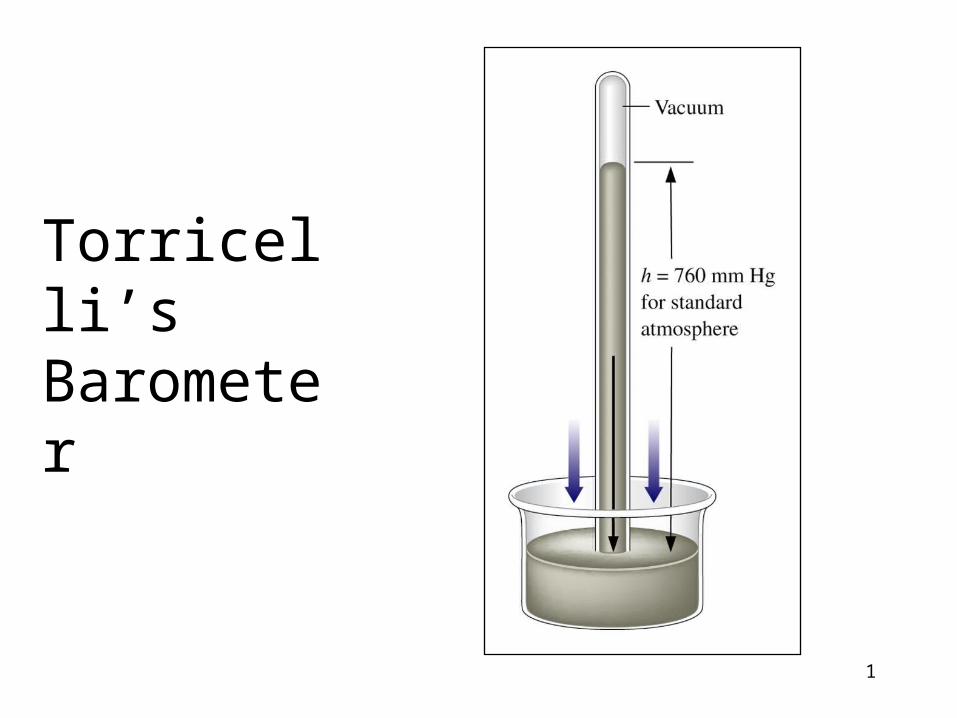
Torricelli’s Barometer
2
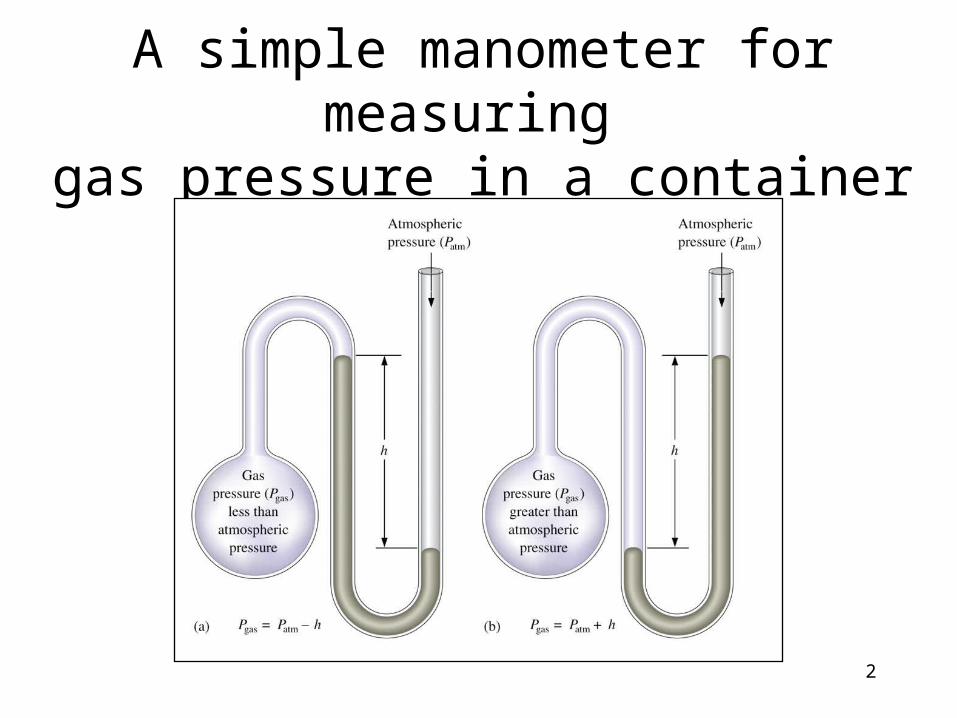
A simple manometer for measuring gas pressure in a container
3
Robert Boyle
4
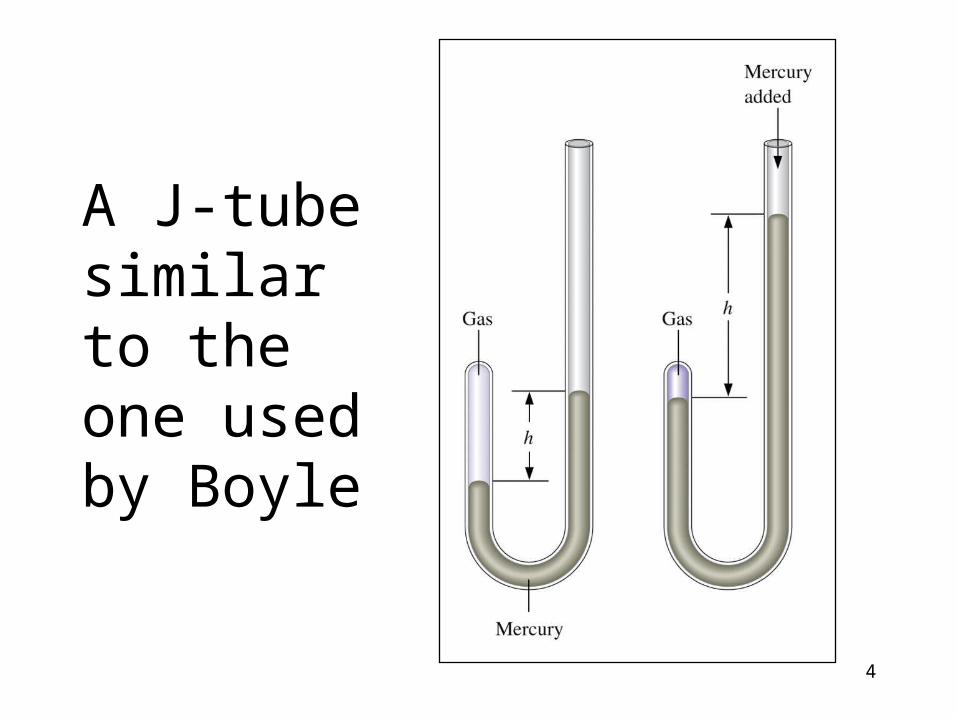
A J-tube similar to the one used by Boyle
5
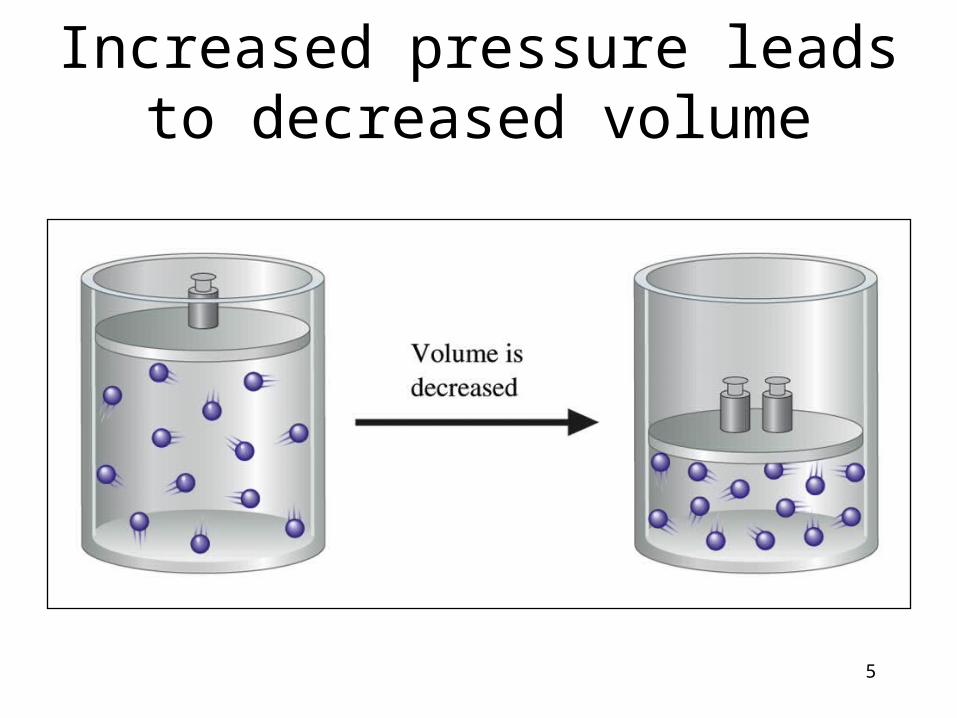
Increased pressure leads to decreased volume
6
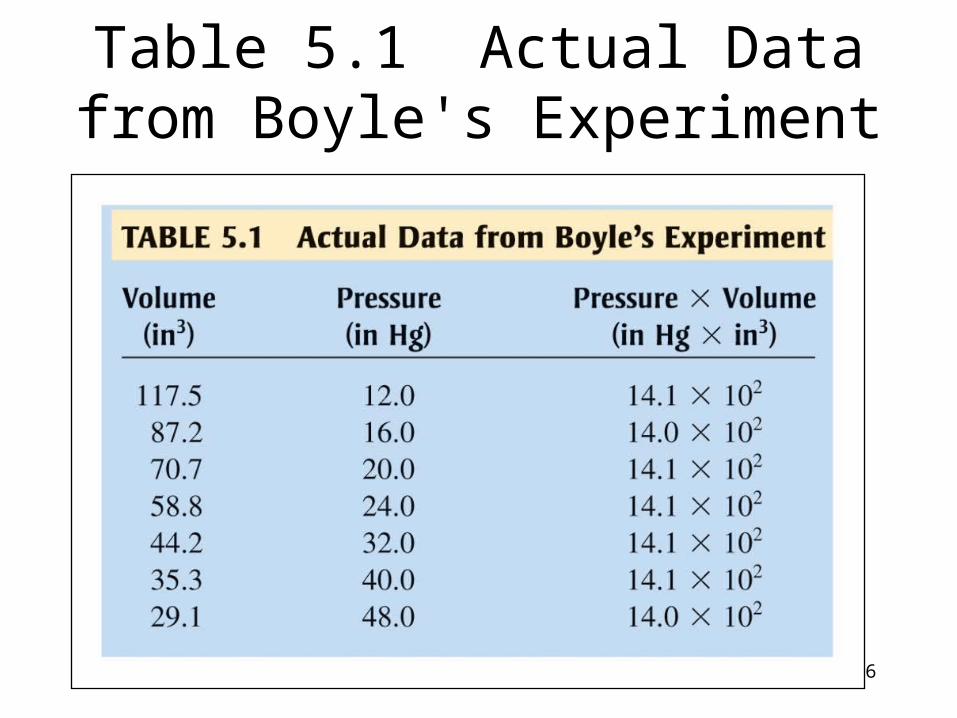
Table 5.1 Actual Data from Boyle's Experiment
7
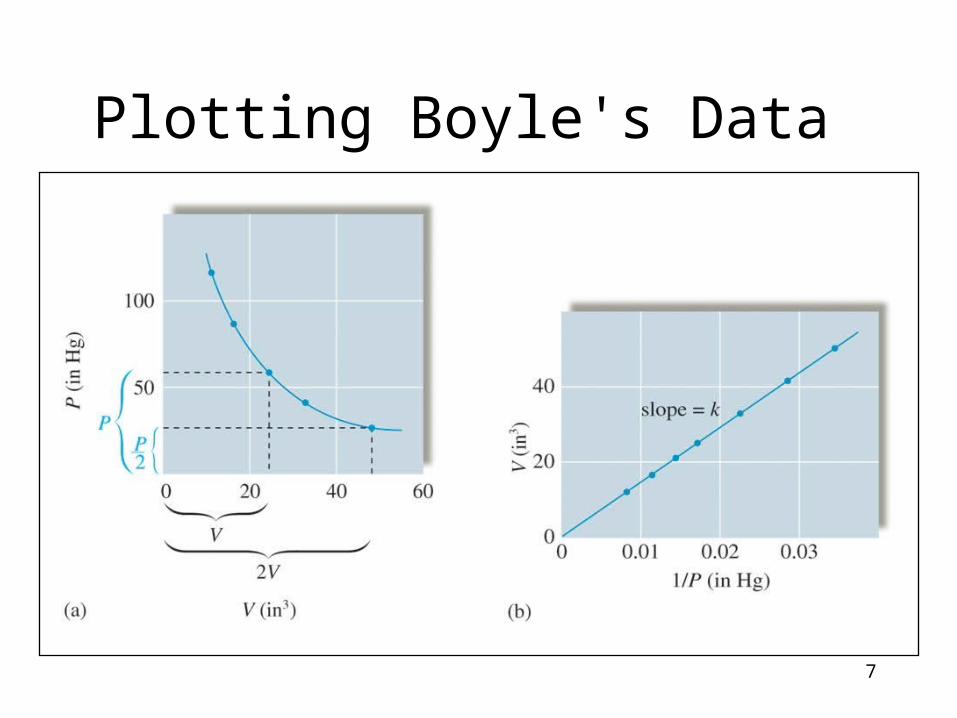
Plotting Boyle's Data
8
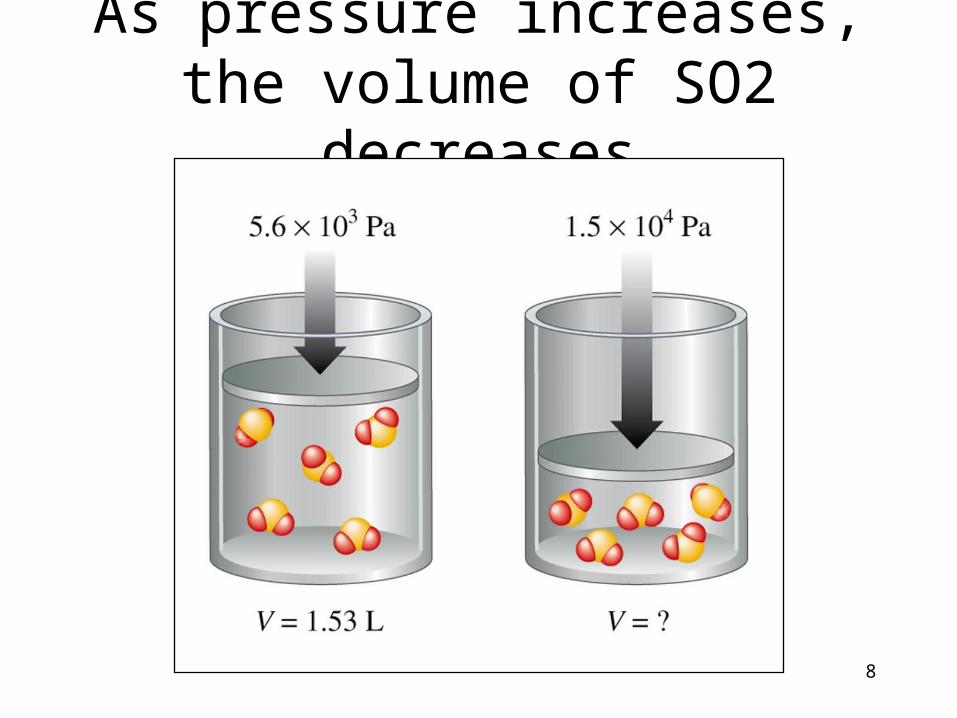
As pressure increases, the volume of SO2 decreases
9
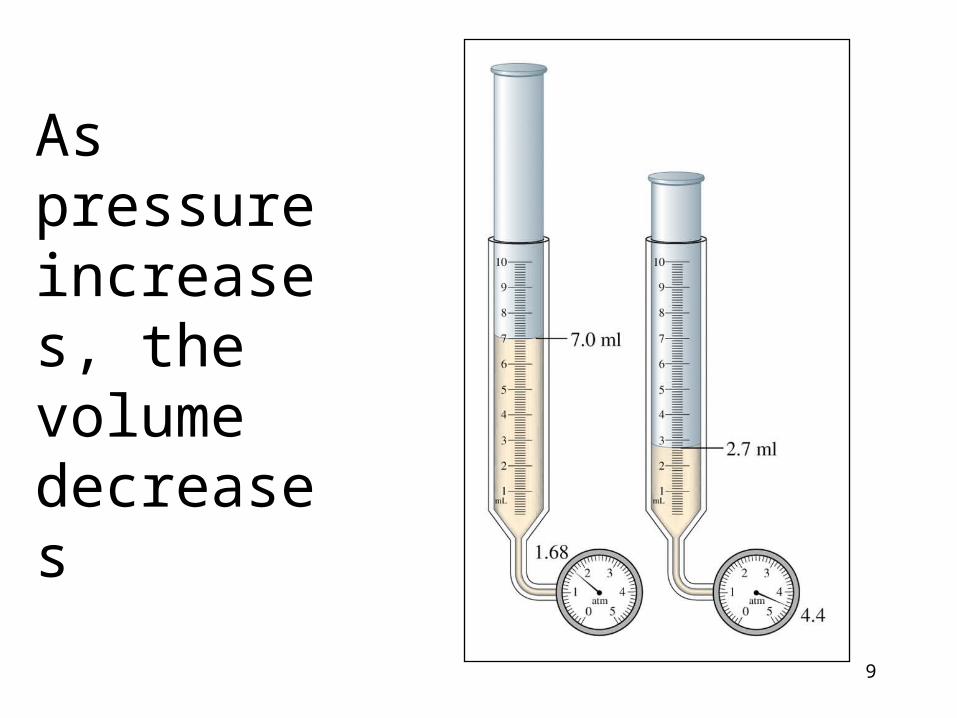
As pressure increases, the volume decreases
10
Antoine and Marie Lavoisier(Painting by Jacques-Louis David)
11
Empress Eugenie of France(Painting by Franz Winterhalter)
12
Prof. Jacques Charles
13
14
15
16
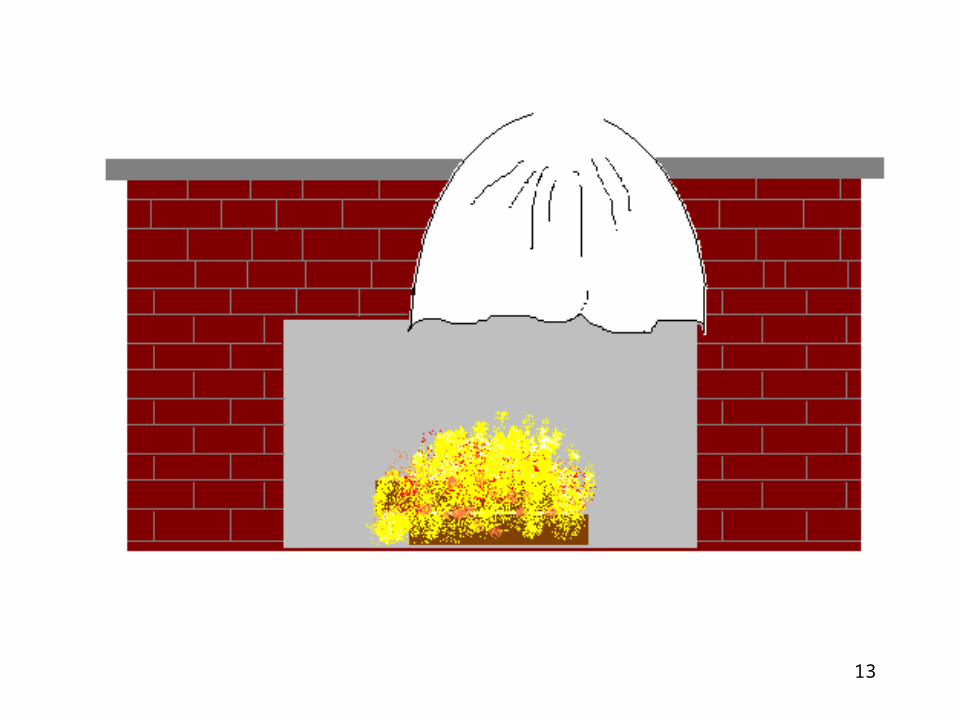
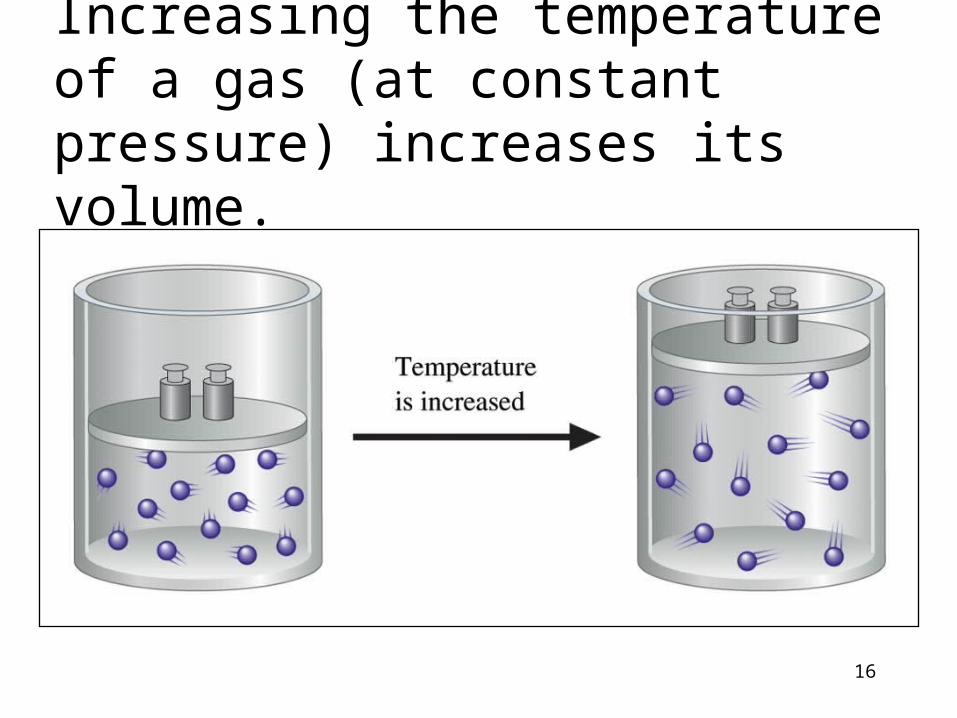
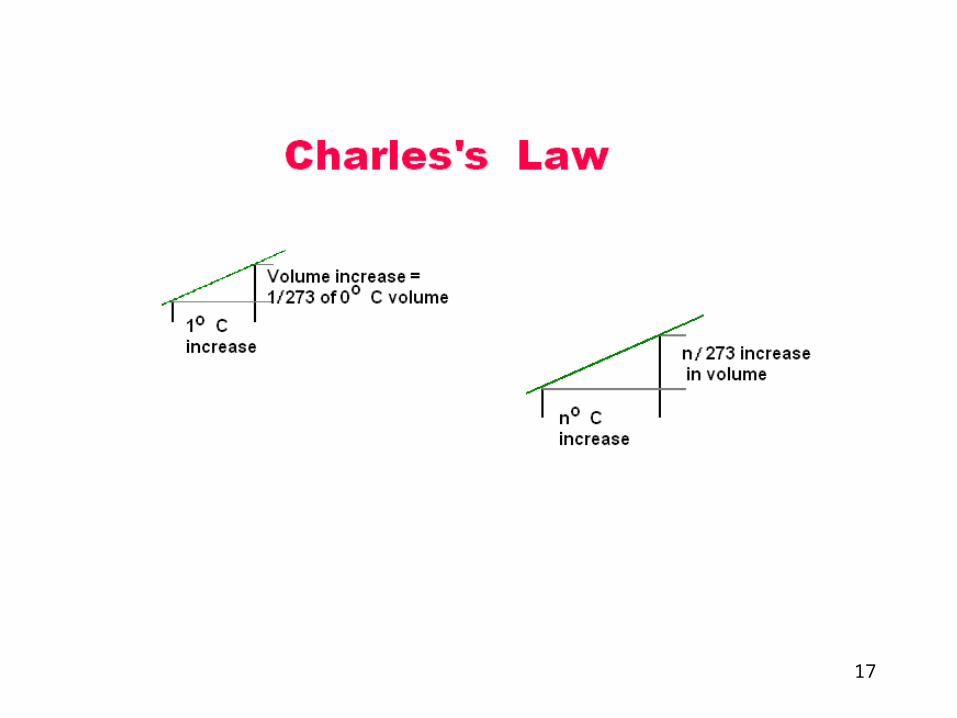
Increasing the temperature of a gas (at constant pressure) increases its volume.
17
18
19
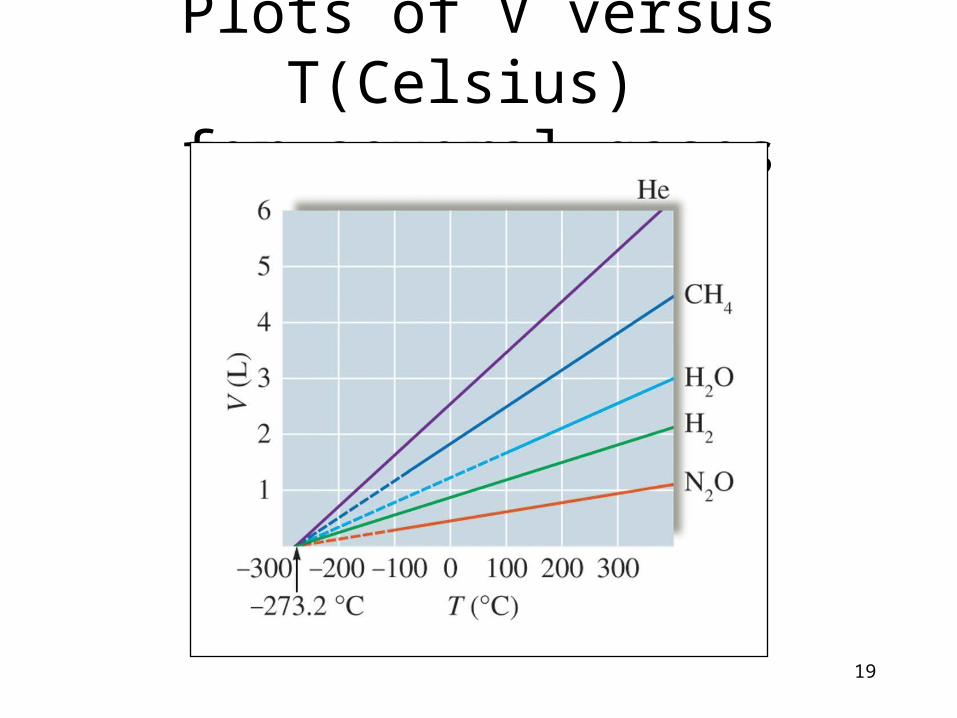
Plots of V versus T(Celsius) for several gases
20
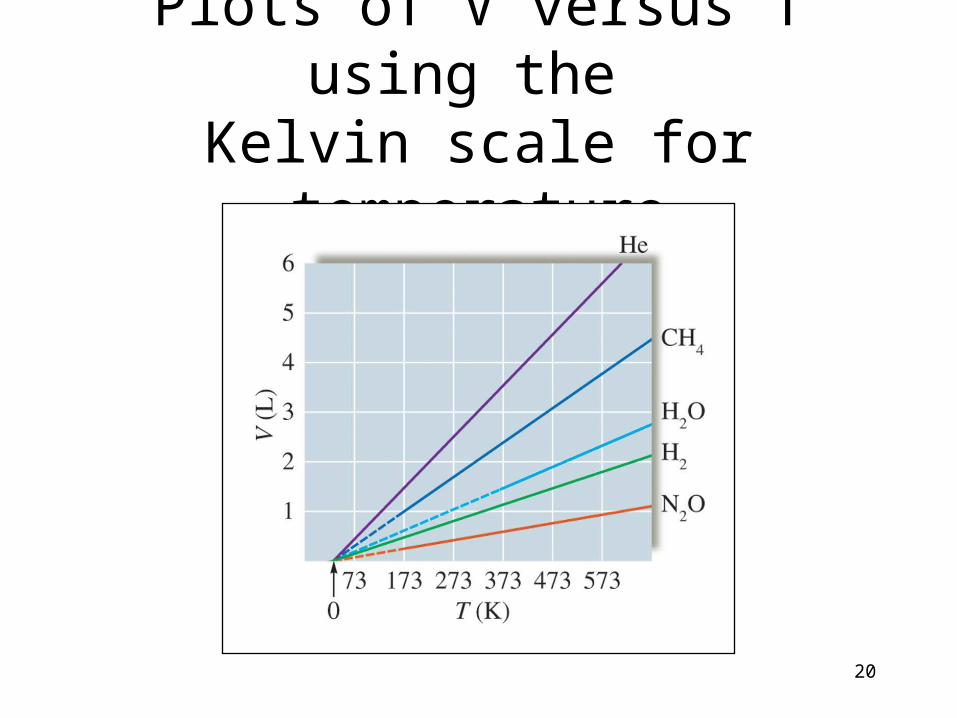
Plots of V versus T using the Kelvin scale for temperature
21
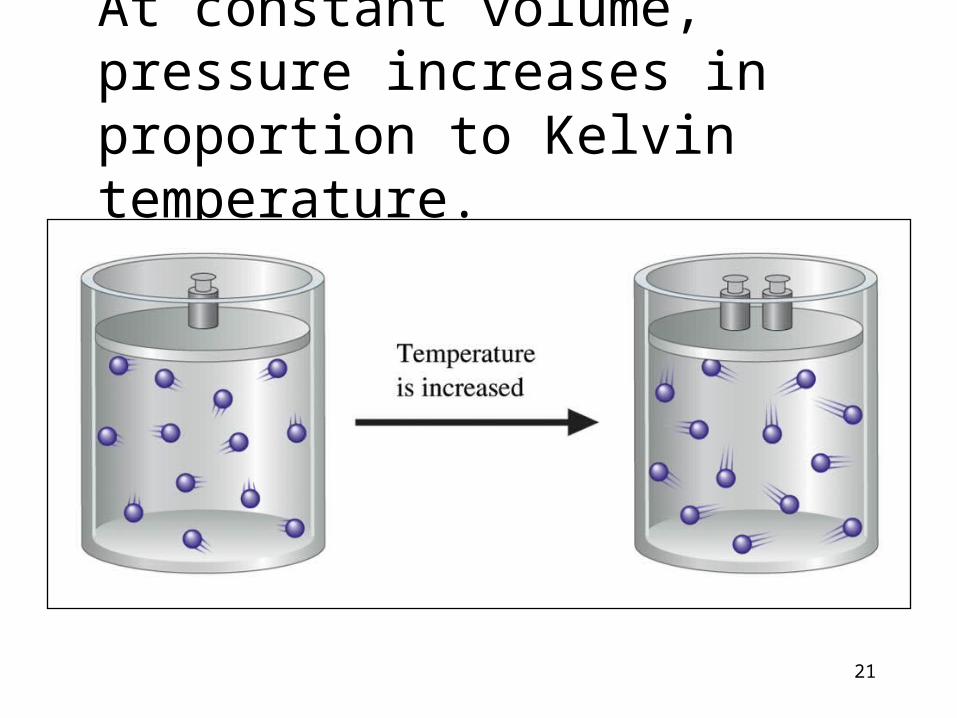
At constant volume, pressure increases in proportion to Kelvin temperature.
22
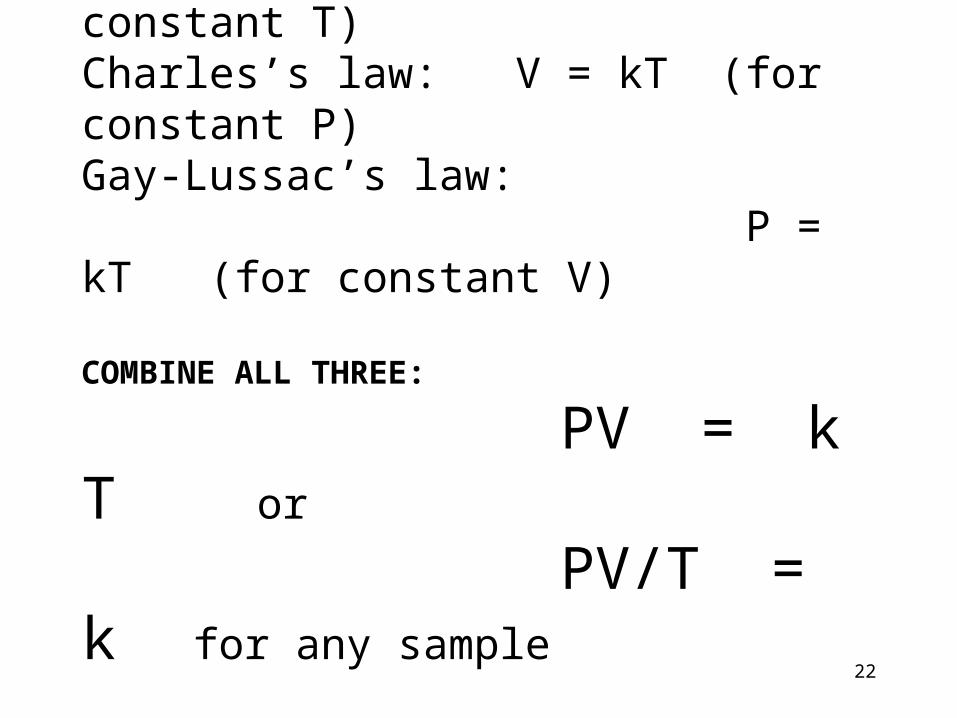
Boyle’s law: PV = k (for constant T)Charles’s law: V = kT (for constant P)Gay-Lussac’s law: P = kT (for constant V)
COMBINE ALL THREE:
PV = k T or
PV/T = k for any sample
23
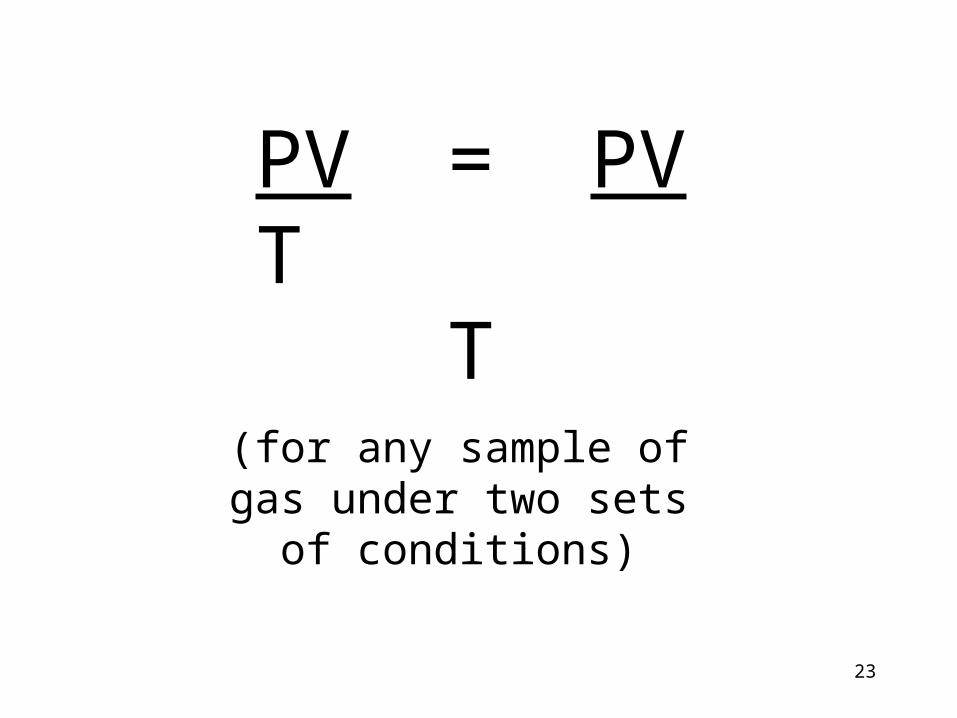
PV = PVT T
(for any sample of gas under two sets of conditions)

24
25
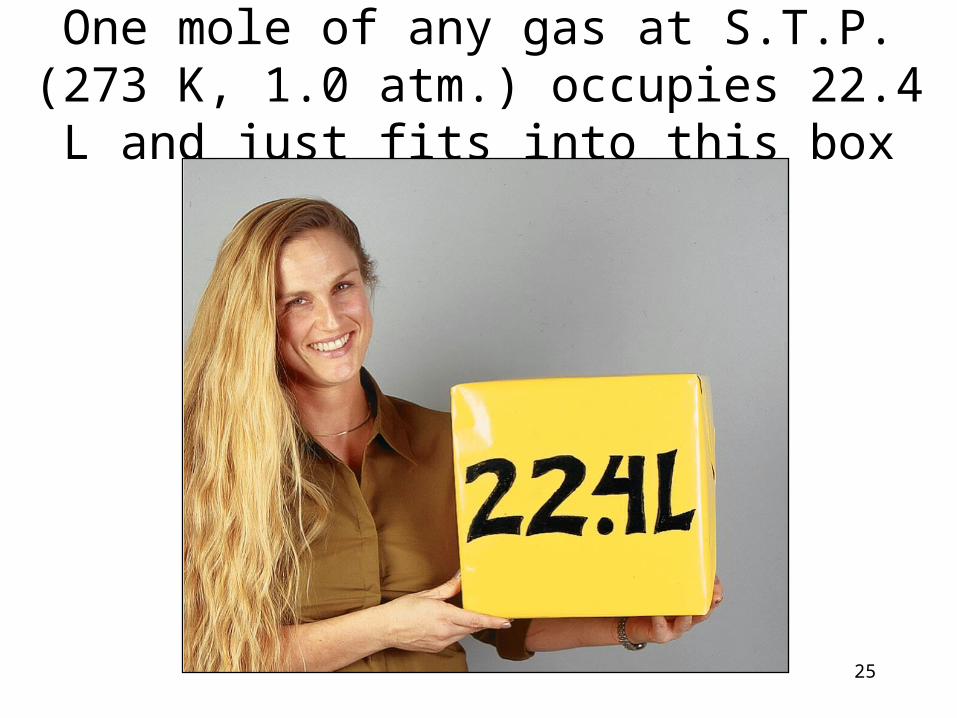
One mole of any gas at S.T.P. (273 K, 1.0 atm.) occupies 22.4 L and just fits into this box
26
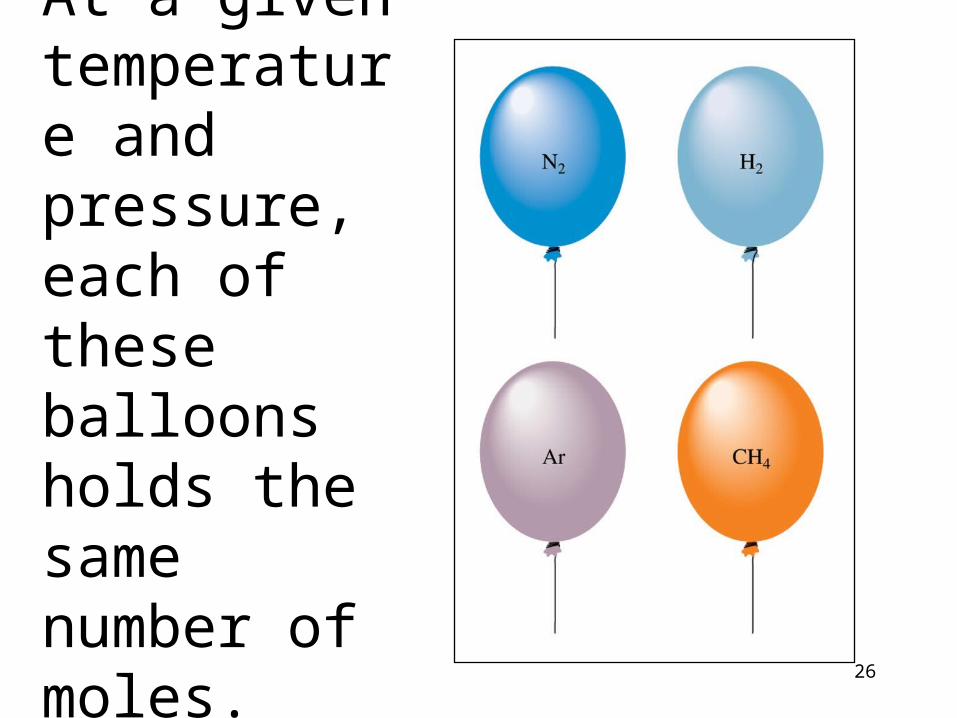
At a given temperature and pressure, each of these balloons holds the same number of moles.
27
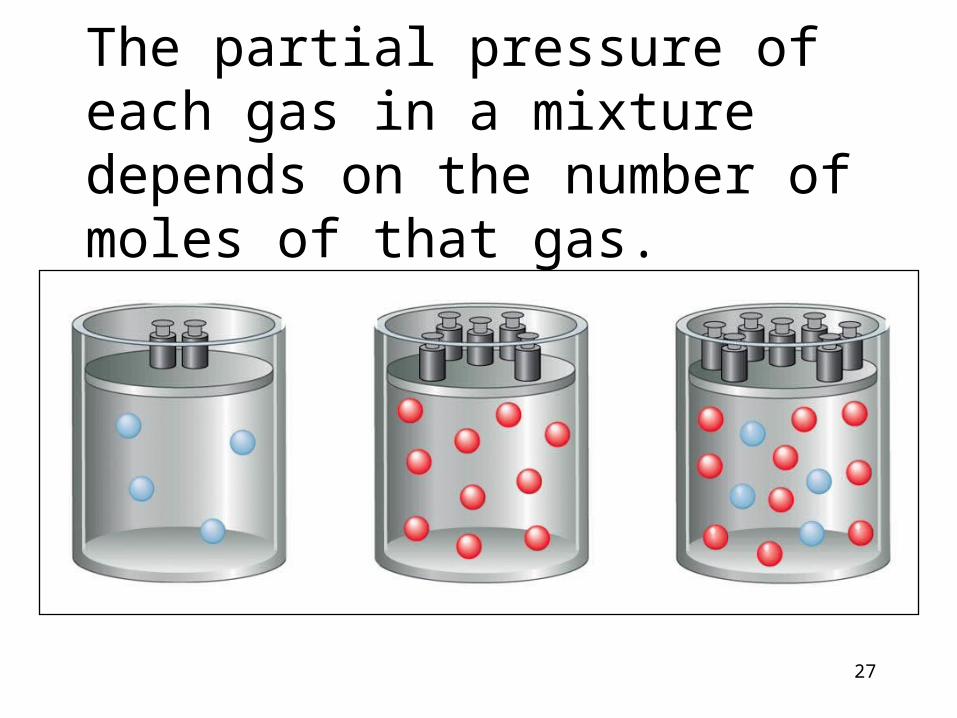
The partial pressure of each gas in a mixture depends on the number of moles of that gas.
28
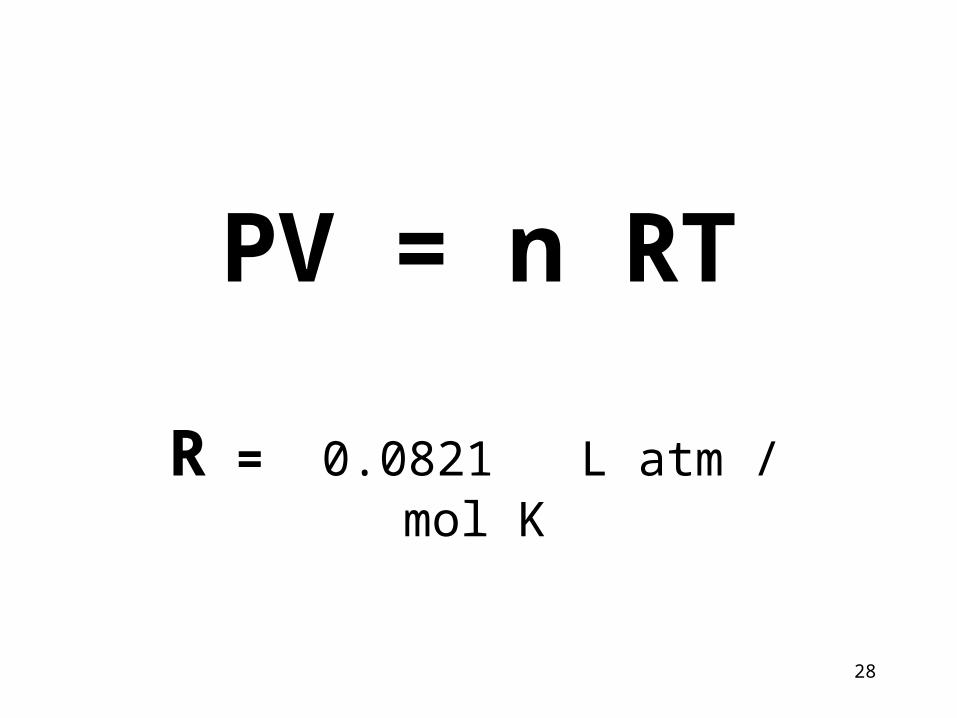
PV = n RT
R = 0.0821 L atm / mol K
29
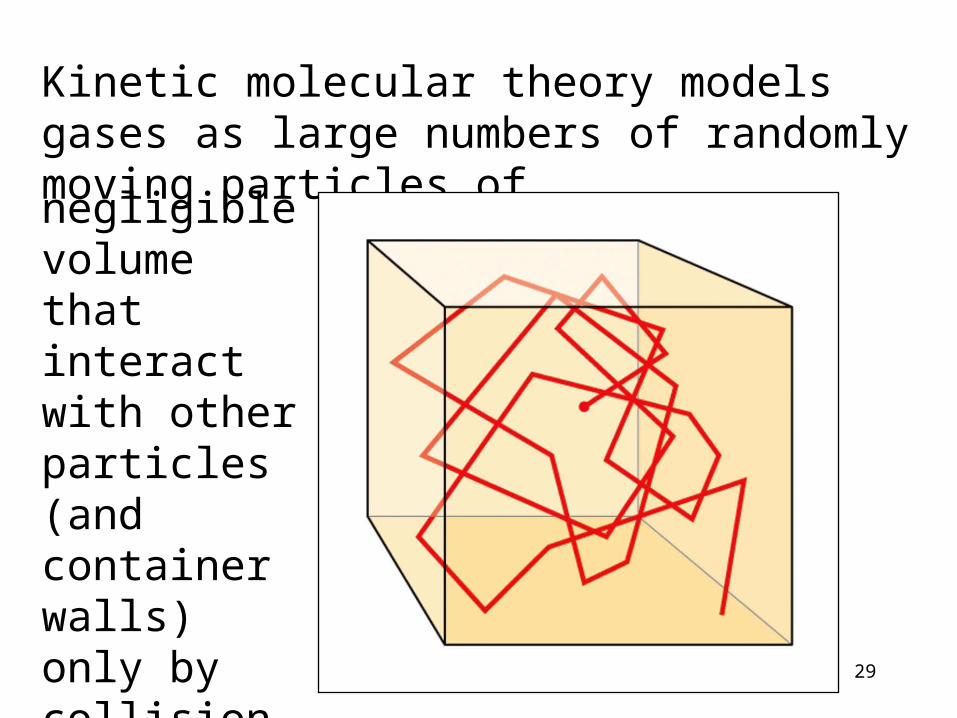
Kinetic molecular theory models gases as large numbers of randomly moving particles of negligible volume that interact with other particles (and container walls) only by collision.
30
The End

31
32
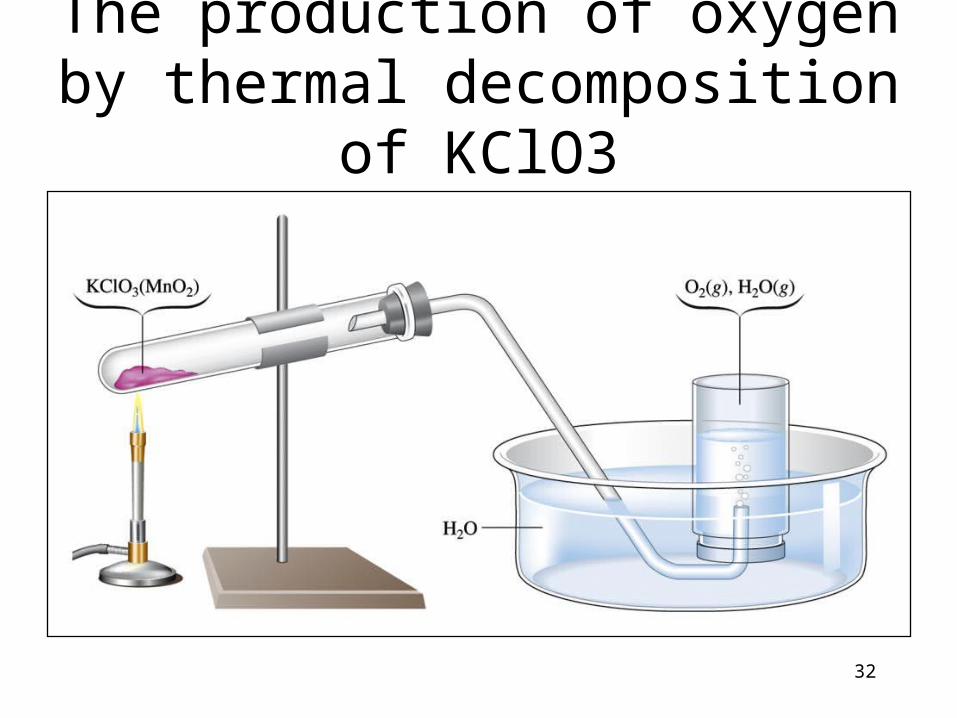
The production of oxygen by thermal decomposition of KClO3
33
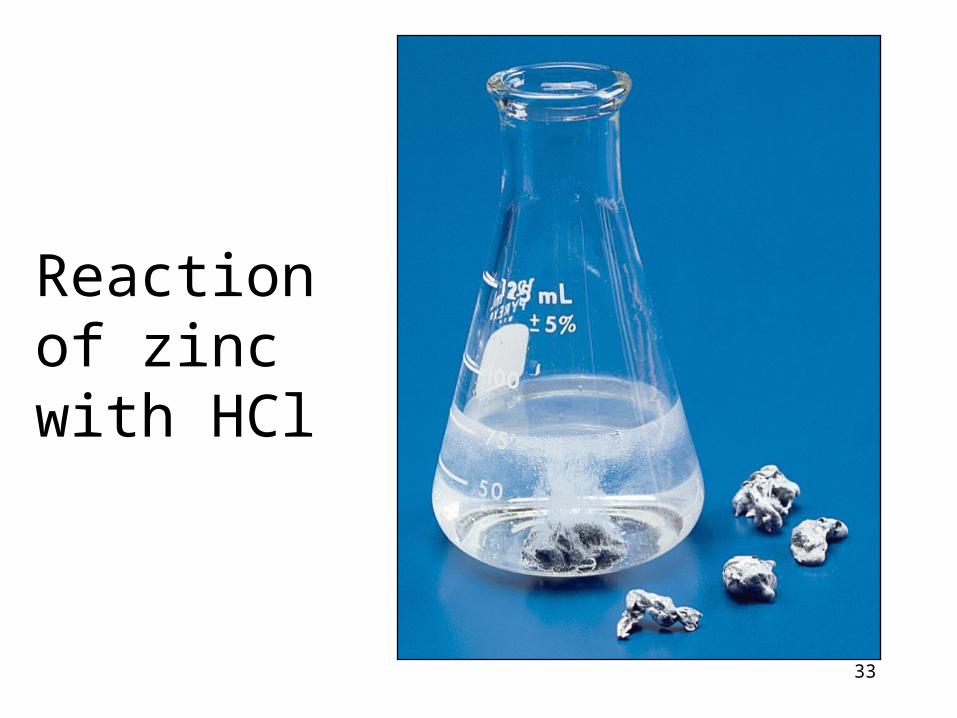
Reaction of zinc with HCl
34
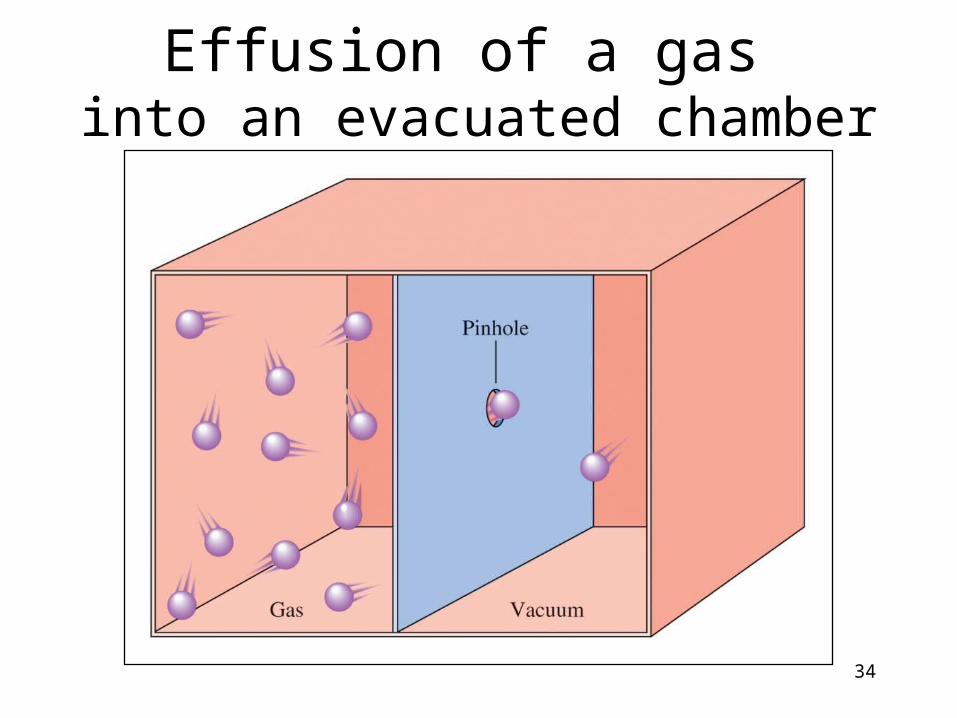
Effusion of a gas into an evacuated chamber
35
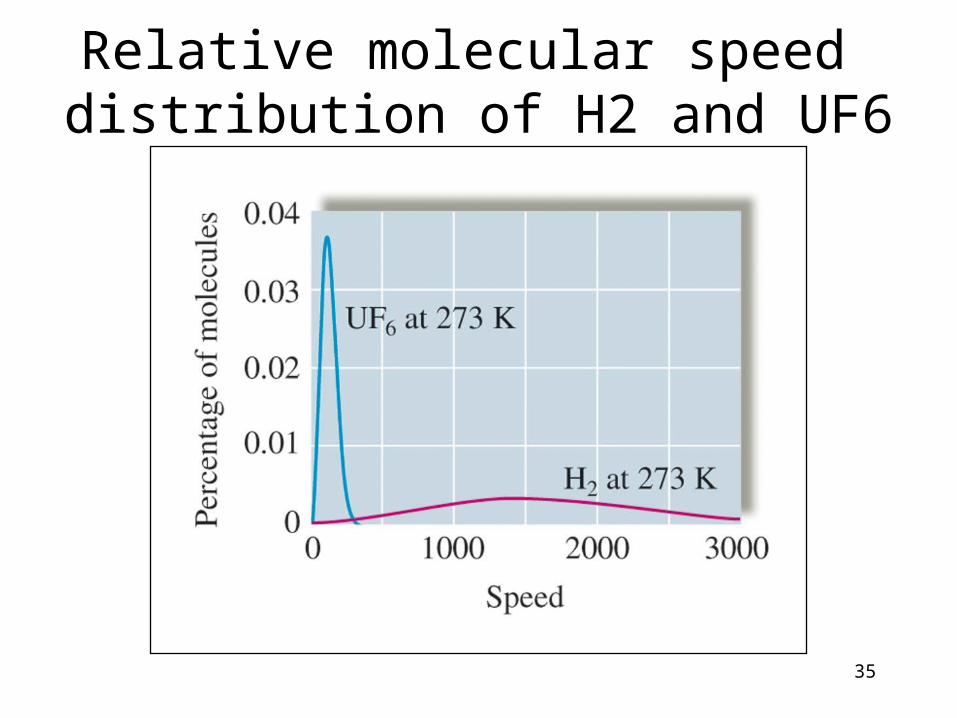
Relative molecular speed distribution of H2 and UF6
36
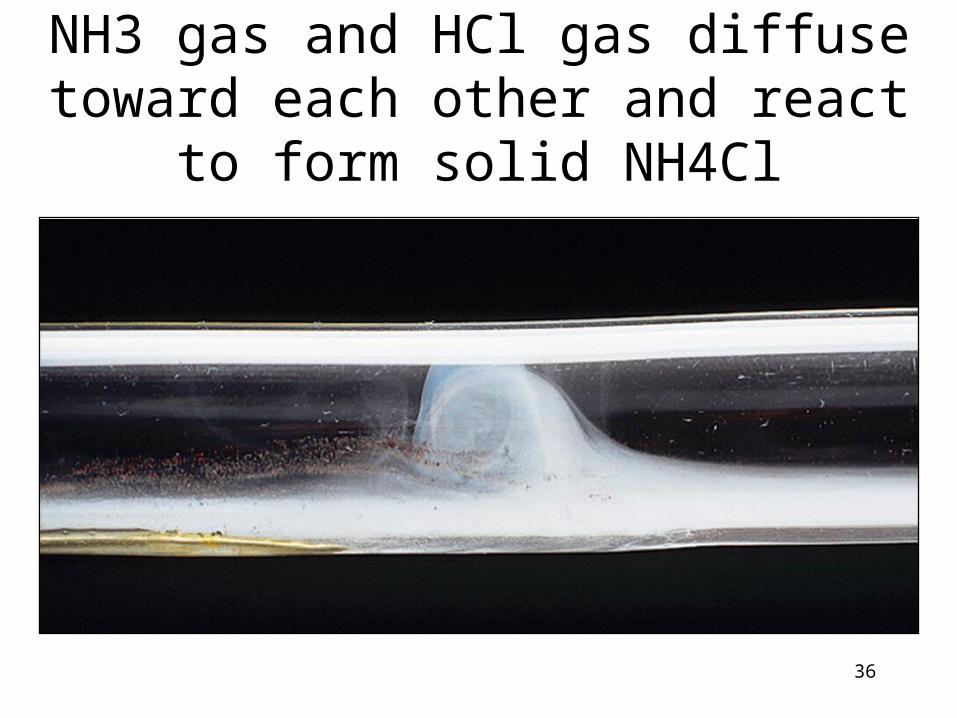
NH3 gas and HCl gas diffuse toward each other and react to form solid NH4Cl
37
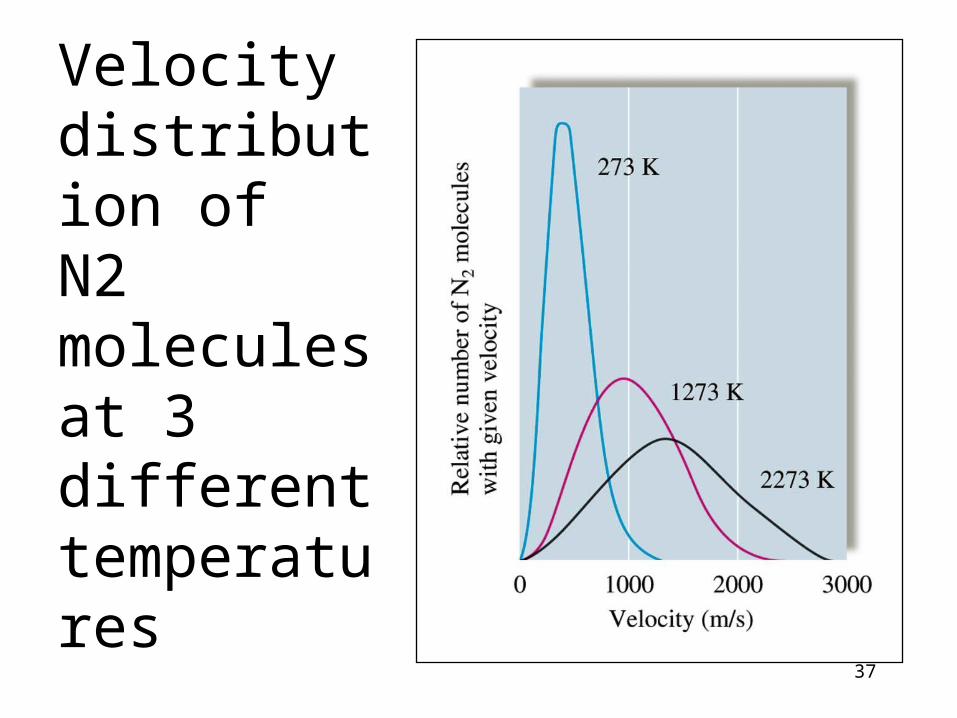
Velocity distribution of N2 molecules at 3 different temperatures
38
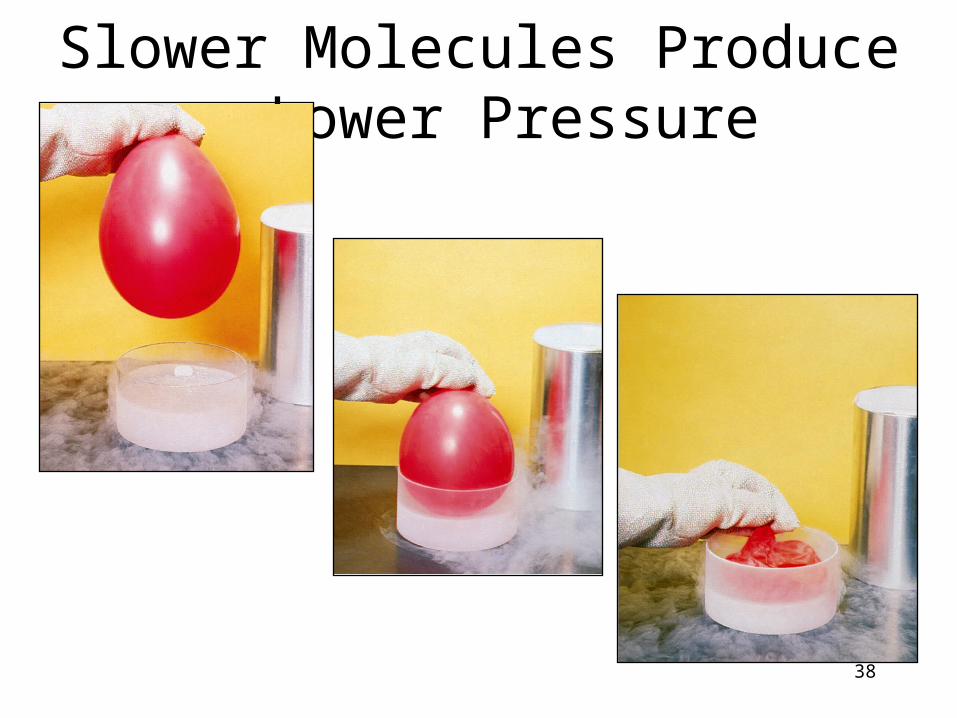
Slower Molecules Produce a Lower Pressure
39
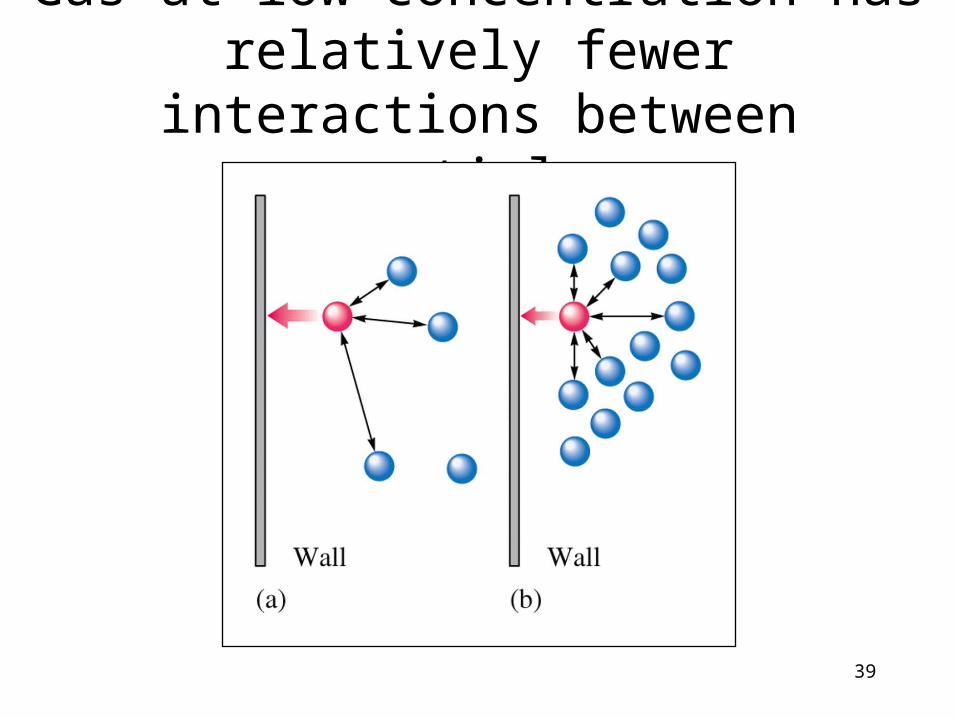
Gas at low concentration has relatively fewer interactions between particles
40
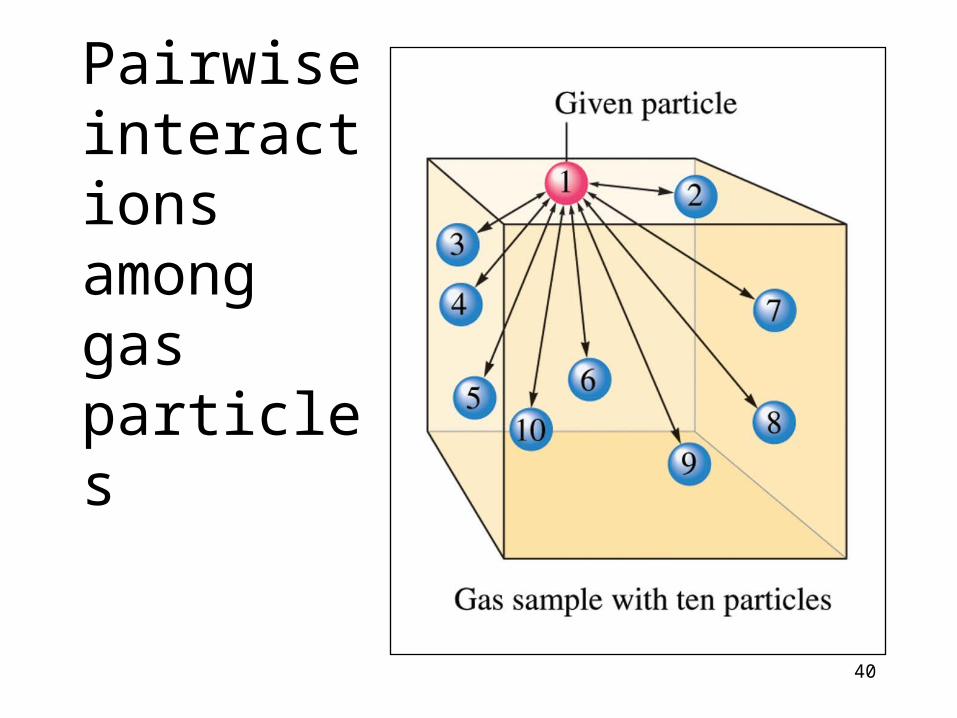
Pairwise interactions among gas particles
41
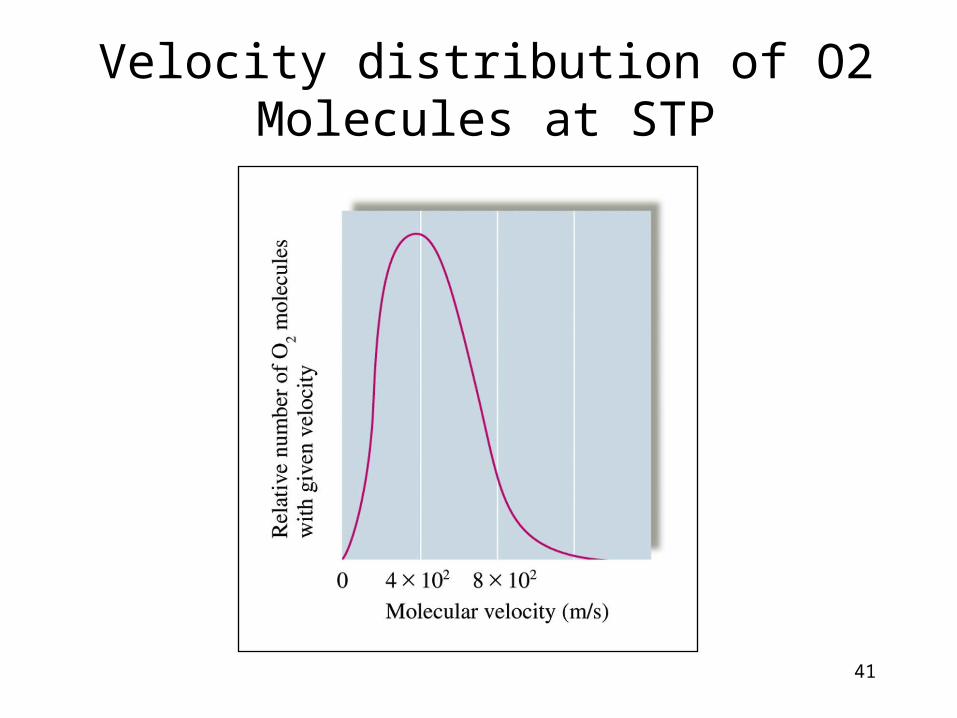
Velocity distribution of O2 Molecules at STP
42
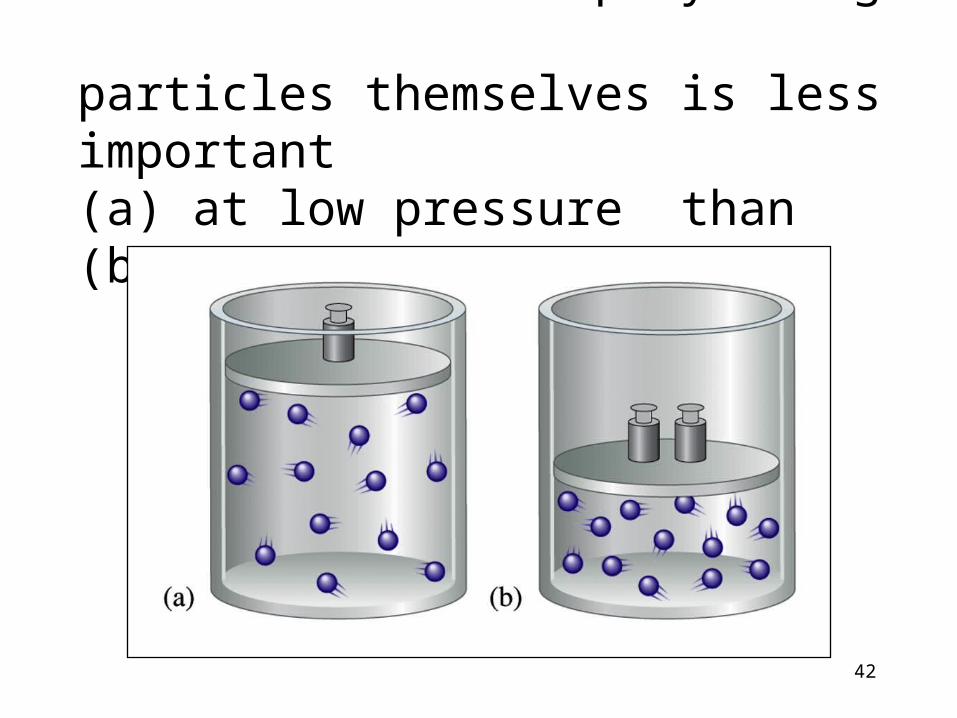
The volume taken up by the gas particles themselves is less important (a) at low pressure than (b) at high pressure.
43
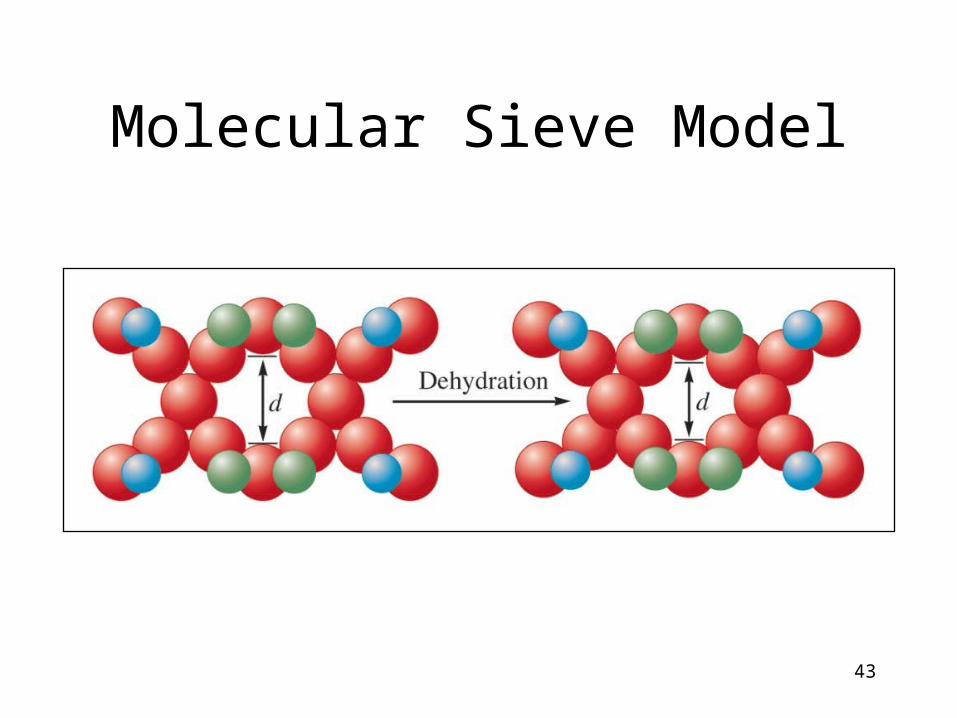
Molecular Sieve Model
44
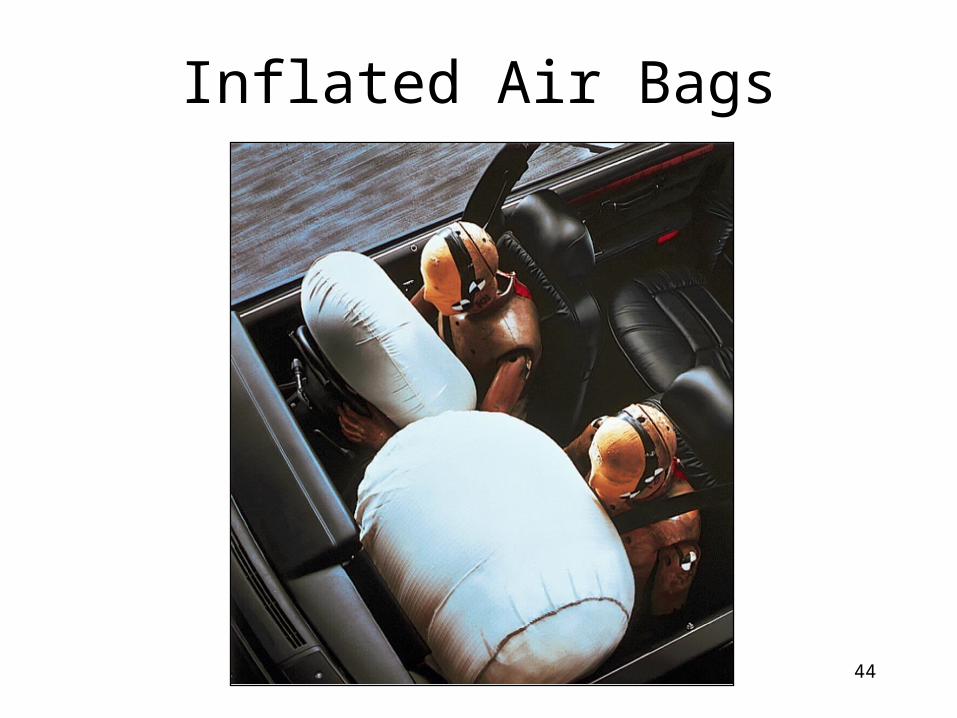
Inflated Air Bags
45
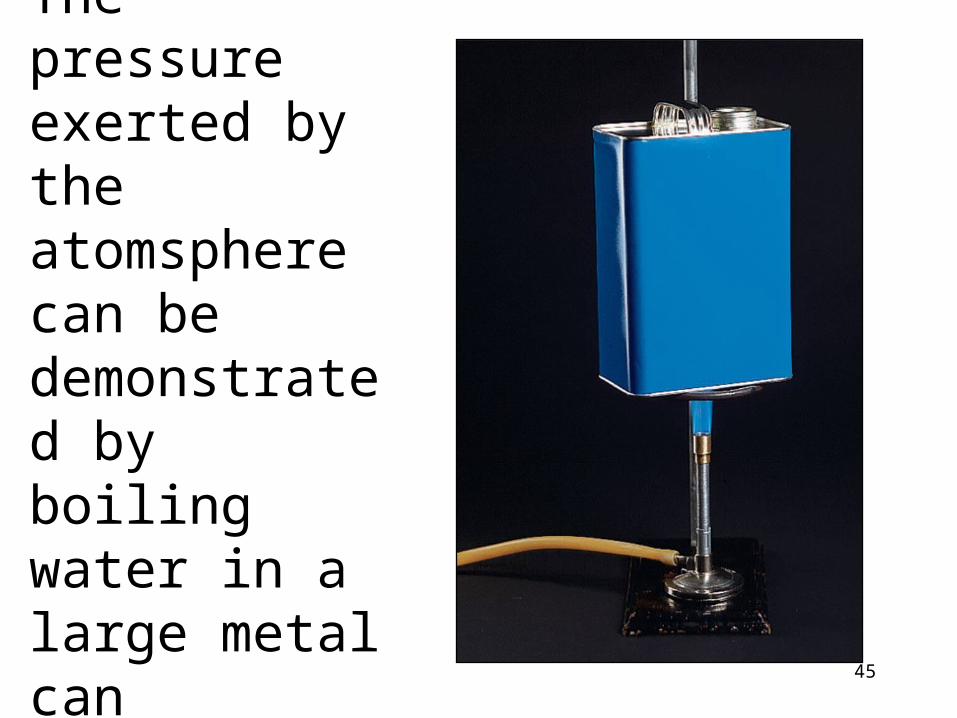
The pressure exerted by the atomsphere can be demonstrated by boiling water in a large metal can
46
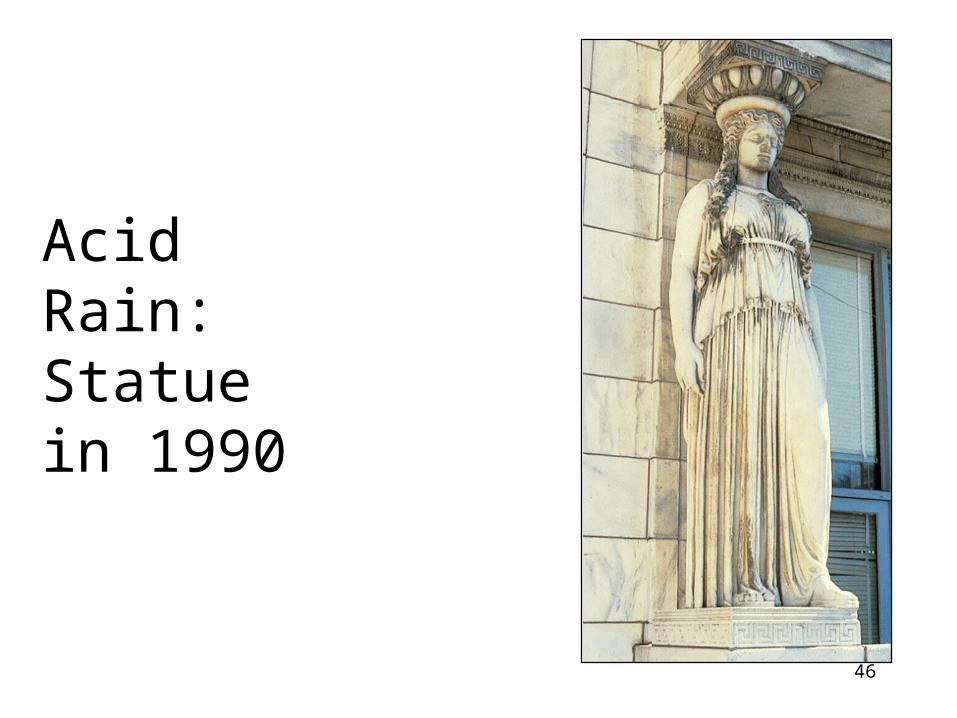
Acid Rain: Statue in 1990
47
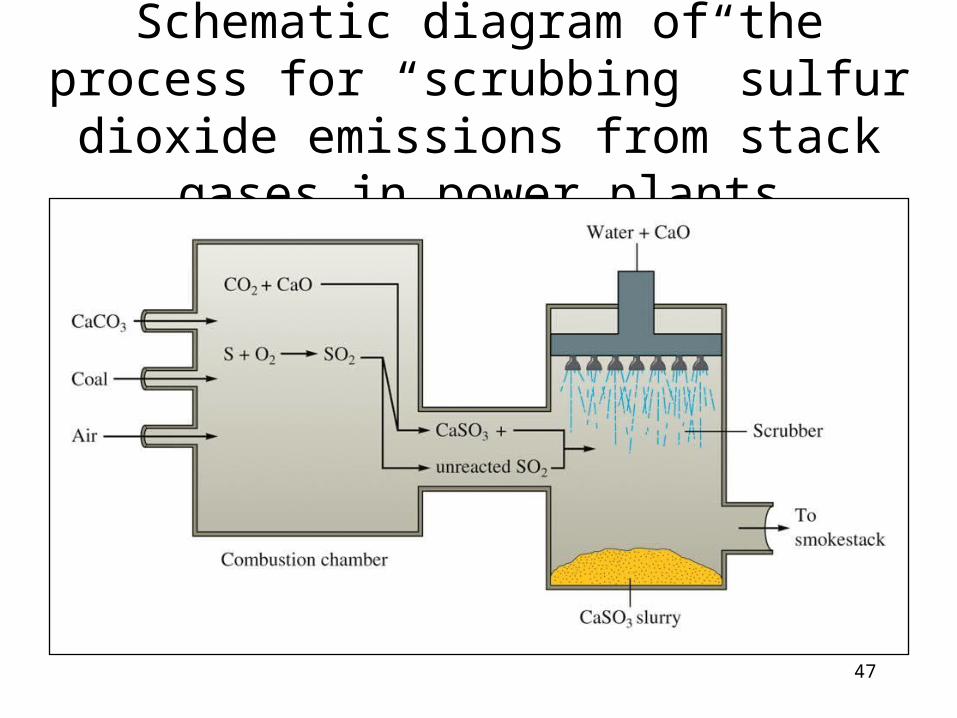
Schematic diagram of the process for “scrubbing” sulfur dioxide emissions from
stack gases in power plants
48
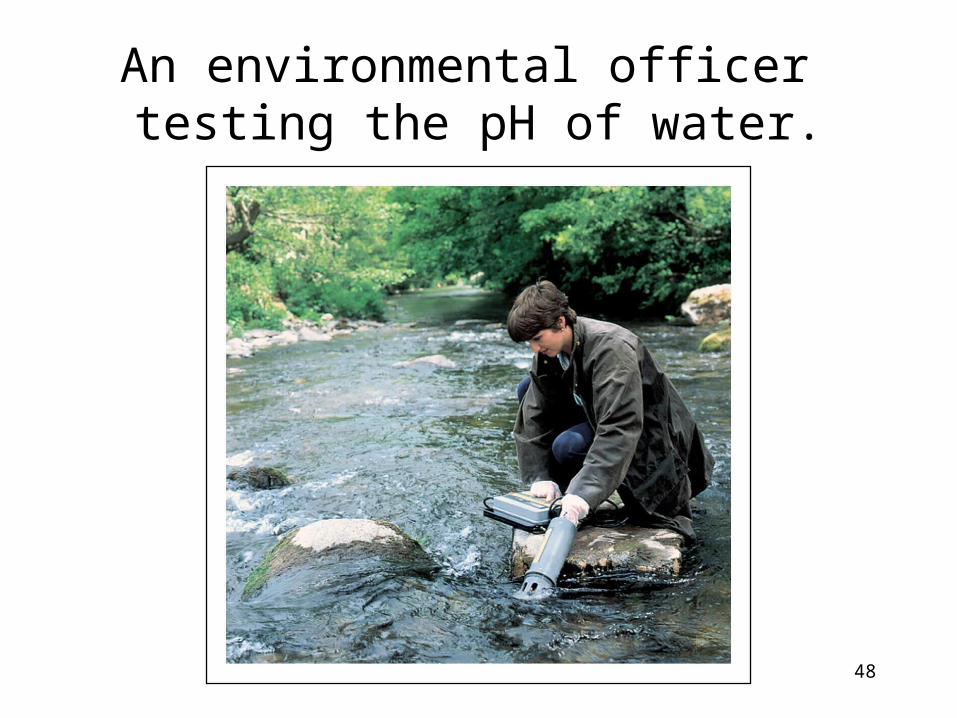
An environmental officer testing the pH of water.
49
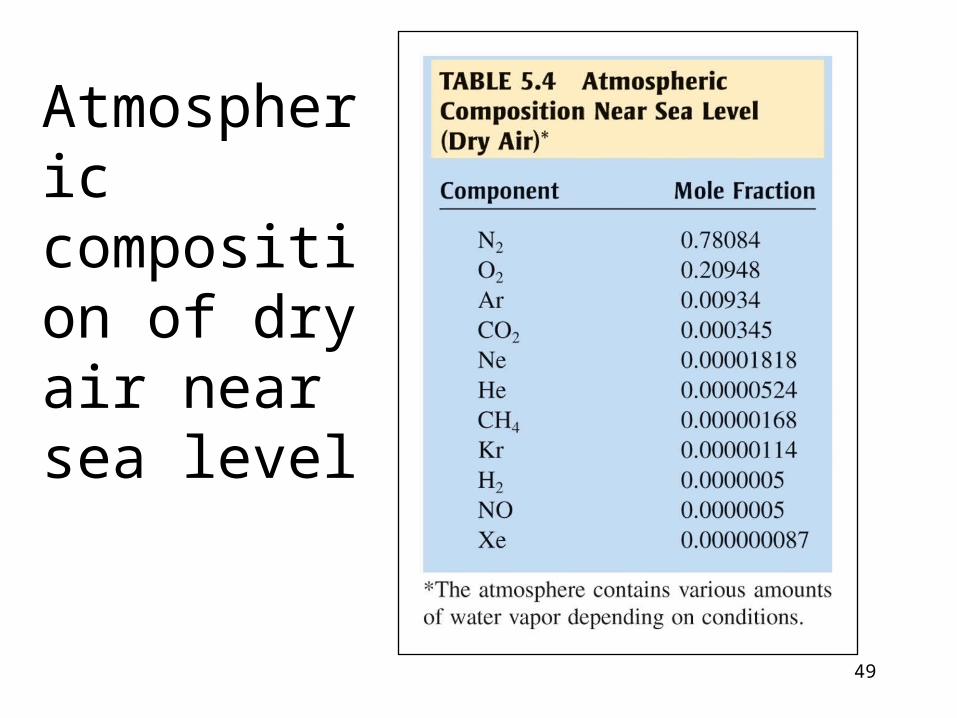
Atmospheric composition of dry air near sea level
50
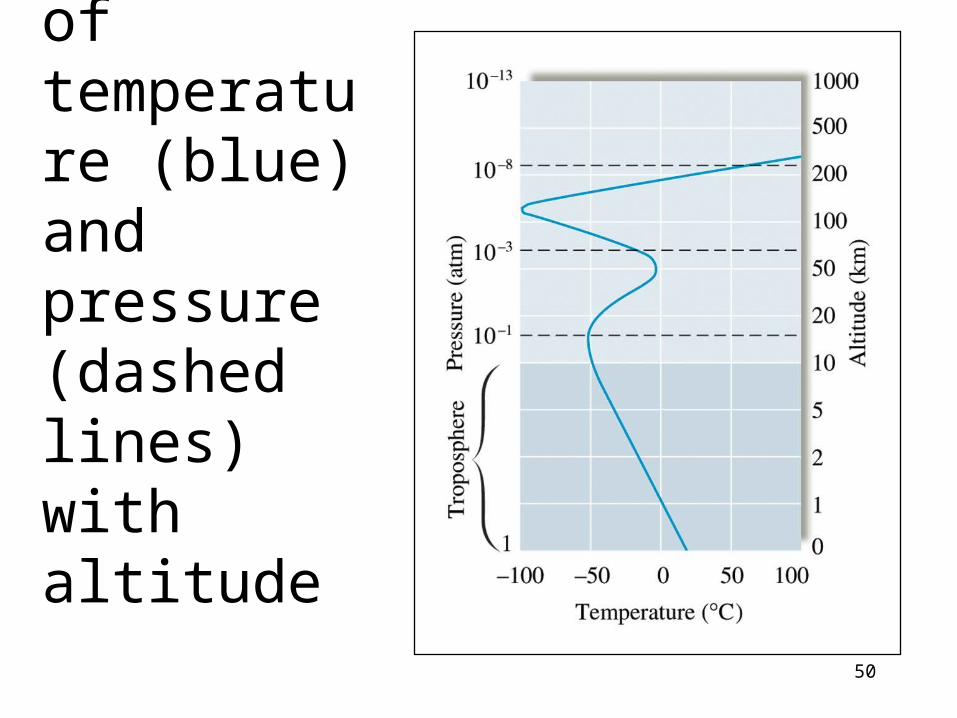
Variation of temperature (blue) and pressure (dashed lines) with altitude
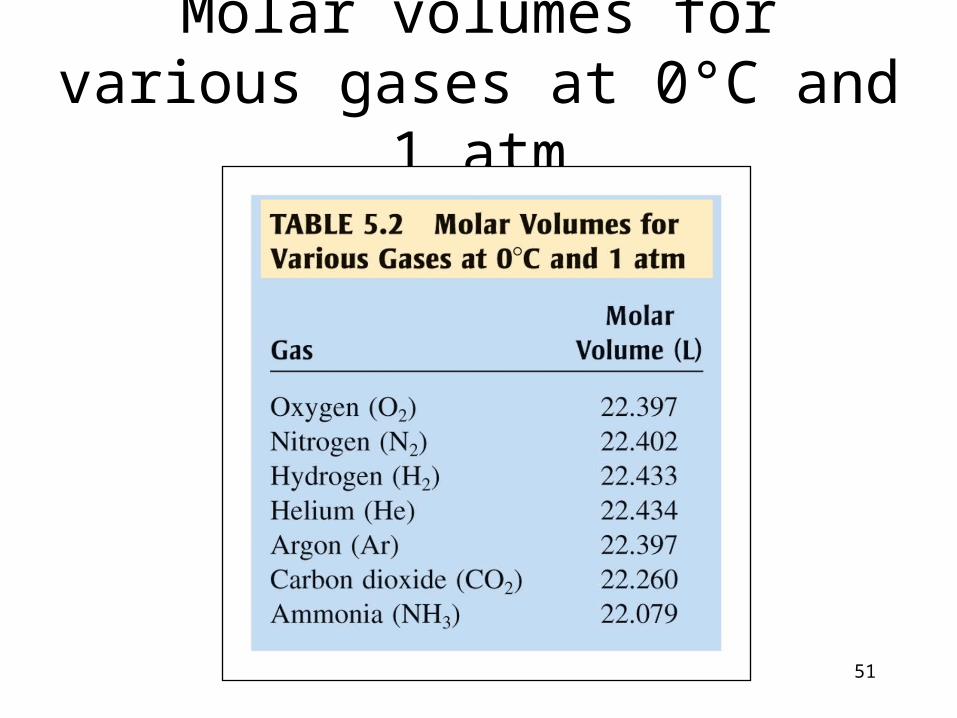
51
Molar volumes for various gases at 0°C and 1 atm
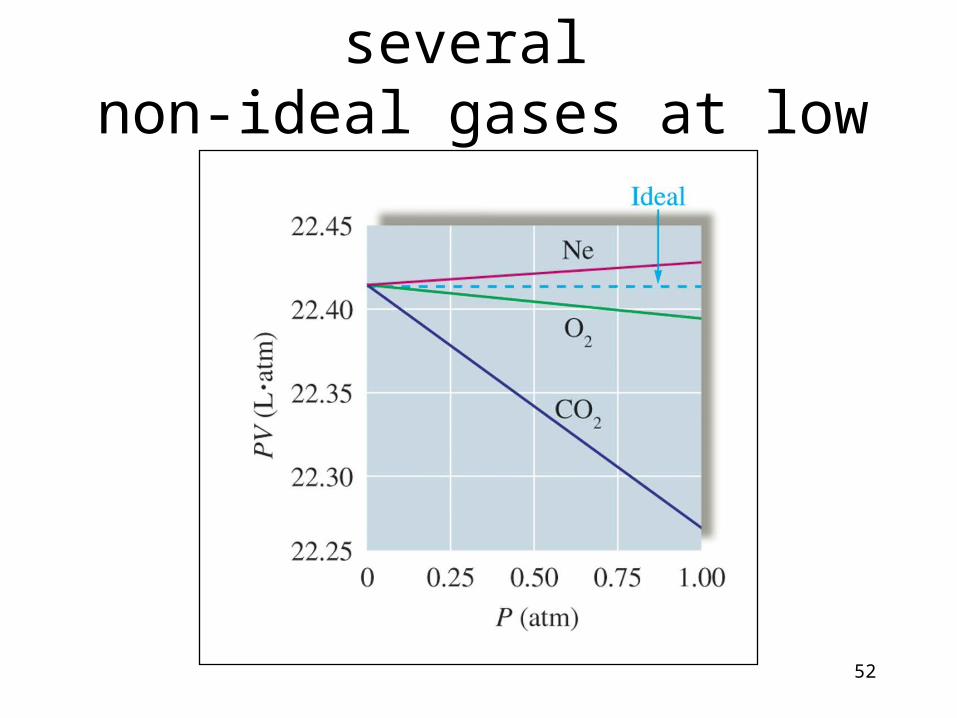
52
Plot of PV versus P for several non-ideal gases at low pressure
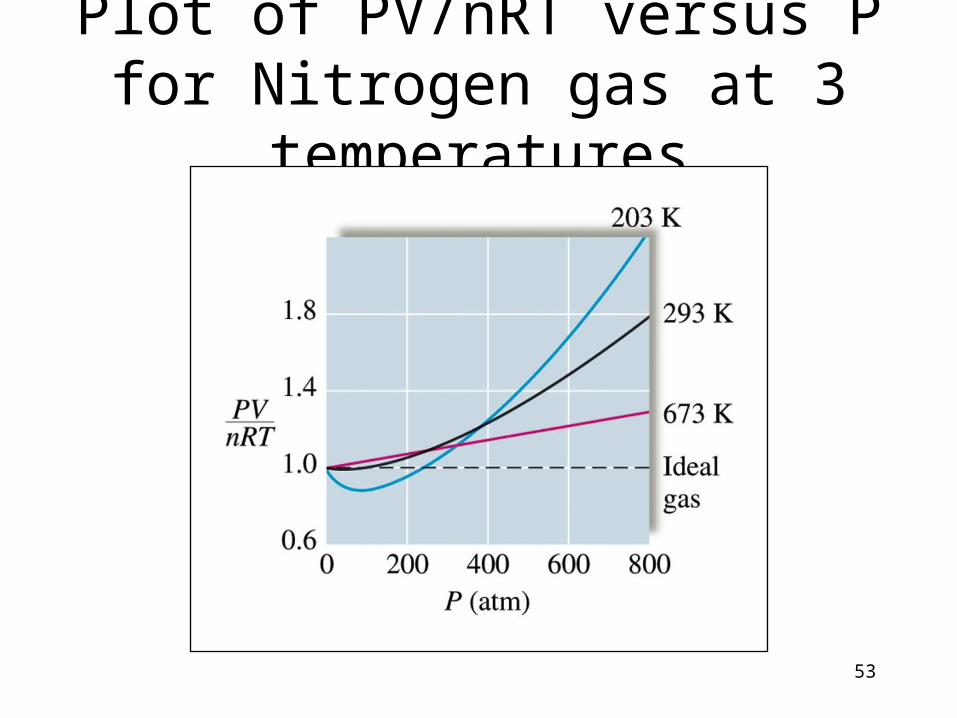
53
Plot of PV/nRT versus P for Nitrogen gas at 3 temperatures
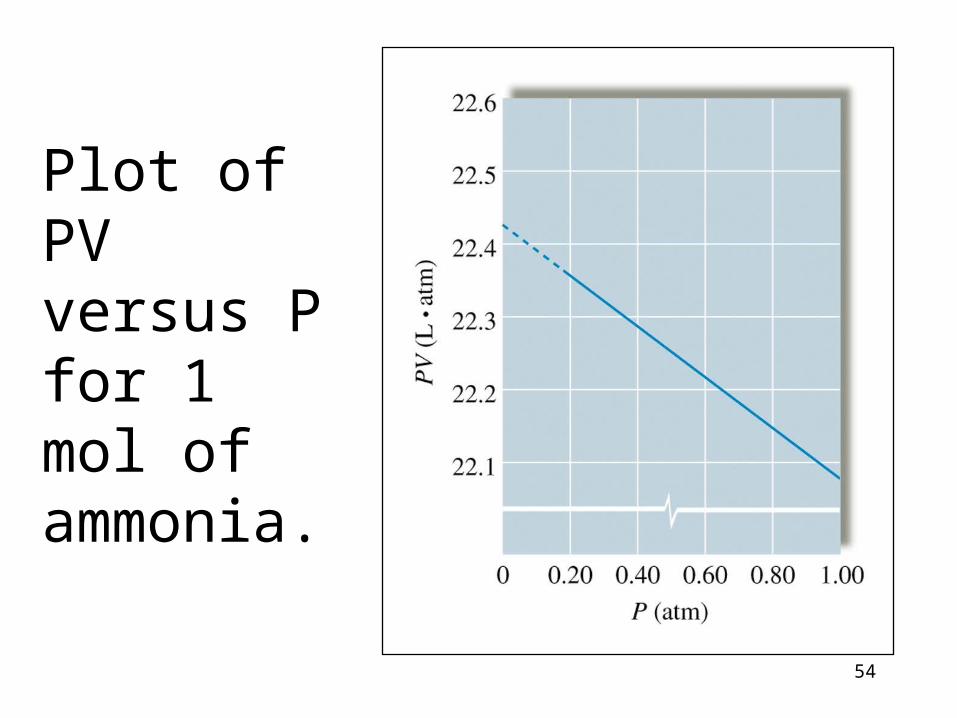
54
Plot of PV versus P for 1 mol of ammonia.
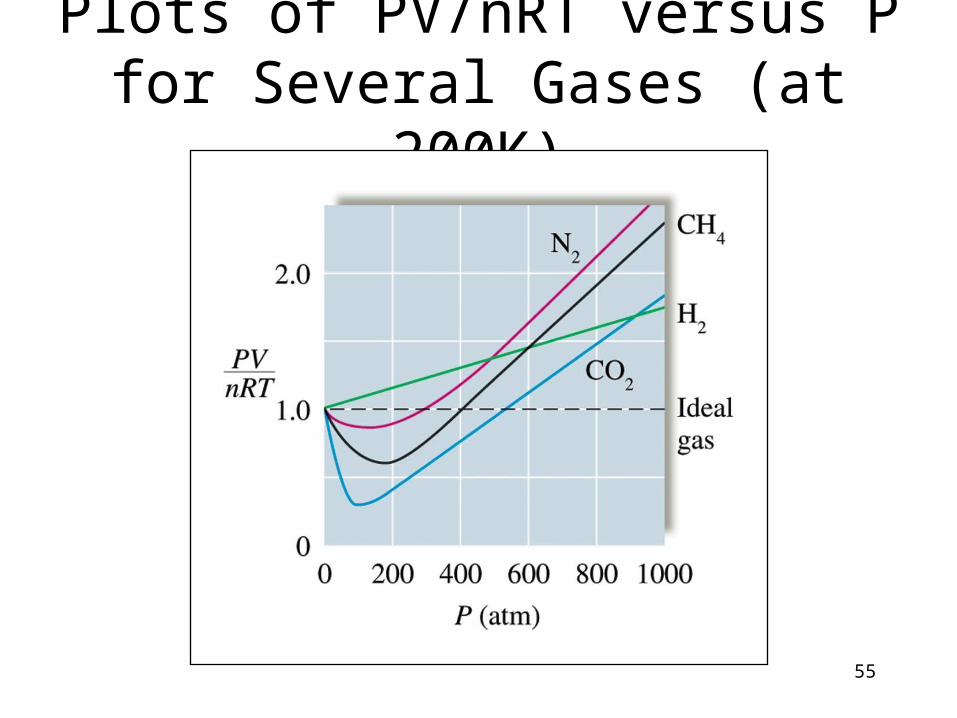
55
Plots of PV/nRT versus P for Several Gases (at 200K)
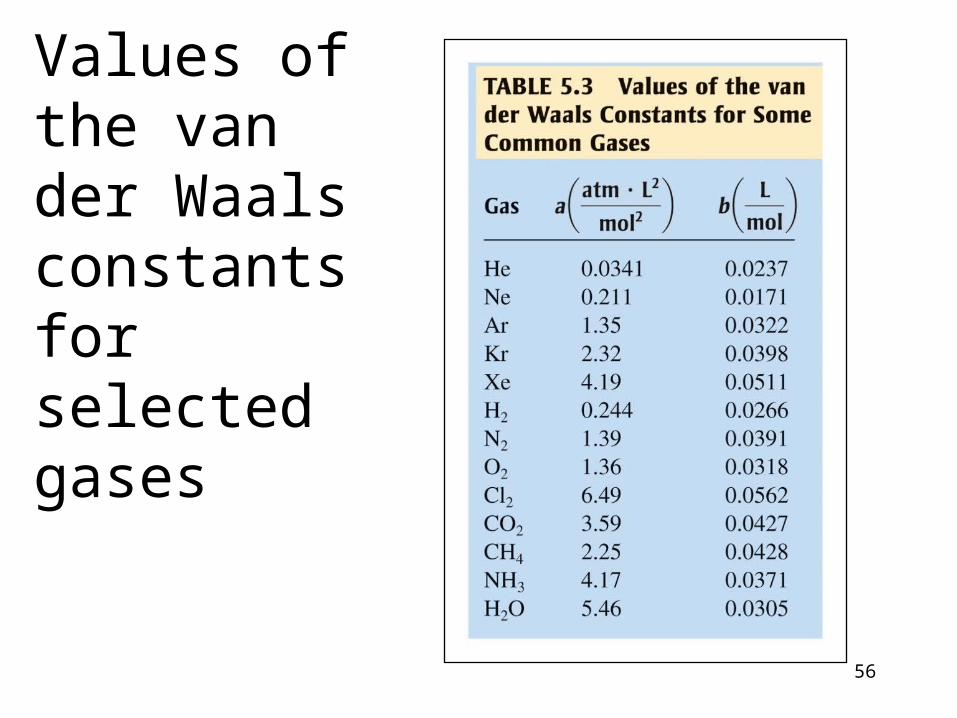
56
Values of the van der Waals constants for selectedgases
57
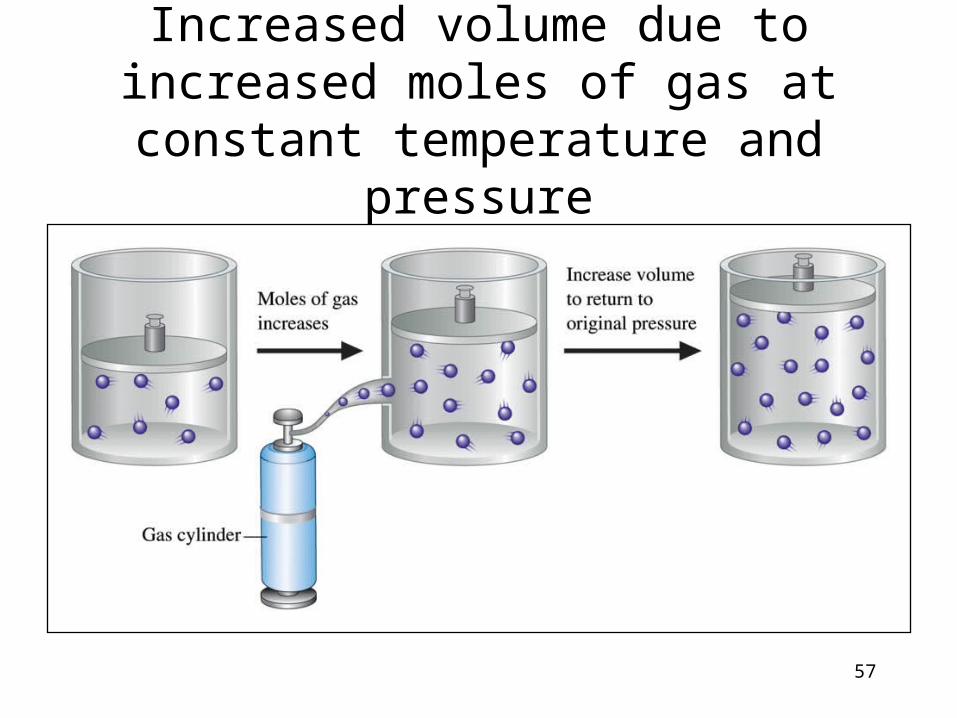
Increased volume due to increased moles of gas at constant temperature and pressure
58
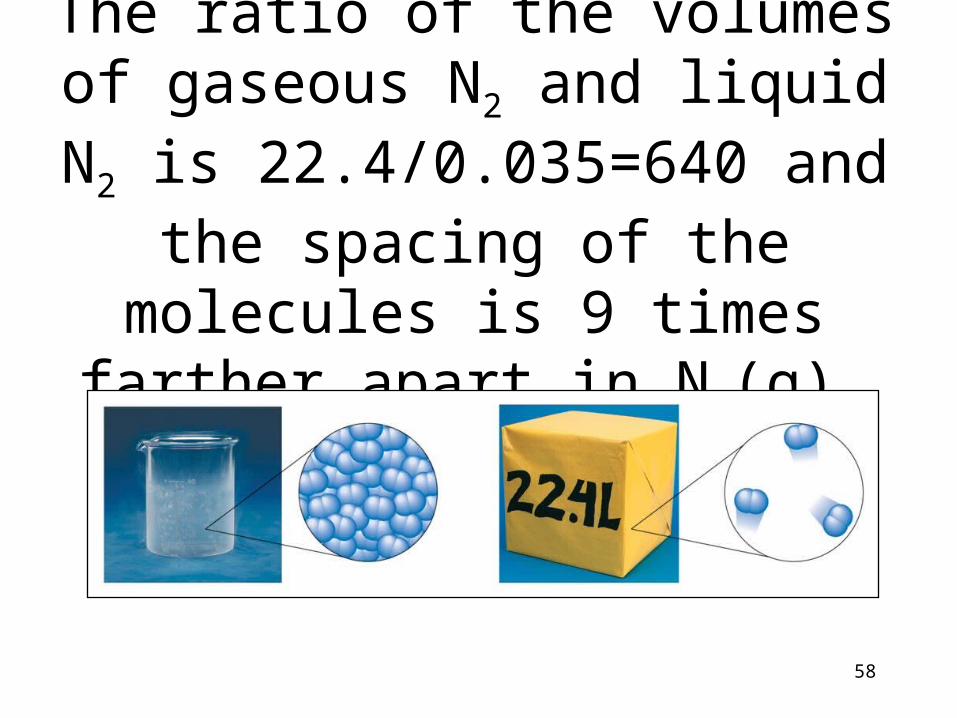
The ratio of the volumes of gaseous N2 and liquid N2 is 22.4/0.035=640 and the spacing of the molecules is
9 times farther apart in N2(g).

59