1 uh-contribution ravi mullapudi parnak charkhchi ashraf ayoub nees - jan 23, 2008
TRANSCRIPT

1
UH-Contribution
Ravi MullapudiParnak Charkhchi
Ashraf Ayoub
NEES - Jan 23, 2008
2
OUTLINE Combined Bending/Shear
Modified Compression Field Theory (MCFT) Rotating Angle Softened Truss Model (RA-STM) Fixed Angle Softened Truss Model (FA-STM) Soften Membrane Model (SMM) Comparison between Models Seismic Analysis – Numerical Results
Combined Torsion/Bending/Shear Discretization of Section in 2D/3D Regions 3D Constitutive Models Section Analysis Numerical Results
On-Going Work Beam Element under Combined Torsion/Bending/Shear Seismic Analysis OpenSees
3
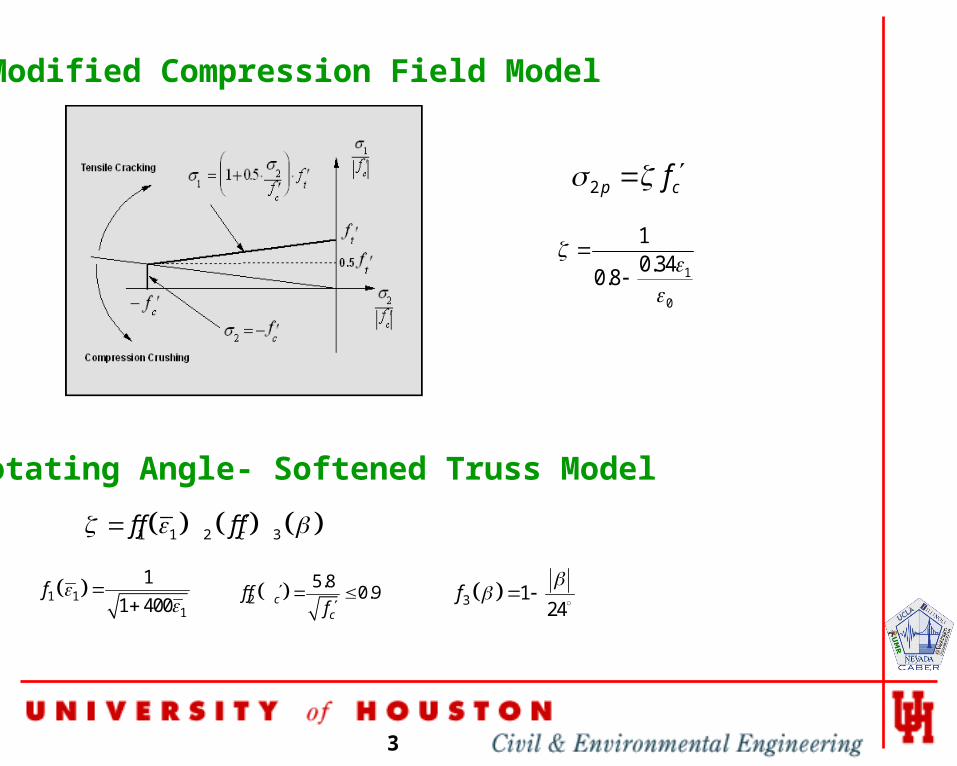
Modified Compression Field Model
1
0
10.34
0.8
2 p cf
Rotating Angle- Softened Truss Model
1 1 2 3cf f f f
25.8
0.9cc
f ff
3 124
f
1 1
1
1
1 400f
4
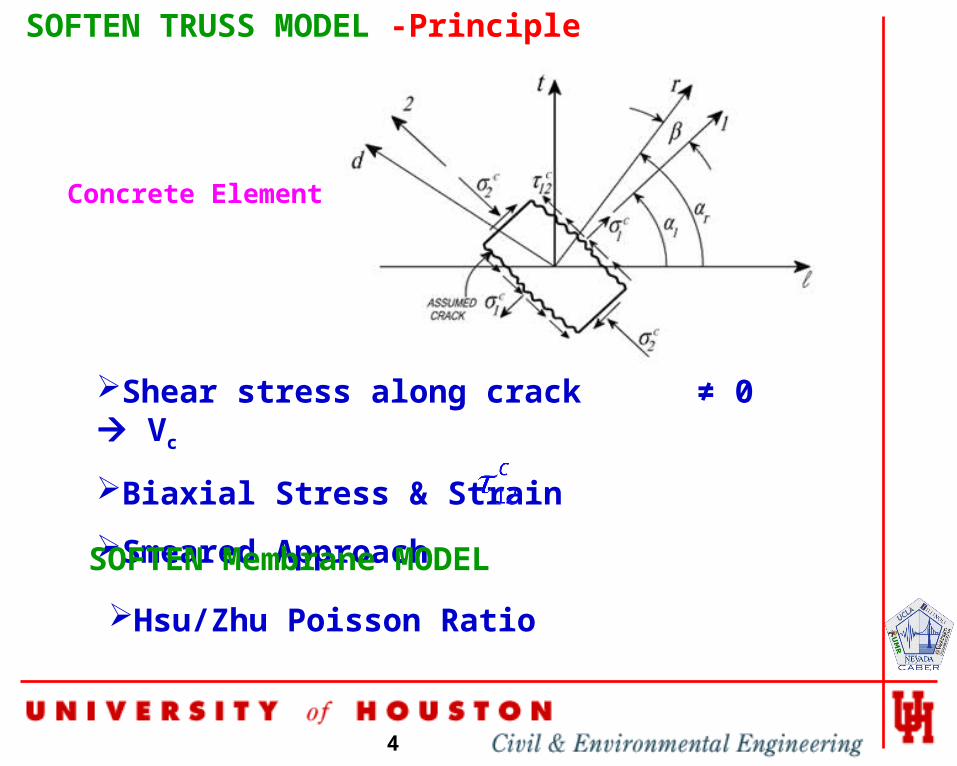
SOFTEN TRUSS MODEL -Principle
Shear stress along crack ≠ 0 Vc
Biaxial Stress & Strain
Smeared Approach
Concrete Element
SOFTEN Membrane MODEL
Hsu/Zhu Poisson Ratio
5
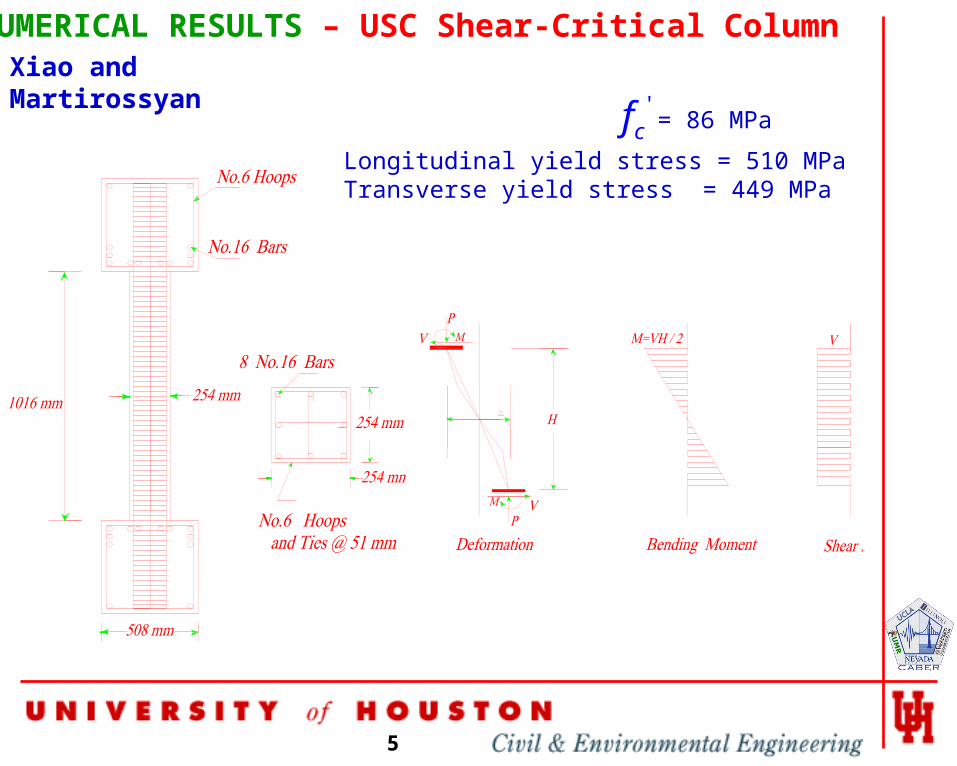
NUMERICAL RESULTS – USC Shear-Critical Column
'cf = 86 MPa
Longitudinal yield stress = 510 MPaTransverse yield stress = 449 MPa
Xiao and Martirossyan

6
NUMERICAL RESULTS Effect of Different Models
HC4-8L16-T6-0.1P Column Monotonic Analysis with different Elements
-300
-200
-100
0
100
200
300
400
-40 -30 -20 -10 0 10 20 30 40
Displacement(mm)
Sh
ear
Fo
rce(
KN
) SMM
RA-STM
TEST
FA-STM
Vecchio

7
NUMERICAL RESULTS
HC4-8L16-T6-0.1P Column
Hoop Strain Distributions
0
200
400
600
800
1000
1200
0 0.0005 0.001 0.0015 0.002 0.0025 0.003
Hoop Strain
Co
lum
n H
eig
ht
Duct 5
Duct 4
Duct 3
Duct 2

8
NUMERICAL RESULTS – Cyclic Load DisplacementAxial Load = 1068 kNUSC Column
-500
-400
-300
-200
-100
0
100
200
300
400
500
-40 -30 -20 -10 0 10 20 30 40Lateral Displacement (mm)
Sh
ear
forc
e (k
N)
.
Analytical Solution
Experiment
Flexure Element
Flexure element is unable to predict the correct behavior
9
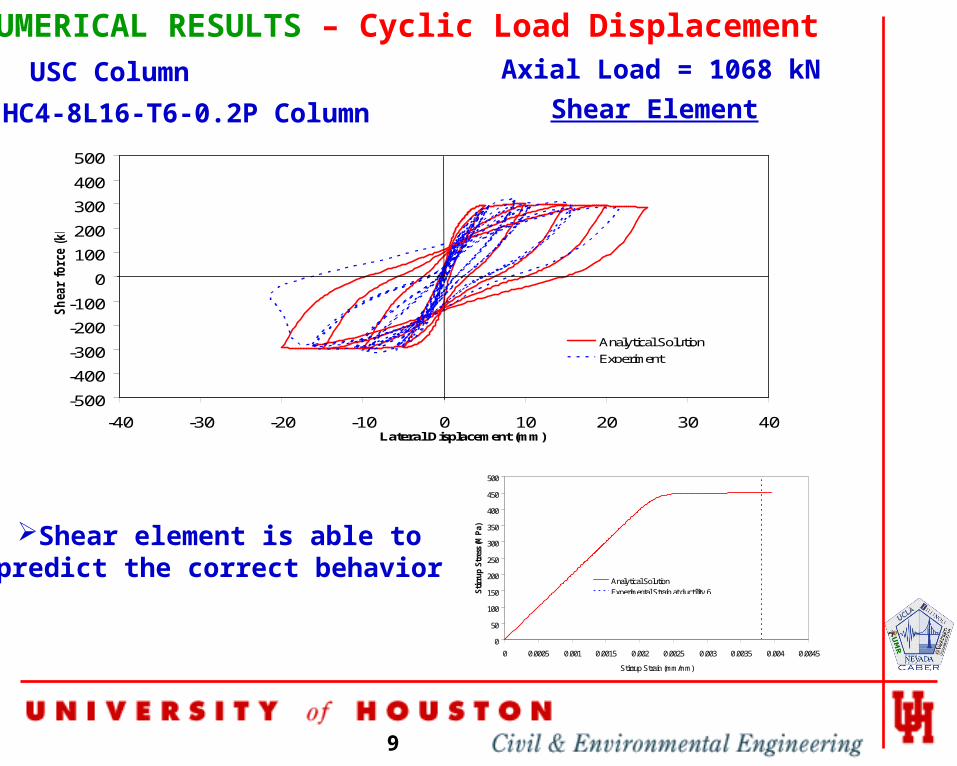
NUMERICAL RESULTS – Cyclic Load DisplacementAxial Load = 1068 kNUSC Column
Shear Element
-500
-400
-300
-200
-100
0
100
200
300
400
500
-40 -30 -20 -10 0 10 20 30 40Lateral Displacement (mm)
Sh
ear
force
(k
N)
.
Analytical Solution
Experiment
Shear element is able to predict the correct behavior
0
50
100
150
200
250
300
350
400
450
500
0 0.0005 0.001 0.0015 0.002 0.0025 0.003 0.0035 0.004 0.0045
Stirrup Strain (mm/mm)
Sti
rru
p S
tres
s (M
Pa)
.
Analytical SolutionExperimental Strain at ductility 6
HC4-8L16-T6-0.2P Column

10
NUMERICAL RESULTS Shear Element Load Displacement
HC4-8L16-T6-0.1P Column Dynamic Shear Analysis
-20
-15
-10
-5
0
5
10
15
20
0 2 4 6 8 10 12 14 16
Time(Sec)
Dis
pla
cem
ent(
mm
)
11
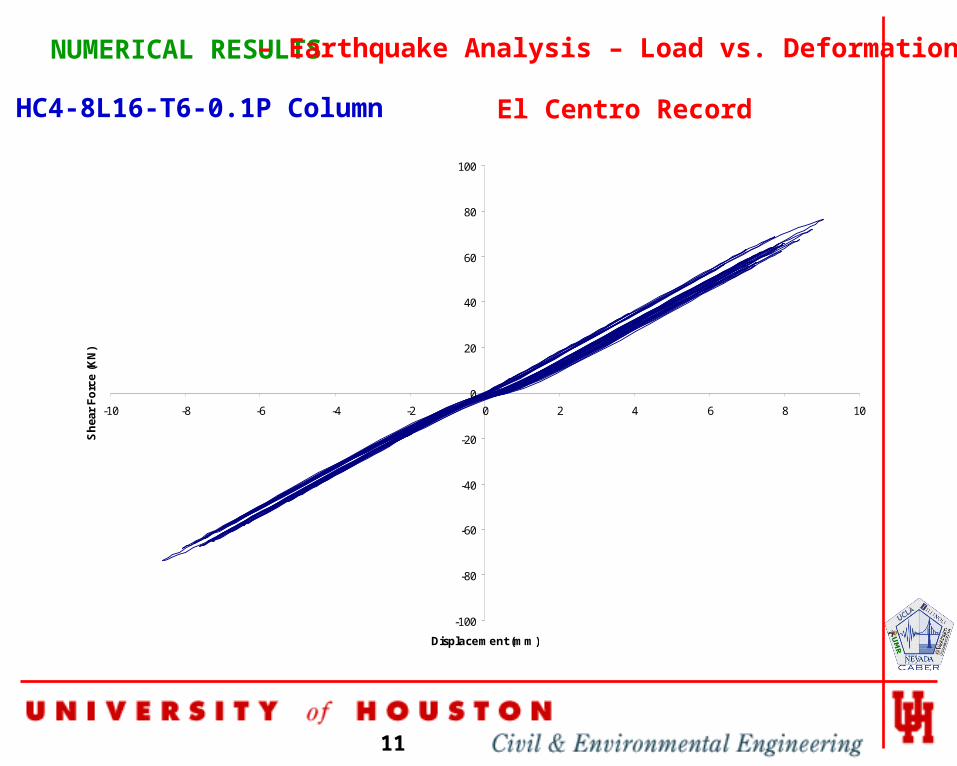
NUMERICAL RESULTS – Earthquake Analysis – Load vs. Deformation
HC4-8L16-T6-0.1P Column
-100
-80
-60
-40
-20
0
20
40
60
80
100
-10 -8 -6 -4 -2 0 2 4 6 8 10
Displacement (mm)
Sh
ear
Fo
rce
(KN
)
El Centro Record
12
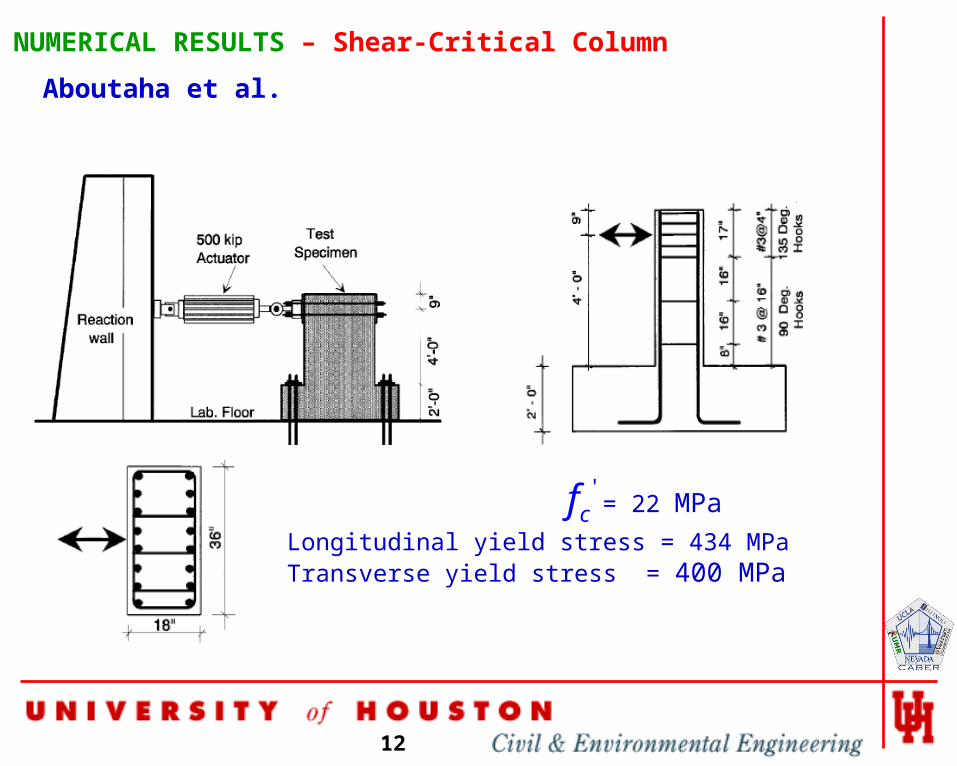
NUMERICAL RESULTS – Shear-Critical Column
Aboutaha et al.
'cf = 22 MPa
Longitudinal yield stress = 434 MPaTransverse yield stress = 400 MPa
13
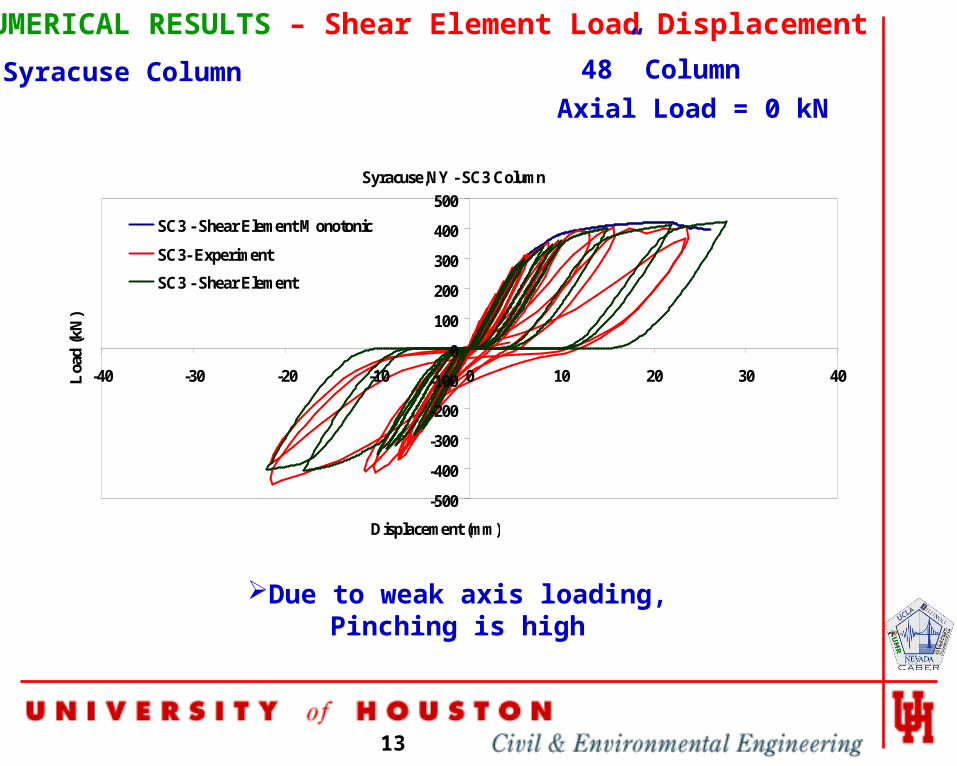
Syracuse,NY - SC3 Column
-500
-400
-300
-200
-100
0
100
200
300
400
500
-40 -30 -20 -10 0 10 20 30 40
Displacement (mm)
Loa
d (k
N)
SC3 - Shear Element Monotonic
SC3- Experiment
SC3 - Shear Element
NUMERICAL RESULTS – Shear Element Load Displacement
48” ColumnSyracuse ColumnAxial Load = 0 kN
Due to weak axis loading, Pinching is high

14
Syracuse,NY - SC3 Column
-800
-600
-400
-200
0
200
400
600
800
-40 -30 -20 -10 0 10 20 30 40
Displacement (mm)
Loa
d (
kN
)
SC3- Experiment
SC3 - Shear Element
SC3 - Flexure Element
NUMERICAL RESULTS – Shear and Flexure Element48” ColumnSyracuse ColumnAxial Load = 0 kN
Flexure element is unable to predict the correct behavior

15
NUMERICAL RESULTS – Earthquake Analysis – Time History
48” ColumnSyracuse Column Shear AnalysisAssumed Axial Load = 0.1 fc Ag = 205.5 kN
2 * EL Centro (1940) record
-15
-10
-5
0
5
10
15
0 2 4 6 8 10 12 14
Dis
pla
cem
ent (
mm
)
Time (Sec)
16
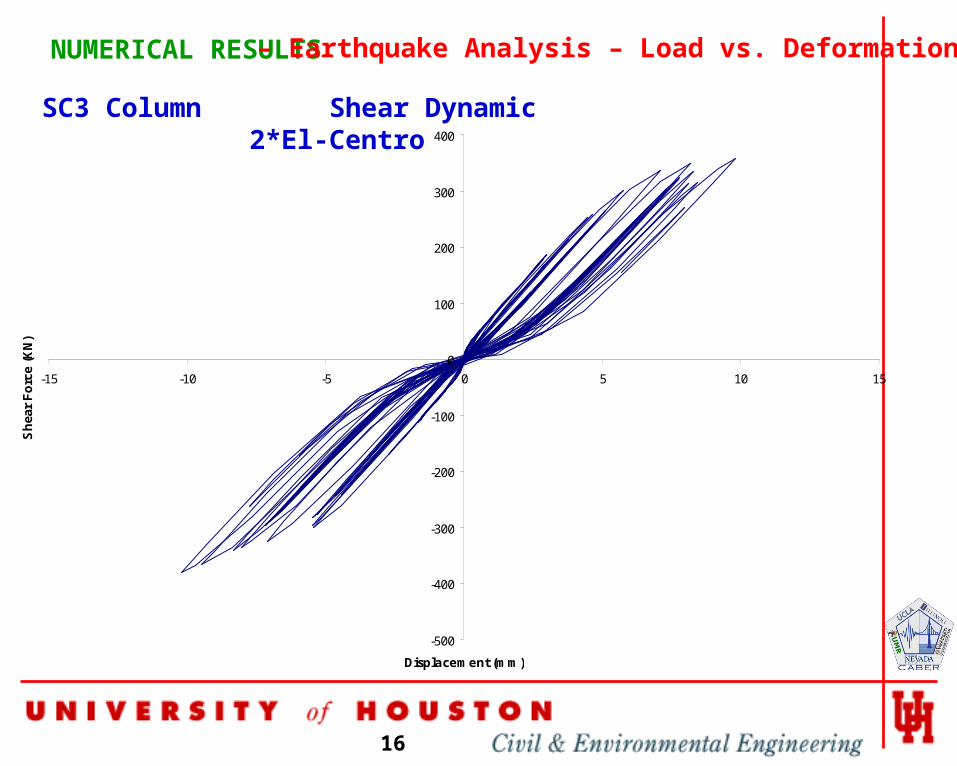
NUMERICAL RESULTS – Earthquake Analysis – Load vs. Deformation
SC3 Column Shear Dynamic 2*El-Centro
-500
-400
-300
-200
-100
0
100
200
300
400
-15 -10 -5 0 5 10 15
Displacement (mm)
Sh
ear
Fo
rce
(KN
)

17
NUMERICAL RESULTS – Earthquake Analysis – Time History
Syracuse Column Flexure and Shear AnalysisAssumed Axial Load = 0.1 fc Ag = 205.5 kN
2 * EL Centro (1940) record
-15
-10
-5
0
5
10
15
0 2 4 6 8 10 12 14 16
Time (Sec)
Dis
pla
cem
ent
(mm
)
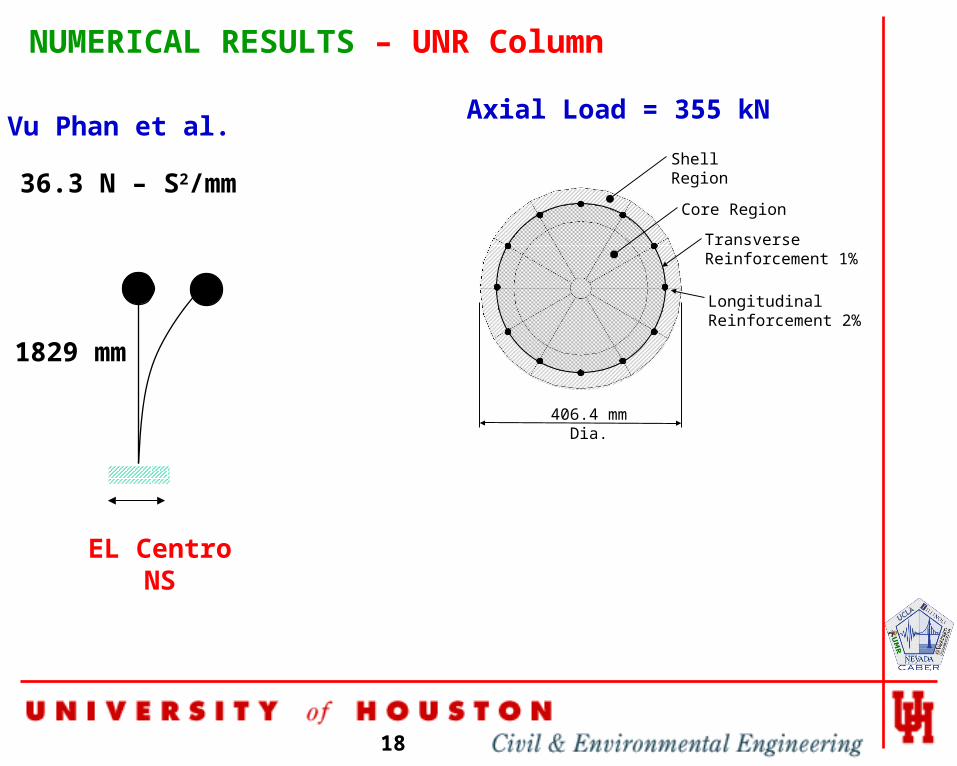
18
Longitudinal Reinforcement 2%
Shell Region
Core Region
406.4 mm Dia.
Transverse Reinforcement 1%
NUMERICAL RESULTS – UNR Column
Vu Phan et al.
1829 mm
EL Centro NS
36.3 N – S2/mm
Axial Load = 355 kN
19
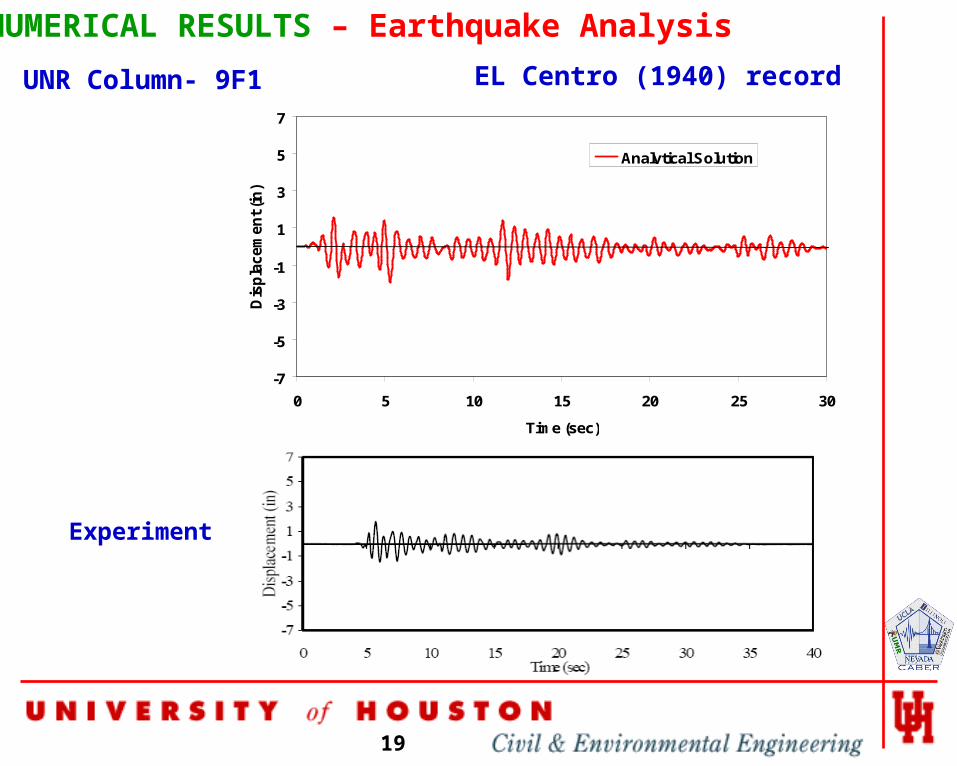
NUMERICAL RESULTS – Earthquake Analysis
UNR Column- 9F1 EL Centro (1940) record
Experiment
-7
-5
-3
-1
1
3
5
7
0 5 10 15 20 25 30
Time (sec)
Dis
pla
cem
en
t (in
) .
Analytical Solution

20
NUMERICAL RESULTS – Earthquake Analysis
UNR Column EL Centro (1940) record
-40
-30
-20
-10
0
10
20
30
40
-7 -6 -5 -4 -3 -2 -1 0 1 2 3 4 5 6 7
Displacement (in)
Sh
ar
forc
e (
kip
) .
Analytical Solution
21
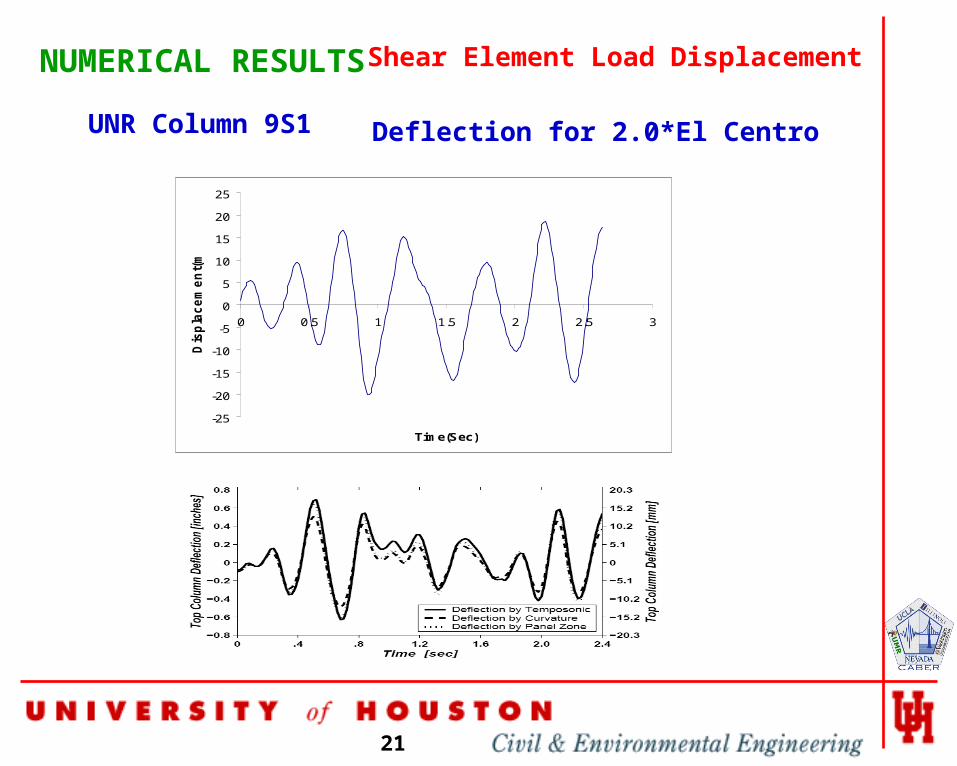
NUMERICAL RESULTS Shear Element Load Displacement
UNR Column 9S1 Deflection for 2.0*El Centro
-25
-20
-15
-10
-5
0
5
10
15
20
25
0 0.5 1 1.5 2 2.5 3
Time(Sec)
Dis
pla
ce
me
nt(
mm
)

22
Torsion Basic Equations
2 2
2 2
0
cos sin
sin cos
( )sin cos
(2 )
r r d r
t r r d r t t
t r d r r
t d
f
f
T A t
Equilibrium
Compatibility2 2
2 2
0
0
cos sin
sin cos
( )sin cos2
2
sin(2 )
2
r r d r
t r r d r
tr d r r
t
r
dsd
dsd
P
A
t

23
Torsional Section Discretization
2D/3D Regions
24
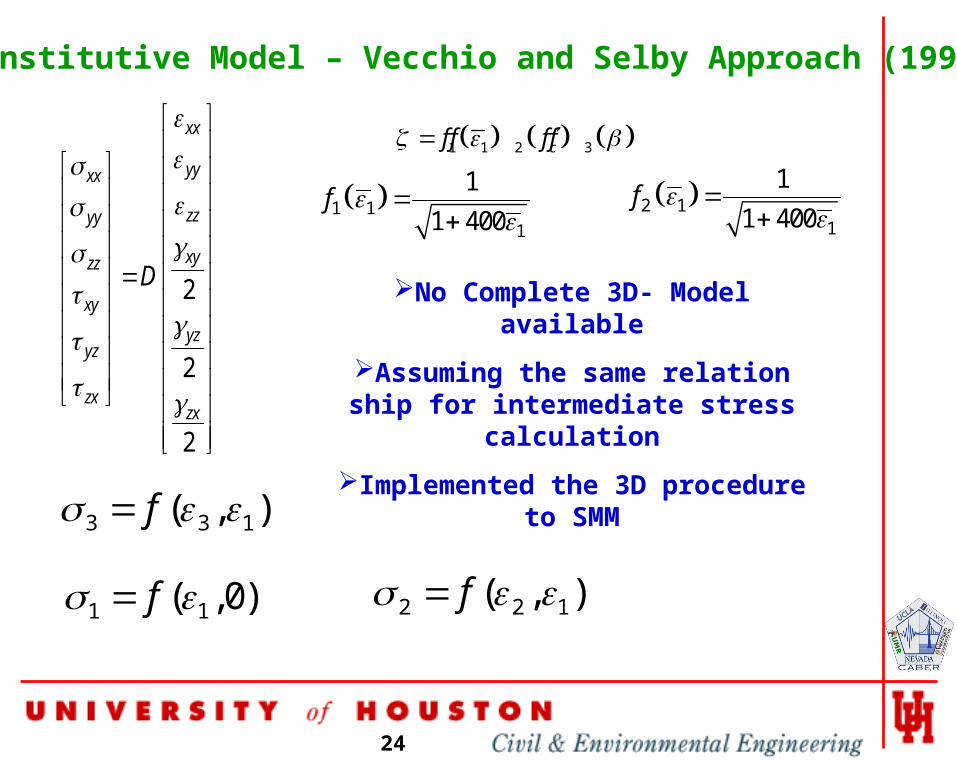
3D Constitutive Model – Vecchio and Selby Approach (1991)
2
2
2
xx
yyxx
zzyy
xyzz
xy
yzyz
zxzx
D
1 1 2 3cf f f f
1 11
1
1 400f
No Complete 3D- Model available
Assuming the same relation ship for intermediate stress calculation
Implemented the 3D procedure to SMM
2 11
1
1 400f
3 3 1( , )f
1 1( ,0)f 2 2 1( , )f
25
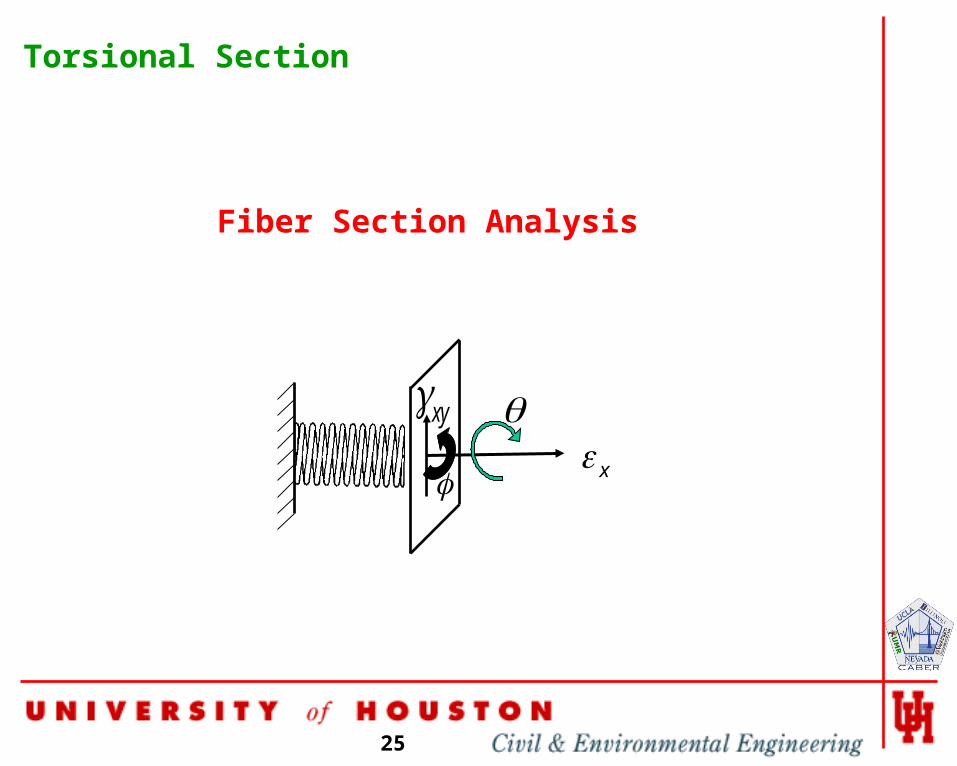
Torsional Section
xy x
Fiber Section Analysis
26
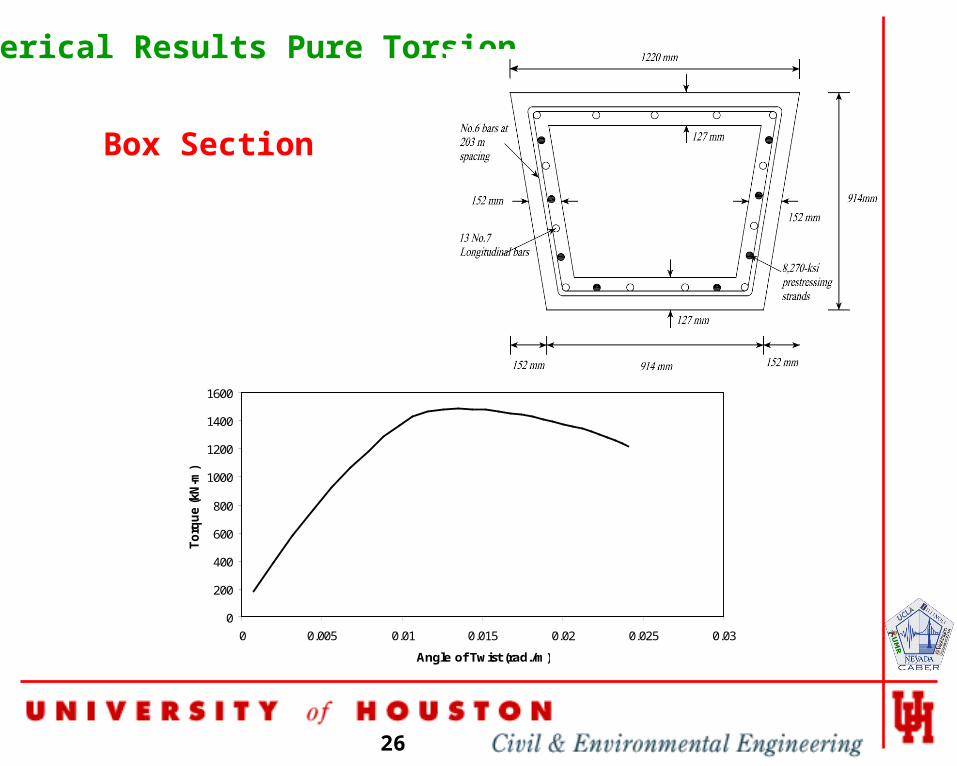
Numerical Results Pure Torsion
0
200
400
600
800
1000
1200
1400
1600
0 0.005 0.01 0.015 0.02 0.025 0.03
Angle of Twist (rad./m)
To
rqu
e (k
N-m
) .
Box Section

27
0
1
2
3
4
5
6
7
8
0 0.002 0.004 0.006 0.008 0.01 0.012
Shear Strain (rad)
Sh
ear
Str
ess
(Mp
a)
.Numerical Results
0
50
100
150
200
250
300
350
400
450
0 0.001 0.002 0.003 0.004 0.005 0.006
Transverse Steel Strain (mm/mm)
Tra
nsv
erse
Ste
el S
tres
s (M
pa)
.

28
Numerical Results - Combined Torsion/Bending
24”
12”
5, #9 bars
#4 hoops @ 5”
0
500
1000
1500
2000
2500
3000
3500
4000
4500
5000
0 0.0001 0.0002 0.0003 0.0004 0.0005 0.0006 0.0007 0.0008 0.0009 0.001
Curvature (rad/in)
Mom
ent
(kip
-in
) .
0 rad Twist
0.001 rad Twist
0.004 rad Twist
0.007 rad Twist
29
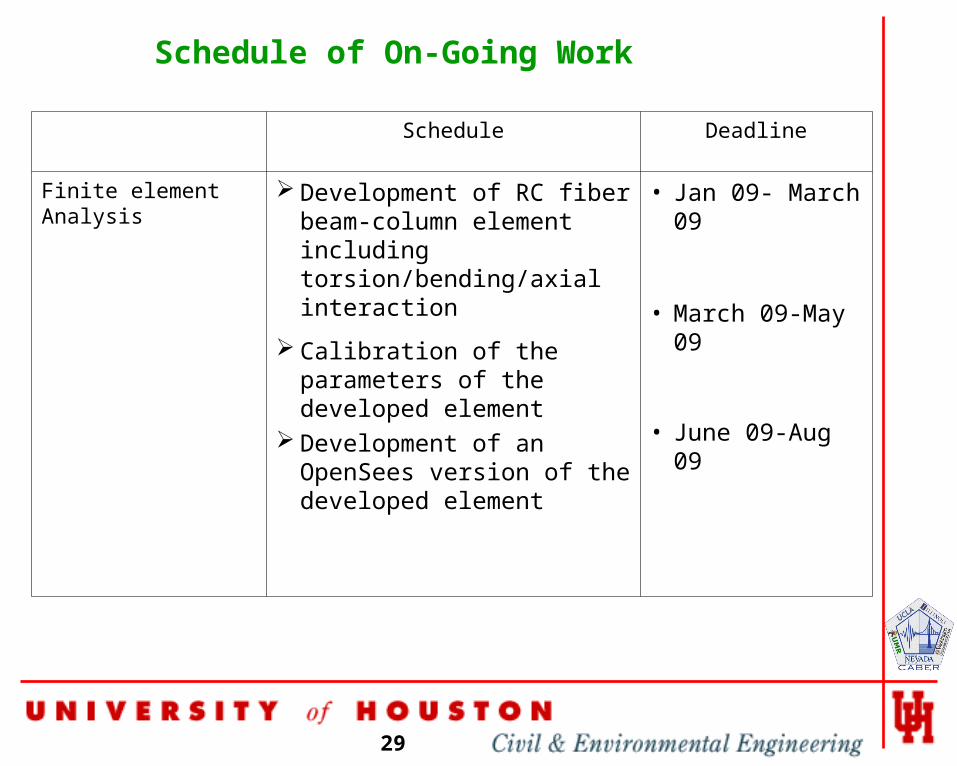
Schedule Deadline
Finite element Analysis Development of RC fiber beam-column element including torsion/bending/axial interaction
Calibration of the parameters of the developed element
Development of an OpenSees version of the developed element
• Jan 09- March 09
• March 09-May 09
• June 09-Aug 09
Schedule of On-Going Work