1 within-year grade 2 math growth: using a 2pl third-order item
TRANSCRIPT
1
Within-Year Grade 2 Math Growth: Using a 2PL Third-Order Item Response Theory
Growth Model
Chalie Patarapichayatham
Joseph F. T. Nese
Daniel Anderson
University of Oregon
Corresponding Author:
Chalie Patarapichayatham, PhD.
College of Education, BRT,
5262 University of Oregon,
Eugene, OR 97403-5262
Email: [email protected]

2
Abstract
The purpose of this study was to model within-year math growth for grade 2 students using a
2PL third-order item response theory (IRT) growth model. We used curriculum-based
measurement (CBM) math tests from the easyCBM®
benchmark and progress monitoring
assessment system, a formative assessment used by teachers to monitor student progress and
evaluate instruction. All assessments were based on the National Council of Teachers of
Mathematics (NCTM) focal point standards. Specifically, we applied the growth model to
explore how the contribution of each focal point to the latent math construct changes across the
year. The results suggested that on average (a) the fall measure was the most difficult, followed
by spring, and then winter; (b) Measurement had the strongest relation to the Grade 2 latent math
factor in fall, Number and Operations and Algebra in winter and spring, and Number and
Operations in general had the weakest relation to math across the year; and (c) the average Grade
2 math trajectory demonstrated increasing growth rate across the year but a higher growth rate
from fall to winter than from winter to spring.

3
Introduction
The blueprint for revising the Elementary and Secondary Education Act (ESEA) was
released in 2010. It emphasized education standards in all academic domains and encouraged
states to adopt common academic content standards for students to succeed in college and the
workplace, as well as assessments that more accurately reflect how students progress toward the
skills outlined by the standards (U.S. Department of Education Office of Planning Evaluation
and Policy Development, 2010). Specifically noted were standards-aligned assessments that
better informed classroom instruction in response to academic needs, and that accurately
measure higher-order skills and student academic growth (U.S. Department of Education Office
of Planning Evaluation and Policy Development, 2010).
The Common Core State Standards (CCSS) were released in conjunction with the ESEA
blueprint with the purpose of setting “high standards that are consistent across states [that]
provide teachers, parents, and students with a set of clear expectations that are aligned to the
expectations in college and careers” (e.g., National Governors Association Center for Best
Practices, Council of Chief State School Officers [NGACBP, CCSSO], 2010). The CCSS offer
an articulation of what students are expected to learn in Grades K-12 in English language arts
and mathematics for the purpose of providing clear goals for student learning to help teachers
ensure their students have the skills and knowledge needed to be successful
(www.corestandards.org/in-the-states).
Curriculum-based measurements (CBM) can be aligned with curriculum standards and
used to inform instruction. CBM is an approach to formative assessment that prioritizes the
measurement of growth through multiple short, technically adequate, and sufficiently equivalent
test forms (e.g., Deno, 2003; Tindal, 2013). CBMs provide teachers with a measurement of their

4
students’ current level of proficiency in a particular content area as well as a mechanism for
tracking student progress to evaluate the effectiveness of instruction (e.g., Deno, 2003; Deno,
Marston, & Tindal, 1985; Fuchs, 2004; Good & Jefferson, 1998; Tindal et al., 1985). CBMs are
used to identify students at-risk for low achievement, to monitor the progress of those identified
to help inform instructional decision-making, and as part of a response to intervention (RTI)
framework for special education referral and identification (e.g., Fuchs & Fuchs, 2006; Speece,
Case, & Molloy, 2003). In an RTI system, universal screening measures are administered to all
students in a school or district during the fall, winter, and spring to estimate performance on
general outcome measures (e.g., reading or math). In general, these data are used to examine
whether students meet normative benchmark expectations set by the educators using the
assessments.
As of 2008, most of the research on CBM had been in reading, not mathematics (e.g.,
Tindal, 2013); however, CBM math can be effectively used to screen all students in a district,
school, grade-level, class, or small group; monitor the effectiveness of instruction or
interventions for general or special education students; and as an accessible way to communicate
student growth to parents (e.g., Lembke & Stecker, 2007). Christ et al. (2008) reviewed the
research and psychometric evidence for CBM math using Messick’s (1995) validity framework
and noted the lack of research addressing consequential validity. The results of their review
suggested broadly that math CBM can be sufficiently reliable and valid, but cautioned that
interpretation must be informed by the context and scope of assessment domains and limited by
its construct representation.
In general, little attention has been given to the analysis of CBM math growth. Anderson
and Irvin (2012) used a three-level hierarchical linear model to examine within-year growth on
5
the easyCBM®
math tests for students in one grade in one standard through. One study examined
teachers’ decisions to progress monitor students in math based on fall benchmark scores, and
reported Grade 6 progress monitoring growth patterns (e.g., Saven, Anderson, Nese, Alonzo &
Tindal, 2013). Patarapichayatham, Anderson, and Kamata (2012) applied both latent class and
latent transition models to Grades 5-8 math CBMs across two years with five cohorts, however
their study focused primarily on the effect of the middle school transition on math achievement,
rather than the trajectory of students’ math growth. Finally, in a review of 32 studies on
mathematics CBMs for students from preschool to secondary schools, it was reported that (a)
math growth rates appeared to be influenced by the complexity of the responses required of
students, and (b) measures on which normative growth is more rapid would prove to be more
valuable to practitioners (e.g., Foegen, Jiban, & Deno, 2007; Lembke, Hampton, & Beyers,
2012). The authors also suggested that the amount of variability around typical growth rates will
affect practitioners’ ability to detect changes in student growth. An important limitation of the
review, however, was that of the 21 elementary studies reviewed, only 7 reported growth
estimates, and all but one in linear terms.
Coinciding with math growth is math skill development as it relates to curriculum and
standards. Math skill development in the early elementary years (K-3) is hypothesized to
advance concurrently across five areas: numbers and operations, geometry, algebra,
measurement, and data analysis (e.g., Clements, 2004; Clements & Sarama, 2009; NCTM, 2006)
with numbers and operations (or number sense or early numeracy) the most predictive of later
math success (e.g., Mazzocco & Thompson, 2005; Missall et al., 2012). The central issue related
to CBM math is domain sampling for measurement development (e.g., Tindal, 2013). Originally,
CBMs assessments were created from the classroom’s curriculum; however in general, current

6
CBM assessments are based on comparable alternate forms of skills to be taught over time that
preview and review skills (e.g., Tindal, 2013). Thus, the domain sampling for assessment
development is not pulled directly from curricular material, but rather a general representation of
the academic domains that make up the learning outcomes for a particular grade.
Tindal’s (2013) summary of and reflection on CBM math suggested that it is comprised
of multiple domains that must be connected by research, and different than reading, these
domains successively build upon each other. Understanding how knowledge and skills develop,
or how learning progresses, is crucial for modifying instruction (e.g., Mosher, 2011),
strengthening the relevance of assessments, and achieving mastery toward achievement goals
(e.g., Saez et al., 2012). While math standards like the CCSS focus on core conceptual
understandings and procedures, they do not characterize how students acquire requisite
knowledge and skills and progress toward anticipated mastery (e.g., Saez, Lai, & Tindal, 2012).
Curriculum standards denote grade-specific material and specific student outcomes aligned to
those standards, but learning progressions map what students are expected to do at different
stages of knowledge and skill acquisition and, hopefully, provide understanding for how
instruction and learning interact to build that acquisition (e.g., Saez et al., 2012). The CCSS
“describe performance objectives as they relate to the ability of students to represent and
interpret data through measurement” (e.g., Briggs, 2013, p. 11), but do not articulate the process
between those objectives. In part, learning progressions aim to understand the processes and
connect assessments, and the goal of this study is to explore this area where standards,
assessment, and learning (or growth) meet. To do so, we take a small piece of the across-year
learning progression and model the within-year CBM math growth for students in Grade 2 in an
effort to understand the relation between standards and growth.

7
The purpose of this study was to model the within-year CBM math growth of grade 2
students using a two-parameter (2PL) third-order IRT within-year growth model to explore
trends in the relative contribution of math standards to the latent math construct (see Figure 1).
Our primary research objectives were as follows: (a) report the description of the item
parameters (i.e., item difficulty and item discrimination) for each standard focal point (nine) and
each seasonal form (three) across the year; (b) explore the relative contribution of each Grade 2
standard to the latent math construct across the year by comparing the seasonal (fall, winter,
spring) math factor loadings on the standards to examine how the standards influence math
across the year; and (c) report the average within-year grade 2 math growth and its functional
form.
Methods
Measure and Sample
A precursor to the CCSS (e.g., Kelley, Hosp, & Howell, 2008), the National Council of
Teachers of Mathematics (NCTM) developed “focal point” standards for Grades K-8 as a
precursor to the CCSS (e.g., Kelley, Hosp, & Howell, 2008). The focal points represented “a
starting point in a dialogue on what is important at particular levels of instruction and as an
initial step toward a more coherent, focused curriculum in this country” (e.g., NCTM, 2006, p.
vii). The NCTM focal points have been adapted by several states as the basis of their state
content standards in mathematics, and resemble the CCSS. For example, Table 1 depicts a
comparison of the three grade 2 NCTM focal points and the four grade 2 CCSS standards. Each
focal point or standard has a description, which includes a variety of interconnected concepts
(see Table 1). Each also has several objectives which describe math content and process skills

8
which are not listed in Table 1, but do better reflect the dissimilarities between the NCTM focal
point standards and the CCSS (a discussion of which is beyond the scope of this paper).
The easyCBM®
is an online benchmark and progress monitoring assessment system that
provides both universal interim-screening assessments for fall, winter, and spring administration,
and multiple alternate progress monitoring forms designed for use in K-8 school settings (e.g.,
Alonzo, Tindal, Ulmer, & Glasgow, 2006). The easyCBM®
math items were developed to
directly reflect the NCTM focal points (i.e., written to a particular objective within a single focal
point standard) and the benchmark forms include three test types that match the NCTM
curriculum focal points for each grade level. For grade 2, those test types are Numbers and
Operations (N), Numbers and Operations and Algebra (A), and Measurement (M). In general,
numbers and operations encompasses number knowledge, verbal counting, basic calculation, and
quantity comparisons; algebra encompasses skills related to identifying patterns and bringing
organization and predictability to unorganized situations; and measurement encompasses the
identification of quantifiable attributes and comparing objects using the attributes (e.g., Missall,
Mercer, Martinez, & Casebeer, 2012).
The three easyCBM®
benchmark screening tests administered to all students in a school
in the fall, winter, and spring are comprised of 45 items across all three focal points (e.g., Alonzo
& Tindal, 2012), with each focal point representing approximately one-third of all items. The
data was collected in the fall, winter, and spring of the 2011–2012 school-year, and Grade 2
students with complete three benchmark measure data were included in the analysis (n =
17,816). The easyCBM®
math benchmark measures were developed to be of equivalent
difficulty. Using the results of Rasch analyses, items were selected items to use in the creation of
multiple equivalent forms for progress monitoring appropriate for use with students in Grade 2

9
(Alonzo & Tindal, 2009). All alternate forms were of comparable difficulty as determined by the
mean measure of the items on each form (e.g., Alonzo & Tindal, 2009).
Modeling
A 2PL third-order estimated time score item response theory growth model was applied
in this study (Figure 1). The three focal points were (a) Number and Operations (N), (b)
Measurement (M), and (c) Numbers and Operations and Algebra (A) were the first-order factors
of the fall (F), winter (W), and spring (S) latent factors, which were the second-order factors. By
applying this model we obtained the intercept (I), or fall initial status, and the within-year slope
(S), as well as factor loadings for each focal points at each season. In addition, we obtained not
only within-year growth information, but also the quality of each item (item difficulty and item
discrimination) within each focal point, the quality of each focal point within each season (factor
loadings), and the quality of each measure (fall, winter, and spring) across year. All parameters
were estimated with the Mplus 7.0 (Muthén & Muthén, 1998-2012) software using the Bayesian
estimator.
Regarding the model specification, for the first order, the loading of the first item in each
focal point is set to be 1.0 as scale identification. The remaining loadings are freely estimated.
For identification of the mean structure, one measure intercept, the threshold for the first item in
each focal point is set to zero as suggested by Bollen and Currna (2006) Sayer and Cumsille
(2001), and Serrano (2010). The remaining intercepts are freely estimated. For the second order,
the loading of the first focal point in each measure is also set to be 1.0 as scale identification. The
intercepts of fall, winter, and spring are constrained to be zero, as is standard practice in a first-
order latent growth model. Regarding the third order, the intercept loadings of fall, winter, and

10
spring are constrained to be 1.0, and the slope loadings of fall and winter are constrained to be
zero and 1.0, whereas the slop of spring is freely estimated to allow for nonlinearity.
Results
Descriptive Results
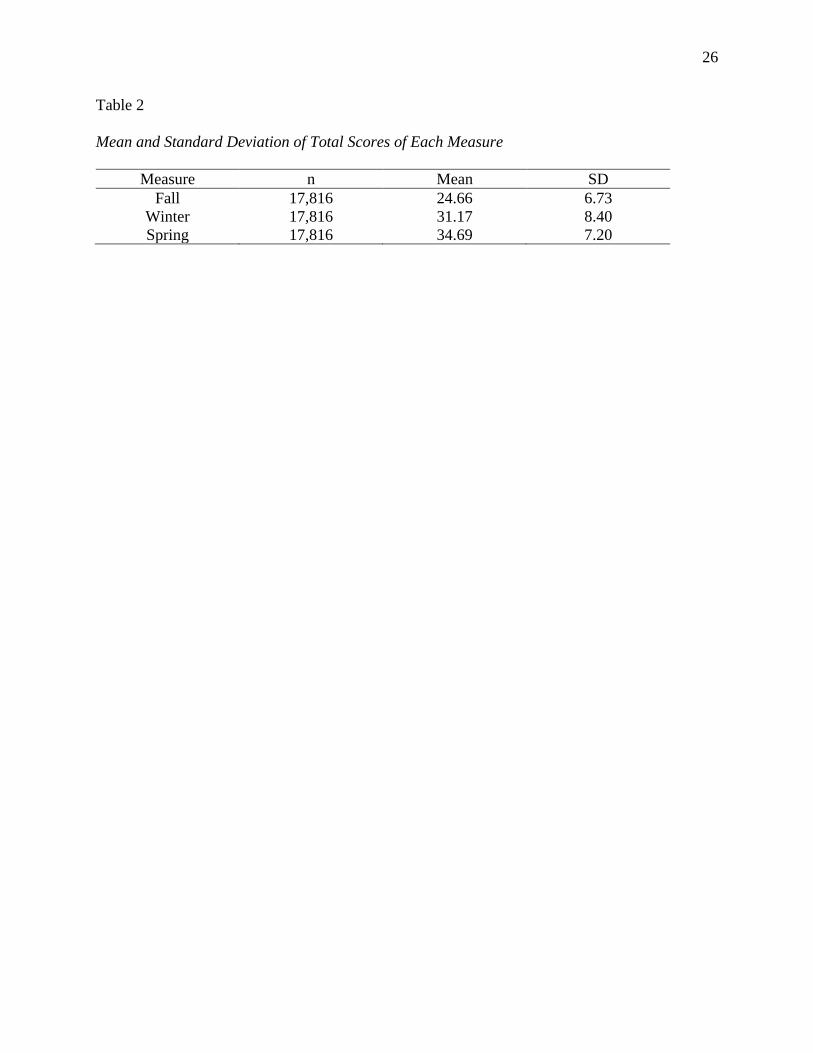
Table 2 shows observed mean and standard deviation of total score of each measure. The
mean scores of fall, spring, and winter measures were 24.66, 31.17, and 34.69 respectively,
indicating a positive within-year average growth trajectory across the three testing occasions.
The mean difference between winter and fall total scores was larger than the mean difference
between spring and winter total scores (6.51 vs. 3.52), indicating these particular students had on
average a higher growth rate from fall to winter than from winter to spring. In other words, these
students developed their math skill proficiency more rapidly from fall to winter than from winter
to spring. This result demonstrated that the within-year growth in this study was not linear. Thus,
we applied the estimated time score growth model in this study to allow for nonlinearity in the
growth model. Given the nature of data and the mean of total raw scores, although we did not
test the linear growth model, we assumed the estimated time score growth model would fit our
data better than a linear growth model.
Table 3 shows the observed mean and standard deviation of total scores for each focal
point within each measure. The mean of all three focal points within fall measure were quite
similar – 8.73, 8.17, and 7.76 for numbers and operations (N), measurement (M), and numbers,
operations, and algebra (A), respectively, indicating students had relatively similar scores across
all three focal points in fall. Regarding the winter measure, the mean of numbers and operations
(N) and numbers, operations, and algebra (A) were 11.06 and 11.50, indicating students had
similar scores across both focal points, but the mean of measurement (M) (8.60) was slightly
11
lower. It could be interpreted that items in this focal point might be more difficult or function
poorly in terms of the discriminating power; however, given the fact that the measurement (M)
focal point had only 14 items, whereas the numbers, operations, and algebra (A) and the numbers
and operations (N) focal points had 16 and 15 items respectively, the difference in students’
mean scores is difficult to interpret. The mean of all three focal points within spring measure
were relatively similar. They were 10.77, 12.40, and 11.53 for numbers and operations (N),
measurement (M), and numbers, operations, and algebra (A), respectively, indicating students
had relatively similar scores across all three focal points in spring measure.
Table 4 shows the correlations between total score of each focal point and total score of
each measure. Overall, the correlations ranged from .80-.89, indicating moderate to high
correlations. The correlations between three fall focal points and the fall measure ranged from
.81 to .84, indicating strong relations. And correlations between three winter focal points and the
winter measure and between three spring focal points the spring measure ranged from .84 to .89
and .80 to .86, respectively. The correlations between the focal points across the year ranged
from .38 to .63, indicating moderate relations between focal point across year. Finally, the
correlations between the seasonal measures ranged from .65 to .77, indicating relatively high
correlations between measures.
Model Analyses
Several models were preliminary explored before we fit our final model, including: a
linear growth of observed total scores; a 2PL first-order CFA for each focal point within each
seasonal measure; a 2PL first-order CFA for each seasonal measure; a 2PL second-order CFA
for each seasonal measure; a 2PL second-order CFA for all three seasonal measures
simultaneously; and a the 2PL second-order CFA for all three seasonal measures

12
simultaneously with regression effects between measures. Overall, results showed acceptable fit
and reasonable parameter estimates. We reported only results of the 2PL third-order estimated
time score IRT growth model here.
First objective: Item parameters. All item discriminations and item difficulties were
converted by using marginal standardized factor (Kamata & Bauer, 2008). The marginal
standardized factor of item discrimination can be written as 2 1/2(1 )
ii
i
, where i is the
standardized loading for item i. The marginal standardized factor of item difficulty can be
written as 2 1/2(1 )
ii
i
, where i is the standardized threshold for item i.
Results showed that all item difficulty parameters were in the range of [-2.85, 1.00],
indicating a reasonable, if low, range of item difficulties across measures (Table 5). That is,
results suggested that most of items were relatively easy. The average item difficulty across
seasons was -0.12 (SD=0.52) for fall, -0.88 (SD=0.80) for winter, and -0.59 (SD=0.90) for
spring. Thus, on average, the fall measure was the most difficult, followed by spring, and then
winter.
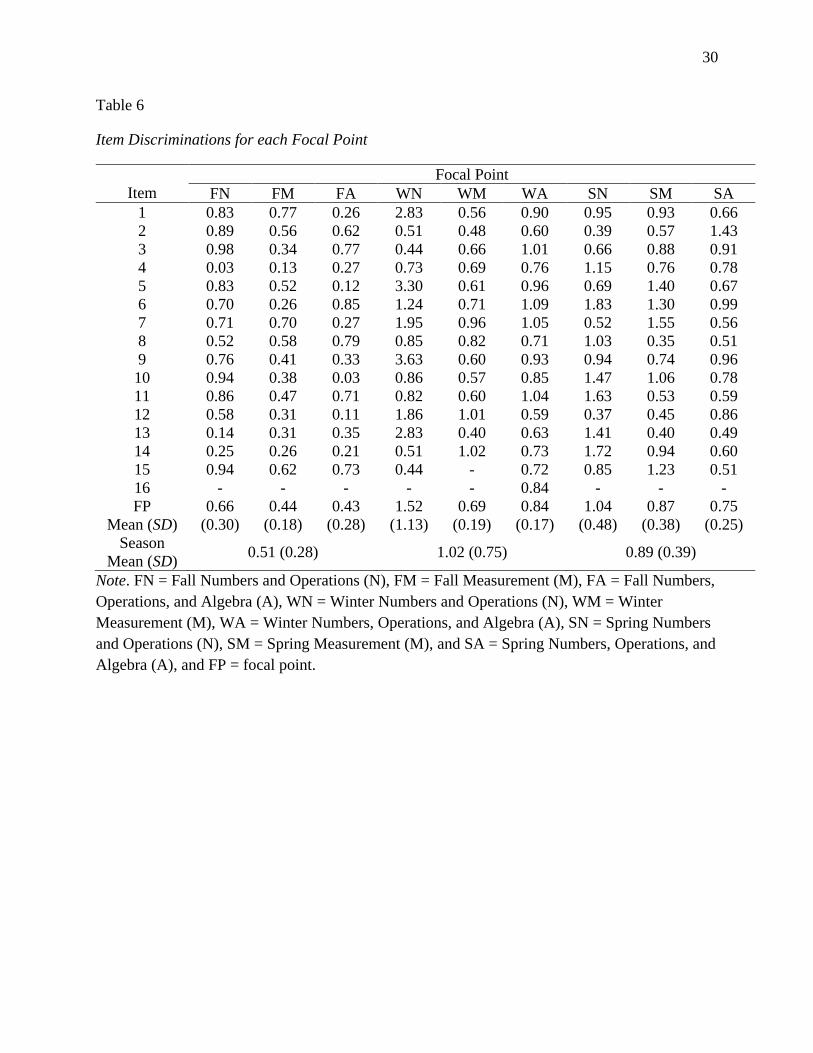
The item discriminations were generally high with a range of [0.03, 3.63], indicating the
items within each focal point were of good quality (Table 6); however, few items were identified
as needing improvement. Such items from the fall measure included items 4 (r = .03), and 13 (r
=. 14) within the Number and Operations (N) focal point, item 4 (r = .13) within Measurement
(M), and item 5 (r = .12), item 10 (r = .03), and item 12 (r = .11) within the Number and
Operations and Algebra (A) focal point. The test developers might need to make decisions about
these items whether they need to be revised or removed from the measure. The average item
discrimination across seasons was 0.51 (SD=0.28) for fall, 1.02 (SD=0.75) for winter, and 0.89

13
(SD=0.39) for spring. Thus, on average, the winter measure had the best item discrimination,
followed by spring, and then fall.
Second objective: seasonal factor loadings. Overall, results demonstrated that each
focal point has a strong relation with each measure across the year. It indicates the relative
contribution of each grade 2 standard to the latent math construct (fall, winter, and spring) across
the year. Given the residual variance estimates, the fall measure explained 83%, 91%, and 99%
of the variance in students’ responses to the Number and Operations (N), Measurement (M), and
Number and Operations and Algebra (A) focal points respectively. The winter measure
explained 76%, 94%, and 87% of the variance in students’ responses to the Number and
Operations (N)), Measurement (M), and Number and Operations and Algebra (A) focal points
respectively, and the spring measure explained 71%, 78%, and 91% of the variance respectively.
Standardized factor loadings for the fall latent factor and the Number and Operations (N),
Measurement (M), and Number and Operations and Algebra (A) focal points were .90, .92, and
.90, respectively. Using Bayesian estimation, we compared these parameters using their credible
intervals such that if the 95% credible intervals of two parameters do not overlap, we concluded
that the parameters were meaningfully different. Thus, for the fall standardized factor loadings,
the Measurement (M) loading was meaningfully greater than both the Number and Operations
(N) and Number and Operations and Algebra (A) loadings, which were not different from each
other. For the winter standardized factor loadings, the Number and Operations (N) loading (.84),
was meaningfully less than that for Measurement (M) (.90), which was in turn meaningfully less
than that for Number and Operations and Algebra (A) (.92). And similarly for the spring
standardized factor loadings, the Number and Operations (N) loading (.82), was meaningfully
less than that for Measurement (M) (.86), which was in turn meaningfully less than that for
14
Number and Operations and Algebra (A) (.89). Thus, the results of the relative contribution of
each Grade 2 standard to the within-year seasonal latent math constructs indicated that the
Measurement (M) mattered most in fall, and the Number and Operations and Algebra (A)
mattered most in winter and spring, followed by the Measurement (M). Overall, the Number and
Operations (N) focal point meant less to the Grade 2 latent math factor across the year.
Comparing the focal point factor loadings across seasons, the influence of Number and
Operations (N) on math steadily decreased across the year, with a meaningful decrease from fall
to winter, and a decrease from winter to spring. The influence of Measurement (M) on math also
steadily decreased across the year, with a meaningful decrease from fall to winter from winter to
spring. The trend for the Number and Operations and Algebra (A) is less clear, with a
meaningful increase from fall to winter, and a meaningful decrease from winter to spring.
Objective three: growth trajectory. The estimated means of the Number and
Operations (N), Measurement (M), and Number and Operations and Algebra (A) latent factors
for fall were .52, .50, and .16, respectively, for winter were 1.53, 1.04, and 1.69, and for spring
were 1.85, 1.90, and 1.39. The means increased across nine focal points across a year. Overall,
the means for each focal point increased across the seasons, with the exception of the Number
and Operations and Algebra (A), which, like the factor loading results described above, increased
from fall to winter but decreased from winter to spring. In general, these results were consistent
with the observed means total scores of each focal point.
The estimated trajectory mean for the intercept was 0.52 (variance = 0.55) and for the
slope was 1.00 (variance = 0.05). The estimated time score for the spring factor loadings on the
slope factor (1.32), so the model demonstrated nonlinear growth, with greater gains from fall to
winter than winter to spring. Given the trajectory and the estimated time score estimates, the

15
estimated means of the fall, winter, and spring latent factors were 0.52, 1.53, and 1.85,
respectively, indicating increasing growth rate across a year but a higher growth rate from fall to
winter than from winter to spring. It indicated that students developed their math ability faster
from fall to winter than from winter to spring. Moreover, it demonstrated that on average these
grade 2 students had positive non-linear growth trajectory across the year.
Discussions
In response to our research objectives, our results demonstrated that (a) on average, the
fall measure was the most difficult, followed by spring, and then winter; (b) Measurement (M)
had the strongest relation to the Grade 2 latent math factor in fall, Number and Operations and
Algebra (A) had the strongest relation to math in winter and spring, followed by Measurement
(M), and Number and Operations (N) in general had the weakest relation to math across the year;
and (c) the average Grade 2 math trajectory demonstrated increasing growth rate across the year
but a higher growth rate from fall to winter than from winter to spring. We address these
objectives and results in this discussion.
In general, all nine focal points and three seasonal measures appeared to function well in
terms of item difficulties and discriminations; however, a few items may need to be revised. Our
IRT results suggested that most of easyCBM®
math items were relatively easy (Table 5), a
finding which was expected based on the design of the measure. The easyCBM®
math items
were developed to target the grade-level content standards in a way that would render them
accessible to a wider range of student ability than might be typically expected of assessment
items (e.g., Alonzo & Tindal, 2009). In other words, these measures were designed to better
capture the proficiency and thus growth of low-achieving students by presenting items that
would be more accessible to these students. Accordingly, our results also showed that on
16
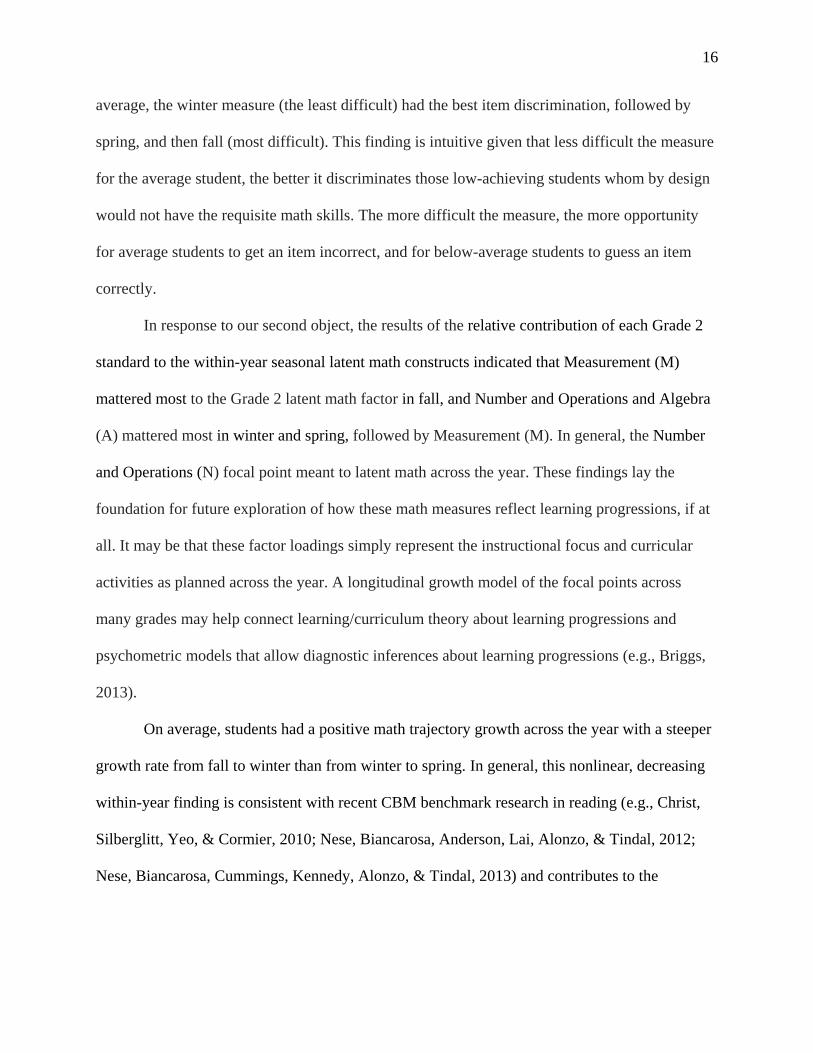
average, the winter measure (the least difficult) had the best item discrimination, followed by
spring, and then fall (most difficult). This finding is intuitive given that less difficult the measure
for the average student, the better it discriminates those low-achieving students whom by design
would not have the requisite math skills. The more difficult the measure, the more opportunity
for average students to get an item incorrect, and for below-average students to guess an item
correctly.
In response to our second object, the results of the relative contribution of each Grade 2
standard to the within-year seasonal latent math constructs indicated that Measurement (M)
mattered most to the Grade 2 latent math factor in fall, and Number and Operations and Algebra
(A) mattered most in winter and spring, followed by Measurement (M). In general, the Number
and Operations (N) focal point meant to latent math across the year. These findings lay the
foundation for future exploration of how these math measures reflect learning progressions, if at
all. It may be that these factor loadings simply represent the instructional focus and curricular
activities as planned across the year. A longitudinal growth model of the focal points across
many grades may help connect learning/curriculum theory about learning progressions and
psychometric models that allow diagnostic inferences about learning progressions (e.g., Briggs,
2013).
On average, students had a positive math trajectory growth across the year with a steeper
growth rate from fall to winter than from winter to spring. In general, this nonlinear, decreasing
within-year finding is consistent with recent CBM benchmark research in reading (e.g., Christ,
Silberglitt, Yeo, & Cormier, 2010; Nese, Biancarosa, Anderson, Lai, Alonzo, & Tindal, 2012;
Nese, Biancarosa, Cummings, Kennedy, Alonzo, & Tindal, 2013) and contributes to the

17
hypothesis that students developed their math ability faster from fall to winter than from winter
to spring.
A similar trend can be observed in the factor loadings of the seasons on Number and
Operations and Algebra (A), which had a meaningful increase from fall to winter, and a
meaningful decrease from winter to spring, and on the focal point means for the Number and
Operations and Algebra (A) across time, which increased from fall to winter but decreased from
winter to spring. The influence of the Number and Operations and Algebra (A) focal point may
have had a strong influence on our growth estimates; that is, the latter may in fact be an artifact
of the former.
Finally, the benchmark measures were designed to be of equivalent difficulty such that
student growth could be measured and interpreted in meaningful ways. Our results showed that
on average, the fall measure was the most difficult, followed by spring, and then winter. This
finding is difficult to explain in terms of application and methods, in that we would expect the
forms to be of equivalent difficulty across the year based on the design and development, but
also model specification. The fact that the measures are not of equivalent difficulty might
suggest that they are not scaled correctly in our model. This is an issue that we intend to further
with simulation studies, as it casts a shadow of uncertainty across all our results.
These results offer only a preliminary, post hoc examination of math growth as it relates
to standards-based assessment as it relates to learning. This study was intended as a starting point
for a research agenda that examines this same relation longitudinally across grades as students’
progress on the learning continuum and standards merge into learning progressions. The long-
term goals of such research are to create research-based learning continua to help analyze or plan
general sequencing of curriculum and to inform CBM assessments along the learning continuum

18
that can assist progress monitoring during the school year (e.g., Hess, 2010). Since we used only
Grade 2 data, one limitation could be the limitation of the generalizability of the result. It would
be interesting to further study students’ longitudinal math growth across the K-8 grade levels,
and to explore a growth mixture models (GMM) to support this study. Also, the choice of
estimator is another interesting topic to further explore.
In conclusion, these results have implications for teachers’ understanding of developing
math skills, and have the potential for informing learning progressions and providing applied
researchers with different growth modeling techniques. Additionally, the developers of
easyCBM®
math may use these results to help improve future math item writing, and potentially
to modify the current tests to improve functioning.

19
References
Alonzo, J., & Tindal, G. (2009). The development of K-8 progress monitoring measures in
mathematics for use with the 2% and general education populations: Kindergarten
(Technical Report No. 0921). Eugene, OR: Behavioral Research and Teaching,
University of Oregon.
Alonzo, J., & Tindal, G. (2012, April). Teachers’ manual for regular easyCBM: Getting the most
out of the system. University of Oregon.
Alonzo, J., Tindal, G., Ulmer, K., & Glasgow, A. (2006). easyCBM® online progress
monitoring assessment system. http://easycbm.com. Eugene, OR: University of Oregon,
Behavioral Research and Teaching.
Anderson, D., & Irvin, P. S. (2012). Within-year growth in math: Implications for RTI and school
accountability. Manuscript in preparation.
Burns, M., VanDerHeyden, A., & Jiban, C. (2006). Assessing the instructional level for mathematics: A
comparison of methods. School Psychology Review, 35, 401-418.
Briggs, D. (2013, winter). Interview with Professor Derek Briggs: Learning progressions. D’News,
22(2). Retrieved from http://www.aera.net/Portals/38/docs/Divisions/DivisionD/AERA%20D-
News%20Winter%202013_Final.pdf
Christ, T., Sculin, S., Tolbize, A., & Jiban, C. (2008). Implication of recent research: Curriculum-based
measurement of math computation. Assessment for Effective Intervention, 33, 198-205. doi:
10.1177/1534508407313480.
Christ, T. J., Silberglitt, B., Yeo, S., & Cormier, D. (2010). Curriculum-based measurement of
oral reading: An evaluation of growth rates and seasonal effects among students served in
general and special education. School Psychology Review, 39, 447-462.
20
Christ, T., & Vining, O. (2006). Curriculum-based measurement procedures to develop multiple-
skill mathematics computation probes: Evaluation of random and stratified stimulus-set
arrangements. School Psychology Review, 35, 387-400.
Clements, D. H. (2004). Major themes and recommendations. In D. H. Clements and J. Sarama
(Eds.), Engaging young children in mathematics: Standards for early childhood
Mathematics education (pp. 7–76). Mahwah, NJ: Lawrence Erlbaum.
Clements, D. H., & Sarama, J. (2009). Learning and teaching early math: The learning
trajectories approach. Florence, KY: Routledge
Deno, S. (2003). Developments in curriculum-based measurement. The Journal of Special
Education, 37, 184-192. doi: 10.1177/00224669030370030801
Deno, S., Marston, D., & Tindal, G. (1985). Direct and frequent curriculum-based measurement:
An alternative for educational decision making. Special Services in the Schools, 2, 5-27.
Foegen, A., Jiban, C., & Deno, S. (2007). Progress monitoring measures in mathematics: A review of
the literature. The Journal of Special Education, 41, 121-139. doi:
10.1177/00224669070410020101.
Fuchs, L. S. (2004). The past, present, and future of curriculum-based measurement research.
School Psychology Review, 33, 188-192.
Fuchs, D., & Fuchs, L. S. (2006). Introduction to responsiveness-to-intervention: What, why, and how
valid is it? Reading Research Quarterly, 4, 93–99.
Fuchs, L., Fuchs, D., Compton, D., Bryant, J., Hamlett, C., & Seethaler, P. (2007). Mathematics
screening and progress monitoring at first grade: Implications for responsiveness to intervention.
Exceptional Children, 73(3).

21
Fuchs, L., Fuch, D., & Courey, S. (2005). Curriculum-based measurement of mathematics
competence: From competence to concepts and applications to real life problem solving.
Assessment for Effective Intervention, 30, 33-46. doi: 10.1177/073724770503000204.
Good, R., & Jefferson, G. (1998). Contemporary perspectives on curriculum-based measurement
validity. In M. Shinn (Ed.), Advanced applications of curriculum-based measurement
(pp. 61-88). New York: Guilford Press.
Hess, K. K., (2010, December). Learning progressions frameworks designed for use with the Common
Core State Standards in mathematics K-12. National Alternate Assessment Center at the
University of Kentucky and the National Center for the Improvement of Educational
Assessment, Dover, N.H. (updated- v.3).
Jiban, C., & Deno, S. (2007). Using math and reading curriculum-based measurements to predict state
mathematics test performance: Are simple one-minute measures technically adequate?
Assessment for Effective Intervention, 32, 78-89. doi: 10.1177/15345084070320020501
Kamata, A. & Bauer, D. J. (2008). A note on the relationship between factor analytic and item
response theory models. Structural Equation Modeling. 15, 136-153.
Kelley, B., Hosp, J. L., & Howell, K. W. (2008). Curriculum-based evaluation and math: An
overview. Assessment for Effective Intervention, 33, 250-256.
Lembke, E. S., Hampton, D., & Beyers, S. J. (2012). Response to intervention in mathematics: Critical
elements. Psychology in the Schools, 49, 257-272. doi: 10.1002/pits.21596
Lembke, E., & Stecker, P. (2007). Curriculum-based measurement in mathematics: An evidence-based
formative assessment procedure. Portsmouth, NH: RMC Research Corporation, Center on
Instruction.

22
Mazzocco, M. M. M., & Thompson, R. E. (2005). Kindergarten predictors of math learning disability.
Learning Disabilities Research & Practice, 20, 142–155. doi:10.0000/j.1540-5826.2005.00129.x
Messick, S. (1995). Standards of validity and the validity of standards in performance assessment.
Educational Measurement: Issues and Practice, 14, 5-8. doi: 10.1111/j.1745-
3992.1995.tb00881.x.
Missall, K. N., Mercer, S. H., Martinez, R. S., & Casebeer, D. (2012). Concurrent and
longitudinal patterns and trends in performance on early numeracy curriculum-based
measures in kindergarten through third grade. Assessment for Effective Intervention, 37,
95-106.
Mosher, F. A. (2011). The role of learning progressions in standards-based education reform.
CPRE Policy Brief. University of Pennsylvania. Available: http://www.cpre.org/role-
learning-progressions-standards-based-education-reform.
Muthén, L.K. and Muthén, B.O. (1998-2010). Mplus User’s Guide. Sixth Edition. Los Angeles,
CA: Muthén & Muthén.
National Council of Teachers of Mathematics. (2006). Curriculum focal points for
prekindergarten through grade 8 mathematics: A quest for coherence. Reston, VA:
Author.
National Governors Association Center for Best Practices, Council of Chief State School
Officers (2010). Common Core State Standards for Mathematics. National Governors
Association Center for Best Practices, Council of Chief State School Officers,
Washington D.C.

23
Nese, J. F. T., Biancarosa, G., Anderson, D., Lai, C. F., & Tindal, G. (2012). Within-year oral
reading fluency with CBM: A comparison of models. Reading and Writing, 25, 887-915.
doi: 10.1007/s11145-011-9304-0
Nese, J. F. T., Biancarosa, G., Cummings, K., Kennedy, P., Alonzo, J., Tindal, G. (2013). In
search of average growth: Describing within-year oral reading fluency growth for
grades 1-8. Manuscript submitted for publication.
Patarapichayatham, C., Anderson, D., & Kamata, A. (2012). Monitoring mathematic
achievement during the middle school transition: an application of latent transition
analysis (LTA). Manuscript submitted for publication.
Saez,L., Lai, C. F. & Tindal, G. (2012). Learning progressions: Tools for assessment and instruction
for all learners. Eugene, OR: Behavioral Research and Teaching, University of Oregon.
Seethaler, P., & Fuchs, L. (2011). Using curriculum-based measurement to monitor kindergarteners'
mathematics development. Assessment For Effective Intervention, 36(4), 219-229. doi: DOI:
10.1177/1534508411413566.
Speece, D. L., Case, L. P., & Molloy, D. E. (2003). Responsiveness to general education instruction as
the first gate to learning disabilities identification. Learning Disabilities Research and Practice,
18, 147-156.
Shapiro, E., Edwards, L., & Zigmond, N. (2005). Progress monitoring of mathematics among students
with learning disabilities. Assessment for Effective Intervention, 30(2), 15-32. doi:
10.1177/073724770503000203.
Tindal, G. (2013). Curriculum-based measurement: A brief history of nearly everything from the 1970s
to the present. [Review Article]. ISRN Education (International Scholarly Research Network)
2013, 29. doi:10.1155/2013/958530

24
Tindal, G., Fuchs, L., Fuchs, D., Shinn, M., Deno, S., & Germann, G. (1985). Empirical validation of
criterion-referenced tests. Educational Researcher, 78, 203-209.

25
Table 1
Grade 2 Common Core State Standards (CCSS) and National Council of Teachers of
Mathematics Curriculum (NCTM) Focal Point Standards
Organization Standard /Focal Point Description
CCSS Numbers & Operations in Base Ten “Understand place value. Use place
value understanding and properties of
operations to add and subtract.”
NCTM Numbers and Operations “Developing an understanding of the
base-ten numeration system and place-
value concepts”
CCSS Operations & Algebraic Thinking “Represent and solve problems
involving addition and subtraction.
Add and subtract within 20. Work with
equal groups of objects to gain
foundations for multiplication.”
NCTM Numbers and Operations and Algebra “Developing quick recall of addition
facts and related subtraction facts and
fluency with multi-digit addition and
subtraction”
CCSS Measurement & Data “Measure and estimate lengths in
standard units. Relate addition and
subtraction to length. Work with time
and money. Represent and interpret
data.”
NCTM Measurement “Developing an understanding of
linear measurement and facility in
measuring lengths”
CCSS Geometry “Reason with shapes and their
attributes.”
26
Table 2
Mean and Standard Deviation of Total Scores of Each Measure
Measure n Mean SD
Fall 17,816 24.66 6.73
Winter 17,816 31.17 8.40
Spring 17,816 34.69 7.20

27
Table 3
Mean and Standard Deviation of Total Scores of each Focal Point within Each Measure
Focal point Mean SD
Fall Numbers and Operations (N) 8.73 2.83
Fall Measurement (M) 8.17 2.71
Fall Numbers, Operations, and Algebra (A) 7.76 2.67
Winter Numbers and Operations (N) 11.06 3.03
Winter Measurement (M) 8.60 3.12
Winter Numbers, Operations, and Algebra (A) 11.50 3.63
Spring Numbers and Operations (N) 10.77 3.11
Spring Measurement (M) 12.40 2.49
Spring Numbers, Operations, and Algebra (A) 11.53 2.93
Note. n = 17,816.

28
Table 4
Correlations between Total Score of each Focal Point and Total Score of each Measure
W S FN FM FA WN WM WA SN SM SA
F .73** .65** .84** .82** .81** .59** .67** .63** .58** .51** .54**
W .77** .67** .57** .55** .84** .85** .89** .69** .59** .67**
S .58** .52** .50** .65** .65** .68** .86** .80** .86**
FN .52** .52** .58** .57** .57** .55** .44** .48**
FM .48** .48** .56** .48** .45** .44** .42**
FA .42** .50** .49** .44** .38** .43**
WN .56** .62** .63** .47** .54**
WM .63** .57** .54** .54**
WA .58** .51** .63**
SN .52** .61**
SM .57**
Note. ** Correlation is significant at the .01 level (2-tailed), F = Fall, W = Winter, S = Spring,
FN = Fall Numbers and Operations (N), FM = Fall Measurement (M), FA = Fall Numbers,
Operations, and Algebra (A), WN = Winter Numbers and Operations (N), WM = Winter
Measurement (M), WA = Winter Numbers, Operations, and Algebra (A), SN = Spring Numbers
and Operations (N), SM = Spring Measurement (M), and SA = Spring Numbers, Operations, and
Algebra (A).

29
Table 5
Item Difficulties for each Focal Point
Item
Focal Point
FN FM FA WN WM WA SN SM SA
1 0 0 0 0 0 0 0 0 0
2 0.44 -0.16 0.09 -0.78 0.40 -0.14 0.82 0.21 -0.75
3 0.29 -0.53 -0.01 0.05 0.14 -0.84 0.38 -0.28 -0.84
4 -1.29 -0.29 -0.17 -2.23 -1.16 -0.68 -2.52 -1.33 -0.11
5 -0.08 1.05 -0.30 -1.63 -1.19 -0.98 0.18 -1.15 -0.63
6 0.39 -0.13 0.26 0.74 -1.14 -1.25 -1.50 -0.24 -0.59
7 1.00 -0.45 -0.46 0.45 -0.82 -0.94 0.92 -0.59 0.06
8 0.67 0.26 0.06 -2.43 -1.13 -0.91 -0.55 -0.49 0.01
9 -0.55 -0.41 -0.37 -0.60 -1.23 -1.08 -0.36 0.02 -0.67
10 0.60 -0.51 -0.29 -0.98 -0.73 -0.49 -2.85 -0.36 -1.08
11 -0.07 -0.04 -0.25 -2.36 -0.80 -1.07 -2.74 -0.11 -0.48
12 -0.43 -0.38 -0.38 -2.75 -2.50 -0.40 0.09 -0.13 -1.26
13 -1.28 -0.45 -0.48 0.32 -0.83 -0.66 -2.32 0.01 -0.79
14 -1.31 -0.31 -0.59 -1.74 -0.86 -1.20 -2.64 -0.45 -1.23
15 0.65 0.44 0.16 -1.63 - -0.97 0.45 -0.59 -0.03
16 - - - - - -0.47 - - -
FP
Mean (SD)
-0.06
(0.76)
-0.13
(0.43)
-0.18
(0.26)
-1.04
(1.16)
-0.85
(0.71)
-0.76
(0.37)
-0.84
(1.42)
-0.37
(0.43)
-0.56
(0.46)
Season
Mean (SD) -0.12 (0.52) -0.88 (0.80) -0.59 (0.90)
Note. FN = Fall Numbers and Operations (N), FM = Fall Measurement (M), FA = Fall Numbers,
Operations, and Algebra (A), WN = Winter Numbers and Operations (N), WM = Winter
Measurement (M), WA = Winter Numbers, Operations, and Algebra (A), SN = Spring Numbers
and Operations (N), SM = Spring Measurement (M), and SA = Spring Numbers, Operations, and
Algebra (A), and PF = focal point.
30
Table 6
Item Discriminations for each Focal Point
Item
Focal Point
FN FM FA WN WM WA SN SM SA
1 0.83 0.77 0.26 2.83 0.56 0.90 0.95 0.93 0.66
2 0.89 0.56 0.62 0.51 0.48 0.60 0.39 0.57 1.43
3 0.98 0.34 0.77 0.44 0.66 1.01 0.66 0.88 0.91
4 0.03 0.13 0.27 0.73 0.69 0.76 1.15 0.76 0.78
5 0.83 0.52 0.12 3.30 0.61 0.96 0.69 1.40 0.67
6 0.70 0.26 0.85 1.24 0.71 1.09 1.83 1.30 0.99
7 0.71 0.70 0.27 1.95 0.96 1.05 0.52 1.55 0.56
8 0.52 0.58 0.79 0.85 0.82 0.71 1.03 0.35 0.51
9 0.76 0.41 0.33 3.63 0.60 0.93 0.94 0.74 0.96
10 0.94 0.38 0.03 0.86 0.57 0.85 1.47 1.06 0.78
11 0.86 0.47 0.71 0.82 0.60 1.04 1.63 0.53 0.59
12 0.58 0.31 0.11 1.86 1.01 0.59 0.37 0.45 0.86
13 0.14 0.31 0.35 2.83 0.40 0.63 1.41 0.40 0.49
14 0.25 0.26 0.21 0.51 1.02 0.73 1.72 0.94 0.60
15 0.94 0.62 0.73 0.44 - 0.72 0.85 1.23 0.51
16 - - - - - 0.84 - - -
FP
Mean (SD)
0.66
(0.30)
0.44
(0.18)
0.43
(0.28)
1.52
(1.13)
0.69
(0.19)
0.84
(0.17)
1.04
(0.48)
0.87
(0.38)
0.75
(0.25)
Season
Mean (SD) 0.51 (0.28) 1.02 (0.75) 0.89 (0.39)
Note. FN = Fall Numbers and Operations (N), FM = Fall Measurement (M), FA = Fall Numbers,
Operations, and Algebra (A), WN = Winter Numbers and Operations (N), WM = Winter
Measurement (M), WA = Winter Numbers, Operations, and Algebra (A), SN = Spring Numbers
and Operations (N), SM = Spring Measurement (M), and SA = Spring Numbers, Operations, and
Algebra (A), and FP = focal point.

31
F W S
Figure 1. The 2PL third-order item response theory growth model, in which the three focal
points – Numbers and Operations (N), Measurement (M), and Numbers, Operations, and Algebra
(A) – are the first-order factors of the fall (F), winter (W), and spring (S) latent factors, which are
the three second-order factors. (I) represents the intercept, or fall initial status, and (S) represents
the within-year slope for the latent growth curve model.
1 15 15 … 1 … 1 15 … 16 … 1 1 … 15 15 … 1 1 … … … 15 15 14
I S
N
O
O
M A
1 1
M N A N M A
1 1
1 1 *