1 working in rural ireland mark o’ brien and thia hennessy mark o’ brien and thia hennessy rural...
TRANSCRIPT

11
Working in Rural IrelandWorking in Rural Ireland
Mark O’ Brien andMark O’ Brien and Thia Thia HennessyHennessy
Rural Economy Rural Economy Research Centre, Research Centre, AthenryAthenry
This research is funded by the Research Stimulus Fund 2005
22
OutlineOutline Changing Sectors of EmploymentChanging Sectors of Employment
Regional ImplicationsRegional Implications
Changing Role of AgricultureChanging Role of Agriculture
Emergence of Part-Time FarmingEmergence of Part-Time Farming
Sustainability of Part-Time FarmingSustainability of Part-Time Farming
Longer Outlook for Labour MarketLonger Outlook for Labour Market

33
IntroductionIntroduction The structure of the Irish Labour Market has The structure of the Irish Labour Market has
transformed.transformed.
Traditional sectors (e.g. Agri & Industrial Traditional sectors (e.g. Agri & Industrial Production) have declined in importanceProduction) have declined in importance
The decline in the importance of these sectors has The decline in the importance of these sectors has been replaced by;been replaced by; Electronics.Electronics. Pharmaceuticals and medical instrumentation.Pharmaceuticals and medical instrumentation. Construction.Construction. Tourism.Tourism. Internationally traded financial sectors.Internationally traded financial sectors.

44
Annual Average Employment Growth by Sector, 2000-2005 and 2004-Annual Average Employment Growth by Sector, 2000-2005 and 2004-2005 2005
Source: CSOSource: CSO
-5 0 5 10 15 20
Construction
Health
Other Services
Fin & Other Bus Services
Education
Manuf & other ind
Agri., For & FishGrowth 2004-2005
Growth 2000-2005

55
Are the changes in employment regionally Are the changes in employment regionally balanced?balanced?
The country is divided into 3 regions:The country is divided into 3 regions: DMEDME which comprises of Dublin and the Mid-East. which comprises of Dublin and the Mid-East. BMWBMW which is the Border, Midlands and West region. which is the Border, Midlands and West region. RESTREST region which is composed of the Mid West, South region which is composed of the Mid West, South
East and South West.East and South West.
Employment by SectorEmployment by Sector
Regional ImplicationsRegional Implications

66
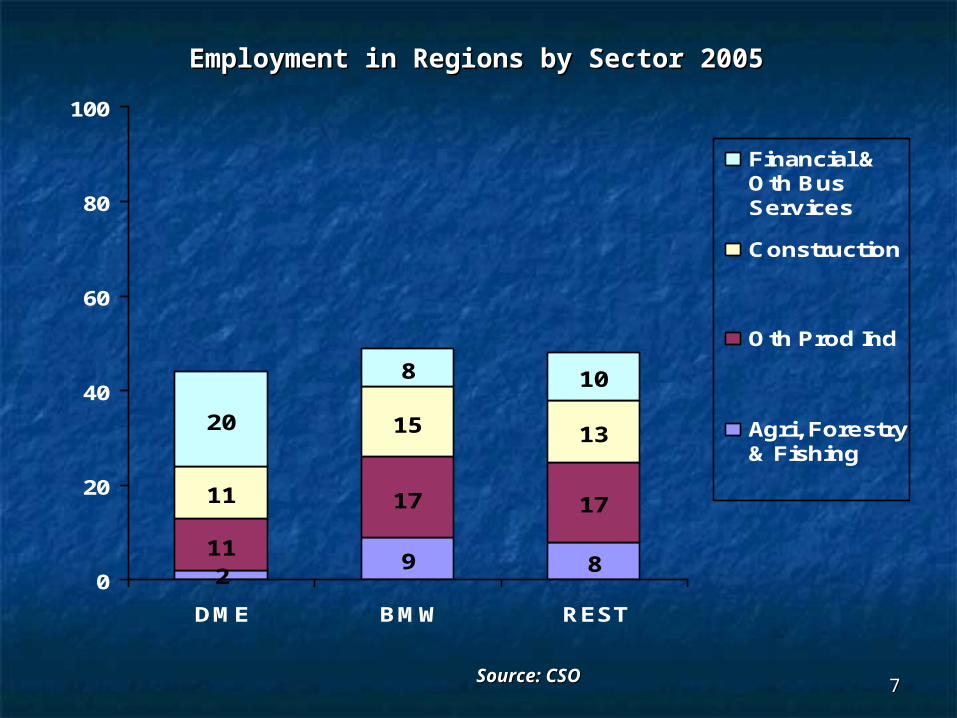
Employment in Regions by Sector 2005Employment in Regions by Sector 2005
Source: CSOSource: CSO
9 811
17 1711
15 13
20
20
40
60
80
100
DME BMW REST
Construction
Oth Prod Ind
Agri, Forestry& Fishing
77
Employment in Regions by Sector 2005Employment in Regions by Sector 2005
Source: CSOSource: CSO
9 811
17 1711
15 1320
8 10
20
20
40
60
80
100
DME BMW REST
Financial &Oth BusServices
Construction
Oth Prod Ind
Agri, Forestry& Fishing

88
Employment in Regions by Sector 2005Employment in Regions by Sector 2005
Source: CSOSource: CSO
9 811
17 1711
15 1320
8 10
1716 17
20
20
40
60
80
100
DME BMW REST
Education &Health
Financial &Oth BusServices
Construction
Oth Prod Ind
Agri, Forestry& Fishing

99
Employment in Regions by Sector 2005Employment in Regions by Sector 2005
9 811
17 1711
15 1320
8 10
1716 17
39 35 35
20
20
40
60
80
100
DME BMW REST
Other
Education &Health
Financial &Oth BusServicesConstruction
Oth Prod Ind
Agri, Forestry& Fishing
Source: CSOSource: CSO

1010
Regional ImplicationsRegional Implications
BMW and REST more reliant on traditional industries.BMW and REST more reliant on traditional industries.
These regions are also dependent on construction?These regions are also dependent on construction?
DME has more knowledge based jobs.DME has more knowledge based jobs.
Can Rural Areas compete for knowledge based jobs?Can Rural Areas compete for knowledge based jobs?
Forfás predict that 68% of new employment in the Forfás predict that 68% of new employment in the period 2004 to 2010 will require third level period 2004 to 2010 will require third level qualifications.qualifications.
1111
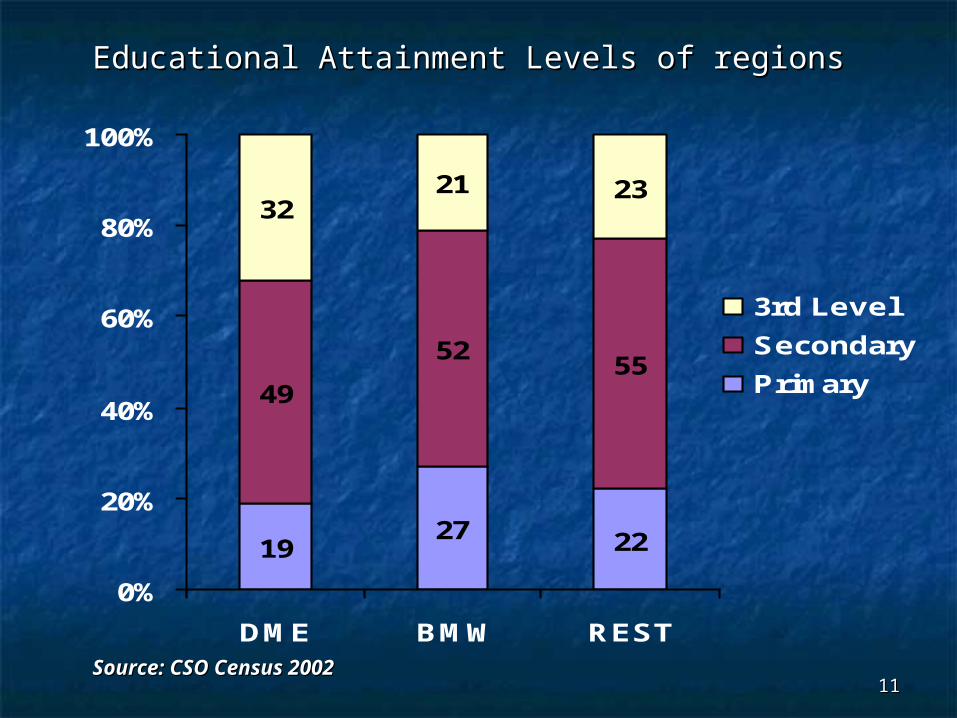
Educational Attainment Levels of regionsEducational Attainment Levels of regions
Source: CSO Census 2002Source: CSO Census 2002
1927 22
49
5255
3221 23
0%
20%
40%
60%
80%
100%
DME BMW REST
3rd Level
Secondary
Primary

1212
The Changing Role of The Changing Role of AgricultureAgriculture

1313
OutlineOutline
Decreasing numbers employed in Decreasing numbers employed in AgricultureAgriculture
More farmers relying on Non-Farm IncomeMore farmers relying on Non-Farm Income
Policy accelerating this shiftPolicy accelerating this shift
Sustainability of this trend?Sustainability of this trend?

1414
Employment in Agriculture 1985-2004Employment in Agriculture 1985-2004
Source: CSOSource: CSO
0
2
4
6
8
10
12
14
16
1985 1990 1995 2000 2004
Agriculture as a %of totalemployment

1515
Increased reliance on Off-farm IncomeIncreased reliance on Off-farm Income
Percentage of Farm Households with off-farm jobs, 1993-Percentage of Farm Households with off-farm jobs, 1993-20052005
Sources:Sources: Teagasc (National Farm Survey) Teagasc (National Farm Survey)
0
10
20
3040
50
60
70
80
90
100
1993 1997 2001 2005
Holder or Spouse(%)
Holder (%)
Spouse (%)

1616
Economic Groupings Of FarmsEconomic Groupings Of Farms
Viable:Viable: A farm is economically viable if it can; A farm is economically viable if it can; (a) remunerate family labour at the average agricultural (a) remunerate family labour at the average agricultural
wage, wage, andand (b) provide a 5 per cent return on non-land assets.(b) provide a 5 per cent return on non-land assets.
Sustainable:Sustainable: Farms may be non-viable but farmer Farms may be non-viable but farmer
and/or spouse may work off farm.and/or spouse may work off farm.
Vulnerable:Vulnerable: Non-viable farms where neither farmer nor Non-viable farms where neither farmer nor
spouse work off-farmspouse work off-farm

1717
Viability of FarmingViability of Farming The Agri-Vision 2015 report concluded that:The Agri-Vision 2015 report concluded that:
1. The number of economically viable farm businesses is 1. The number of economically viable farm businesses is in decline.in decline.
2. A large number of farm households are sustainable 2. A large number of farm households are sustainable only because of the presence of off-farm income.only because of the presence of off-farm income.
NFS 2004 data show; NFS 2004 data show; 30 per cent of the farms were economically viable.30 per cent of the farms were economically viable. 54 per cent were sustainable.54 per cent were sustainable. 16 per cent were vulnerable.16 per cent were vulnerable.
Without off-farm employment, 70 per cent of the Without off-farm employment, 70 per cent of the farm families would be in a vulnerable position.farm families would be in a vulnerable position.
The long term sustainability of farming depends The long term sustainability of farming depends on the availability of off-farm employment. on the availability of off-farm employment.
1818
Impact of PolicyImpact of Policy
Decoupling reduced the return to farm labour.Decoupling reduced the return to farm labour.
Our Economic Modelling suggests more farmers Our Economic Modelling suggests more farmers and spouses will seek off-farm employment.and spouses will seek off-farm employment.
Will they be able to secure jobs in the ever Will they be able to secure jobs in the ever changing economy?changing economy?

1919
Current Employment - OperatorCurrent Employment - OperatorEmployment by Sector for Farm OperatorsEmployment by Sector for Farm Operators
Source: NFSSource: NFS
0
20
40
60
80
100
Agriculture Construction Manufacturing Services Other

2020
Future Employment - OperatorFuture Employment - Operator
50% of farm operators are employed in traditional 50% of farm operators are employed in traditional industries and construction.industries and construction.
The Outlook for these sectors is not good – as The Outlook for these sectors is not good – as Jasmina Behan will outlineJasmina Behan will outline
Educational attainment levels are a good Educational attainment levels are a good indicator to the ability to attain non-farm indicator to the ability to attain non-farm employment in the changing economyemployment in the changing economy

2121Source: CSO
Education Profile of Working Age Farmers (2004)Education Profile of Working Age Farmers (2004)
0
10
20
30
40
50
60
70
80
90
100
NoFormal/Primary
LowerSecondary
UpperSecondary
Post LeavingCert
Third Level
15-65
55-65

2222
Current Employment - SpouseCurrent Employment - Spouse
14 139 8 6
30
20
0
5
10
15
20
25
30
35
Source: NFSSource: NFS
Employment by Sector for Spouses

2323
Employment ProspectsEmployment Prospects
Farmers employed in traditional industries and Farmers employed in traditional industries and constructionconstruction
Long term prospects poorLong term prospects poor
Re-training requiredRe-training required
Spouses mostly employed in Education & Health.Spouses mostly employed in Education & Health.
Better Long Term Prospects.Better Long Term Prospects.

2424
ConclusionsConclusions Changing Structures of Employment. Changing Structures of Employment.
Traditional industries in decline.Traditional industries in decline.
Regions such as BMW and REST more reliant on traditional Regions such as BMW and REST more reliant on traditional industries and construction.industries and construction.
The number of economically viable farm businesses is in The number of economically viable farm businesses is in decline.decline.
Farm operator’s off-farm employment tended to be Farm operator’s off-farm employment tended to be employed in the more “traditional” sectors and construction employed in the more “traditional” sectors and construction - Sectors in decline.- Sectors in decline.
Farm Operators have low levels of educationFarm Operators have low levels of education
Therefore re-training of farm operators is requiredTherefore re-training of farm operators is required..