1 wraparound fidelity: what does the national research tell us? eric j. bruns, ph.d. and april...
Post on 22-Dec-2015
216 views
TRANSCRIPT
1
Wraparound Fidelity: What does the national research tell us?
Eric J. Bruns, Ph.D. and April Sather, MPHUniversity of Washington School of MedicineDiv. Public Behavioral Health and Justice [email protected] / [email protected]://depts.washington.edu/wrapeval www.rtc.pdx.edu/nwi
Building on Family Strengths Conference
Portland OregonJune 25, 2009

2John D. Burchard, University of Vermont

3
Overview of the session• Background – the importance of fidelity
in human services• What is “fidelity” in wraparound
implementation?• How does one measure it?• What is the evidence that our fidelity
measures are reliable and valid?• What do the data tell us about
wraparound implementation nationally?• What is the connection to youth and
family outcomes?

4
Implementation with High Fidelity Requires…
County Context and Readiness
StaffSelection
Training
Supervision and
Coaching
Performance Management
ProgramEvaluation
OrganizationalSupports
State Support
National Implementation Research Network (NIRN)

5
Fidelity is critical to outcomes
Higher levels of fidelity to organizational level assessment for ACT was associated with greater reductions in days spent in psychiatric hospitals (McGrew, Bond, Dietzen & Salyers, 1994)
Improved youth delinquency outcomes for higher fidelity Teaching Family model (Kirigin et. al. 1982)
Improved youth delinquency outcomes for higher fidelity MST (Henggler, Melton, Browndino, Scherer & Hanley, 1997)
Better overall outcomes for youth receiving model adherent FFT (Alexander, Pugh, Parsons and Sexton, 2000)
Better outcomes for school-wide behavioral management when implemented with fidelity (Felner et. al. 2001)

6
Monitoring quality of implementation of child and family teams
• Have facilitators and team members fill out activity checklists
• Look at plans of care and meeting notes
• Sit in on and observe team meetings
• Ask the people who know– parents, youth, facilitators, program heads

7
Wraparound Fidelity Assessment System
WFAS
WFI-4
TO
M
CSWI
Doc
Rev
iew
WFI-4 – Wraparound
Fidelity Index
CSWI – Community Supports for
Wraparound Index
DRM - Document Review Measure
TOM – Team Observation
Measure
8
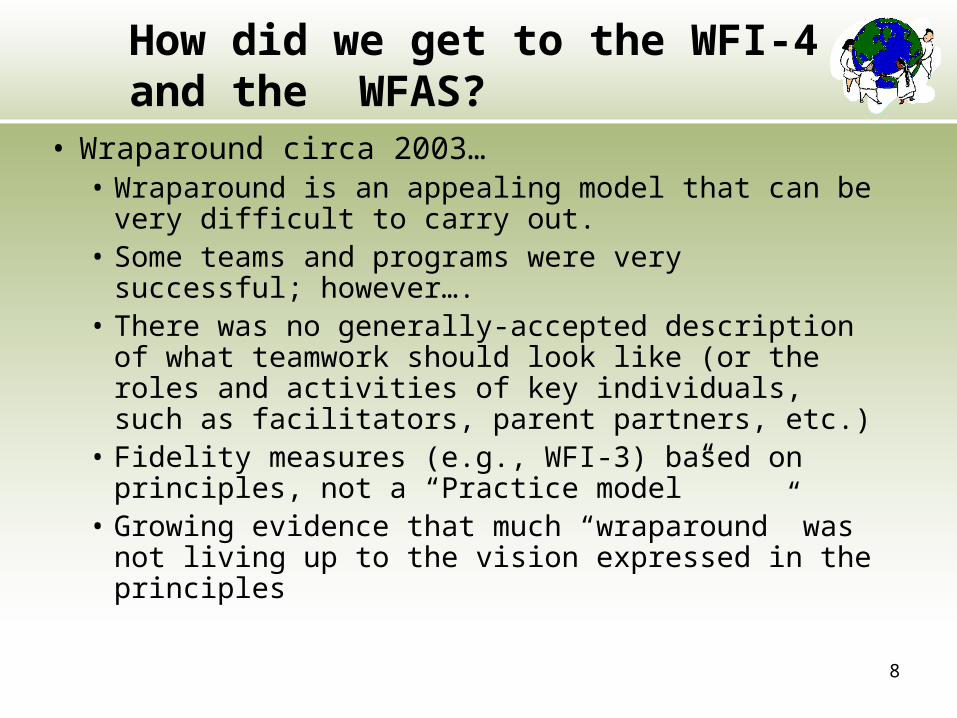
How did we get to the WFI-4 and the WFAS?
• Wraparound circa 2003…• Wraparound is an appealing model that can be
very difficult to carry out.• Some teams and programs were very successful;
however….• There was no generally-accepted description of
what teamwork should look like (or the roles and activities of key individuals, such as facilitators, parent partners, etc.)
• Fidelity measures (e.g., WFI-3) based on principles, not a “Practice model”
• Growing evidence that much “wraparound” was not living up to the vision expressed in the principles

9
Formation of the NWIThe National Wraparound Initiative formed in
2003• Group of diverse stakeholders with high levels
of experience with wraparound, including the most successful programs
• Open membership, using collaboration and consensus-building processes to:• Provide guidelines for wraparound practice• Describe necessary organizational and system
supports• Provide an opportunity to share tools, resources,
techniques, and other forms of support• Develop fidelity measures

10
Resource Guide to Wraparound
• www.wrapinfo.org• ~ 50 chapters plus appendices
• All existing NWI products plus further information about•Wraparound and its history and evolution•Putting principles into practice•Training, coaching, supervision•Specialized roles in wraparound implementation•Implementation assessment•Finance

11
The Wraparound Fidelity Index, version 4
• Assesses implementation of the wraparound process through brief interviews with multiple respondents• Caregivers• Youths• Wraparound Facilitators• Team Members
• Found to possess good psychometric characteristics• Test-retest reliability• Inter-rater agreement• Internal consistency
• Used in research on wraparound• Even more widely as a quality assurance
mechanism by wrap programs

12
Wraparound Fidelity Index, v.4
• Items on the principles and core activities, organized by the 4 phases of wraparound• Engagement: Did you select the people who would
be on your youth and family team?• Principle = Team based
• Planning: Does the plan include strategies for helping your child get involved with activities in the community?
• Principle = Community based• Implementation: Does the team evaluate progress
toward the goals of the plan at every team meeting?• Principle = Outcome based
• Transition: Will some members of your team be there to support you when formal wraparound is complete?
• Principle = Persistence
13
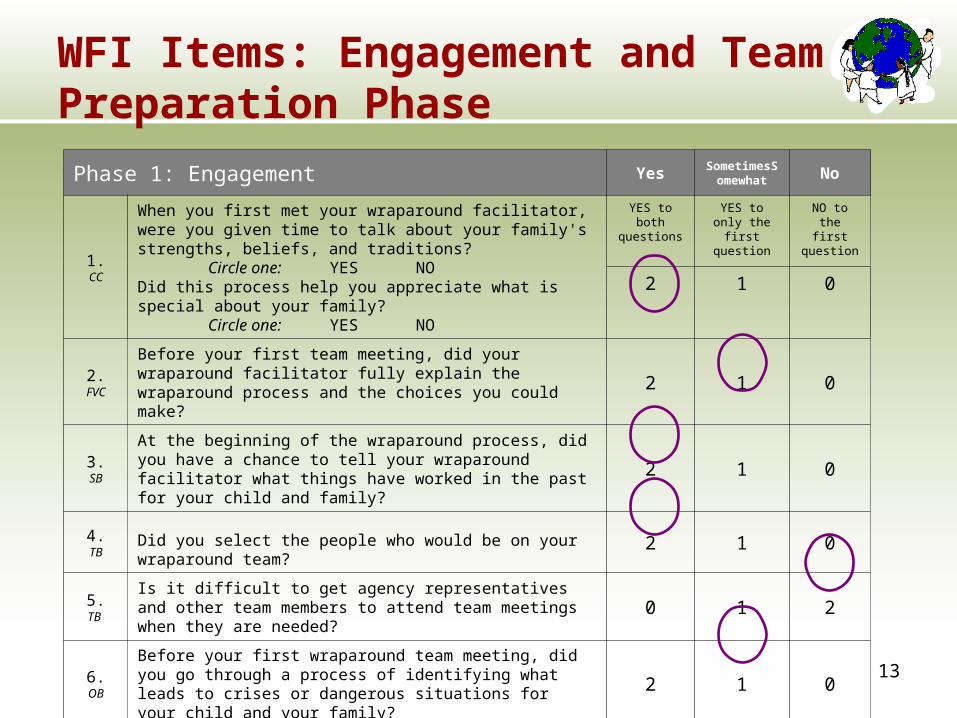
WFI Items: Engagement and Team Preparation Phase
Phase 1: Engagement Yes SometimesSomewhat No
1.CC
When you first met your wraparound facilitator, were you given time to talk about your family's strengths, beliefs, and traditions? Circle one: YES NODid this process help you appreciate what is special about your family? Circle one: YES NO
YES to both questions
YES to only the first question
NO to the first
question
2 1 0
2.FVC
Before your first team meeting, did your wraparound facilitator fully explain the wraparound process and the choices you could make?
2 1 0
3.SB
At the beginning of the wraparound process, did you have a chance to tell your wraparound facilitator what things have worked in the past for your child and family?
2 1 0
4.TB
Did you select the people who would be on your wraparound team?
2 1 0
5.TB
Is it difficult to get agency representatives and other team members to attend team meetings when they are needed?
0 1 2
6.OB
Before your first wraparound team meeting, did you go through a process of identifying what leads to crises or dangerous situations for your child and your family?
2 1 0
14
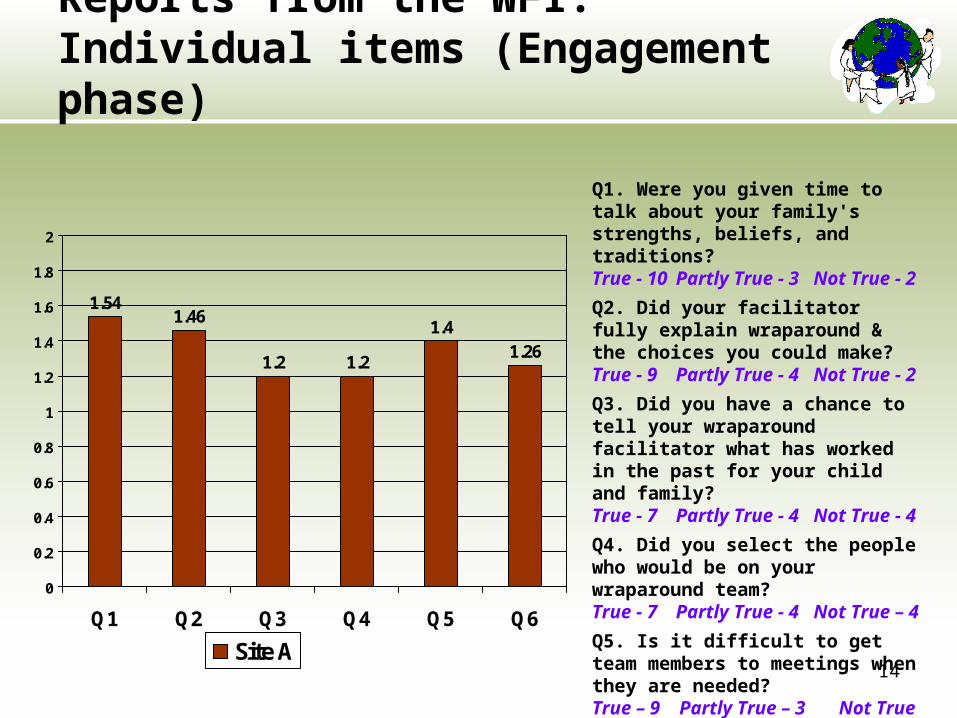
Reports from the WFI:Individual items (Engagement phase)
Q1. Were you given time to talk about your family's strengths, beliefs, and traditions?True - 10 Partly True - 3 Not True - 2
Q2. Did your facilitator fully explain wraparound & the choices you could make? True - 9 Partly True - 4 Not True - 2
Q3. Did you have a chance to tell your wraparound facilitator what has worked in the past for your child and family? True - 7 Partly True - 4 Not True - 4
Q4. Did you select the people who would be on your wraparound team? True - 7 Partly True - 4 Not True – 4
Q5. Is it difficult to get team members to meetings when they are needed? True – 9 Partly True – 3 Not True - 3
Q6. Did you go through a process of identifying what leads to crises for yr family? True – 8 Partly True – 3 Not True - 4
1.541.46
1.2 1.2
1.4
1.26
0
0.2
0.4
0.6
0.8
1
1.2
1.4
1.6
1.8
2
Q1 Q2 Q3 Q4 Q5 Q6
Site A

15
WFI-4: Discriminant Validity
50
60
70
80
90
100P
erce
nt
of
tota
l fid
elit
y
Facilitator 83.8 73.6
Caregiver 77.1 61.2
Youth 73.6 60.1
Team Member 78.4 70.1
Wrap sites (n=12)Non-wrap sites
(n=4)
16
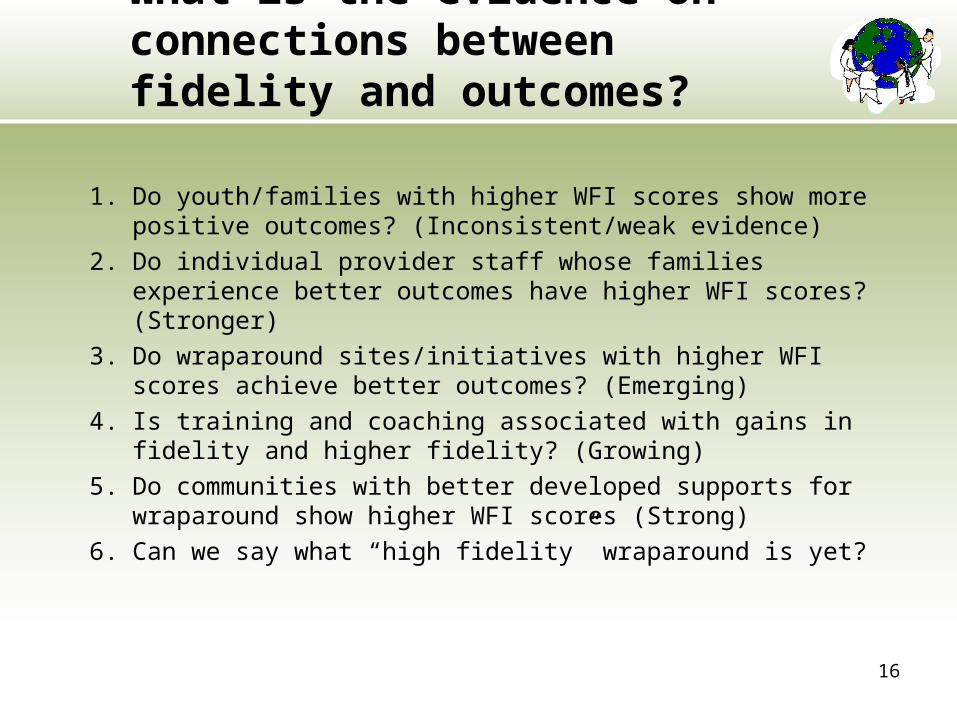
What is the evidence on connections between fidelity and outcomes?
1. Do youth/families with higher WFI scores show more positive outcomes? (Inconsistent/weak evidence)
2. Do individual provider staff whose families experience better outcomes have higher WFI scores? (Stronger)
3. Do wraparound sites/initiatives with higher WFI scores achieve better outcomes? (Emerging)
4. Is training and coaching associated with gains in fidelity and higher fidelity? (Growing)
5. Do communities with better developed supports for wraparound show higher WFI scores (Strong)
6. Can we say what “high fidelity” wraparound is yet?

17
Associations between fidelity and outcomes at the family level
1. Bruns, E.J., Suter, J.S., Force, M.D., & Burchard, J.D. (2005). Adherence to wraparound principles and association with outcomes. Journal of Child and Family Studies, 14, 521-534.
2. Walker, S.E.C., Bruns, E.J., & Sather, A. (in submission). Wraparound fidelity in systems of care and association with outcomes.
3. Cox, K., et al. (in press). Wraparound Retrospective: Factors predicting positive outcomes. Journal of Emotional and Behavioral Disorders

18
Associations between fidelity and outcomes at the family level• Study 1: Small N (N=34) in one site;
associations found between WFI-2.1 scores and 6 months follow-up data on:• Residential restrictiveness• Satisfaction• Child behavior (only from facilitator report of
WFI)• Study 2: N=176, one provider organization
• Outcomes included goal attainment, CAFAS, and residential restrictiveness
• Results found positive but weak association between WFI total scores and outcomes
• Association found between several WFI principles (Community based, strengths based) and outcomes
• Presence of Natural supports on team predicted residential and goal attainment outcomes
19
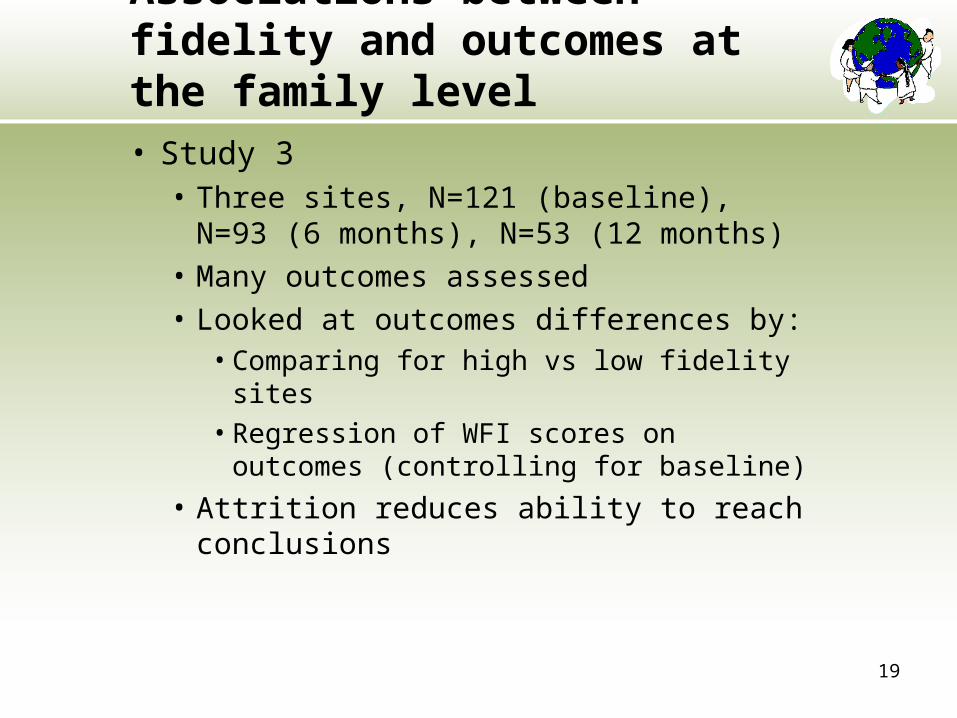
Associations between fidelity and outcomes at the family level• Study 3
• Three sites, N=121 (baseline), N=93 (6 months), N=53 (12 months)
• Many outcomes assessed• Looked at outcomes differences by:
• Comparing for high vs low fidelity sites
• Regression of WFI scores on outcomes (controlling for baseline)
• Attrition reduces ability to reach conclusions

20
Study 3 Findings: Outcomes differences between sites with high vs low WFI scores
• Significant between-group differences found for:• Total services received• Caregiver satisfaction• Restrictiveness of living environment• Placement changes• Family functioning
• All differences in hypothesized direction• No differences found for:
• Child functioning• Child behavior (CBCL or YSR)• Behavioral strengths• Caregiver strain• Family resources• Youth satisfaction

21
Results: Association between CG-reported wraparound fidelity and 6-month outcomes
Outcome variable B SE Beta t Sig.
Restrictiveness of Living -.294 .177 -.196 -1.658* 0.10
Placement changes -.005 .071 -.008 -.067 .947
CAFAS -0.78 3.32 -0.02 -0.23 0.82
CBCL -0.84 0.58 -0.12 -1.46 0.15
YSR -1.00 1.12 -0.09 -0.89 0.38
BERS 1.32 1.05 0.15 1.26 0.21
Family Functioning 0.05 0.04 0.13 1.24 0.22
Caregiver Strain -0.10 0.07 -0.14 -1.48 0.14
Family Resources 3.27 1.22 0.24 2.68** 0.01
Outcome variable r Sig.
MSSC Total .08
Caregiver Satisfaction .56** .000
Youth Satisfaction .03
**p<.01 *p<.1
Aft
er
con
tro
llin
g f
or
ba
selin
e s
core

22
Study 3 Findings: Relationship between fidelity and outcomes• Caregiver reported fidelity was
found to be related to several 6-month outcomes:• Restrictiveness of living (p<.1)• Family resources• Caregiver satisfaction
• CG-reported fidelity was associated in the hypothesized direction with all 6-months outcomes• Overall, however, few significant
relationships were found• Stronger findings at the site level
23
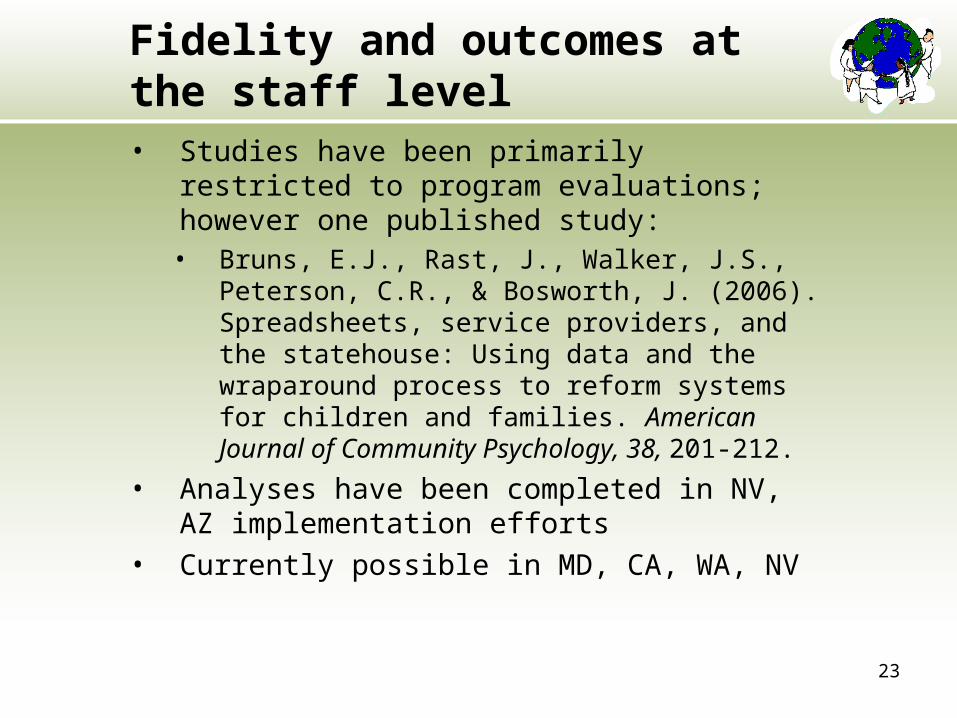
Fidelity and outcomes at the staff level• Studies have been primarily restricted to
program evaluations; however one published study:• Bruns, E.J., Rast, J., Walker, J.S., Peterson,
C.R., & Bosworth, J. (2006). Spreadsheets, service providers, and the statehouse: Using data and the wraparound process to reform systems for children and families. American Journal of Community Psychology, 38, 201-212.
• Analyses have been completed in NV, AZ implementation efforts
• Currently possible in MD, CA, WA, NV

24
0.0
1.0
2.0
3.0
4.0
5.0
Intake 6 Months 12 Months
Time Frame
Av
era
ge
Fa
mily
Re
so
urc
es
S
co
re
Low Fidelity Staff High Fidelity Staff
FRS measures a caregiver’s report on the adequacy of a variety of resources (time, money, energy, etc.) needed to meet the needs of the family as a whole, as well as the needs of individual family members. Group average on the scale of 1 – 5 1 = Not at all adequate5 = Almost always adequate
Low- vs. high-fidelity wraparound in AZ:Family resources

25
Low- vs. high-fidelity wraparound in AZ:
Child Behavior
30
40
50
60
70
80
90
100
Intake 6 Months 12 Months
Time Frame
Low Fidelity Staff High Fidelity Staff

26
Ongoing training and professional development support leads to higher fidelity
72%86%
64%
0%10%20%30%40%50%60%70%80%90%
100%
Pre Training Training Only Training andCoaching
Phase in Wraparound Fidelity Process
Ave
rag
e W
FI
Fid
elit
y S
core
Bruns, Rast, Walker, Peterson, & Bosworth (2006). American Journal of Community Psychology.
27
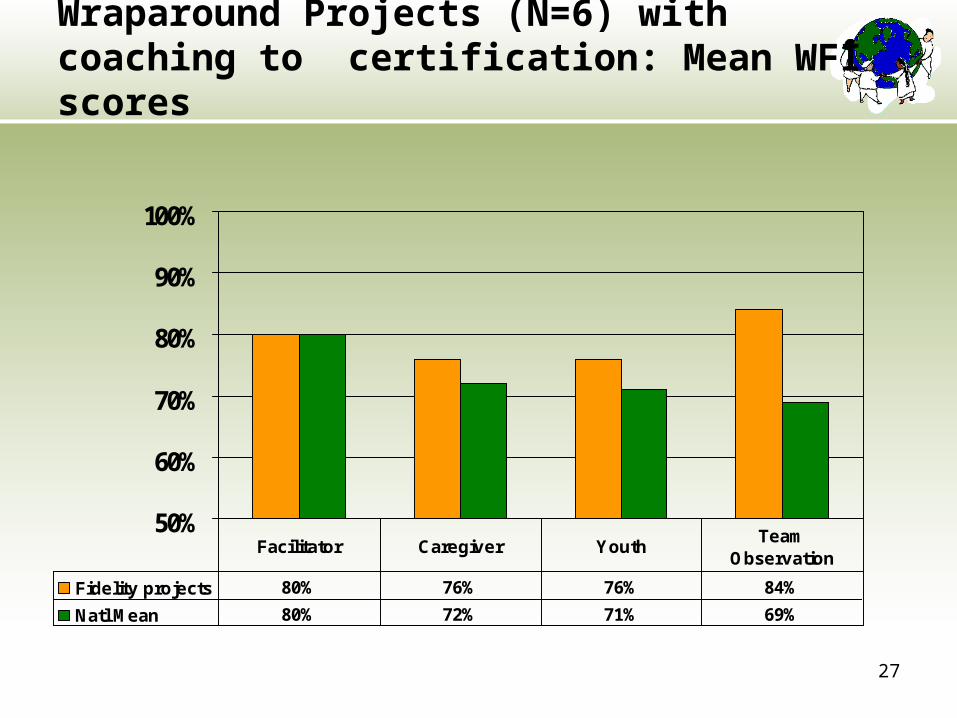
Wraparound Projects (N=6) with coaching to certification: Mean WFI scores
50%
60%
70%
80%
90%
100%
Fidelity projects 80% 76% 76% 84%
Natl Mean 80% 72% 71% 69%
Facilitator Caregiver YouthTeam
Observation

28
Organizational and system-level supports predict fidelity
Bruns, Suter, & Leverentz-Brady (2006). Relationship between Program and System Variables and Fidelity to the Wraparound Process for Children and Families. Psychiatric Services.

29
Number of system and program supports predicts wraparound fidelity (WFI-3)
Program Longevity Y Y Y Y YLow Caseload Size Y Y Y Y YLow Staff turnover Y Y YInteragency collab. Y Y Y Y YPooled funding Y YNatural supports Y Y Y Y Y YFamily centeredness Y Y Y Y YFund/Serv.Flexibility Y Y Y YOutcomes assessed Y Y Y YTOTAL WFI-PA 3 2 3 5 6 6 7 7
WFI-PA domains
WF
I T
otal
Fid
elity
72
76 77
8082
84 8486
65
70
75
80
85
90
Site 1 Site 2 Site 4 Site 3 Site 5 Site 7 Site 6 Site 8

30
WFI Scores at a State LevelBenchmarks and real-world reality
50
60
70
80
90
Pe
rce
nt
of
tota
l fi
de
lity
Non-wraparoundcomparisons
58
State No.1 68
State No.2 69
National Average 75
State No.3 81
State No.4 81
Total WFI scores

31
Getting to “high fidelity”The story of “state number 3”
• Statewide training and TA center• Consistent availability of family partners (+
youth advocates)• Certification program for facilitators/FPs• Referrals from and fiscal responsibility shared by
multiple agencies• Care management entity (CME) that maintains
MIS, develops service array, holds some risk for overall costs• Allows for flexible funding of team strategies
• 1915c Waiver• Professional development at SSW and in provider
agencies

32
Fidelity’s Impact on Outcomesat a state level?
0
20
40
60
80
100
120
140
Ave
rage
Fun
ctio
nal I
mpa
irmen
t on
the
CA
FAS
State 1 (WFI=68) 121 126
State 2 (WFI=69) 106 102 98
State 4 (WFI=81) 101 81 75
Intake 6 months 12 months
WFI=69
WFI=68
WFI=81

33
What is the evidence on connections between fidelity and outcomes?
1. Do youth/families with higher WFI scores show more positive outcomes? (Inconsistent)
2. Do individual provider staff whose families experience better outcomes have higher WFI scores? (Stronger)
3. Do wraparound sites/initiatives with higher WFI scores achieve better outcomes? (Emerging)
4. Is training and coaching associated with gains in fidelity and higher fidelity? (Growing)
5. Do communities with better developed supports for wraparound show higher WFI scores (Strong)
6. Can we say what “high fidelity” wraparound is yet?

34
Bootstrapping fidelity standards using the WFI (version 3)
60
7275
72
84
62
7276 76
86
64
72
80
87
50556065707580859095
100
Non-WA / pre-training
WA
WA withpoorer
support/outcomes
WA as usualfrom comp.
studies
Nationalsample (min,mean, max)
Well-supported/outcome-based WA
Ov
era
ll W
FI
sc
ore
Borderline
Non-wrap
Acceptable
High-fidelity
Bruns, E.J., Leverentz-Brady, K.M., & Suter, J.C. (2008). Is it wraparound yet? Setting fidelity standards for the Bruns, E.J., Leverentz-Brady, K.M., & Suter, J.C. (2008). Is it wraparound yet? Setting fidelity standards for the wraparound process. wraparound process. Journal of Behavioral Health Services and Research, 35, Journal of Behavioral Health Services and Research, 35, 240-252.240-252.

35
Bootstrapping fidelity standards using the WFI (adding recent results from WFI-4)
60
7275
68
84
62
72
76 75
86
64
72
83
87
58
68 69
83
50556065707580859095
100
Non-WA / pre-training
WA
WA withpoorer
support/outcomes
WA as usualfrom comp.
studies
Nationalsample (min,mean, max)
Well-supported/outcome-based WA
Ov
era
ll W
FI
sc
ore
Borderline
Non-wrap
Acceptable
High-fidelity

36
Sites with both WFI-4 andTeam Observation Measure (TOM) Scores
50%
60%
70%
80%
90%
100%
WFI Combined 84% 77% 79% 79% 69% 72% 72% 81%
Team Observation 93% 84% 83% 78% 67% 56% 63% 78%
Site 1 Site 3 Site 5 Site 6 Site 7 Site 8 Site 9 Site 10
Site 1 WFI n=19 / TOM n=4 Site 6 WFI n = 22 / TOM n=13
Site 3 WFI n=19 / TOM n=14 Site 7 WFI n = 3 / TOM n=3
Site 5 WFI n=17 / TOM n=10 Site 8 WFI n = 50 / TOM n=24
Site 9 WFI n=110 / TOM n=39 Site 10 WFI n = 207 / TOM n=16

37
WFI-TOM correlation (N=8 sites)
Descriptive Statistics
76.63 5.153 8
75.25 12.279 8
WFI_COM
TOM
Mean Std. Deviation N
Correlations
1 .857**
.007
8 8
.857** 1
.007
8 8
Pearson Correlation
Sig. (2-tailed)
N
Pearson Correlation
Sig. (2-tailed)
N
WFI_COM
TOM
WFI_COM TOM
Correlation is significant at the 0.01 level (2-tailed).**.
Correlations
1 .849*
.033
6 6
.849* 1
.033
6 6
Pearson Correlation
Sig. (2-tailed)
N
Pearson Correlation
Sig. (2-tailed)
N
WFI_COM
TOM
WFI_COM TOM
Correlation is significant at the 0.05 level (2-tailed).*.
Excluding 2 sites with small ns:

38
Findings
• Fidelity-outcomes associations are tenuous and inconsistent at the family/youth level
• At the site/program level, there is a discernable pattern of WFI Fidelity scores across studies• Wraparound vs. non-wraparound programs• Wraparound programs with different levels of
system support and that achieve different degrees of impact
• Site-level scores from the national WFI dataset show significant variability, but fall logically within the pattern
• Beginning to be able to interpret the “level of fidelity” WFI scores
• Team Observations correlate with WFI scores and may be even more sensitive to quality

39
Conclusions/Implications• Factors at the youth/family level
make WFI scores difficult to interpret reliably at that level• This is the nature of interviews
• WFI scores may be most reliable, valid, and useful at a staff and program level
• WFI scores should be helpful in interpreting research results
• The TOM is emerging as a reliable and valid instrument

40
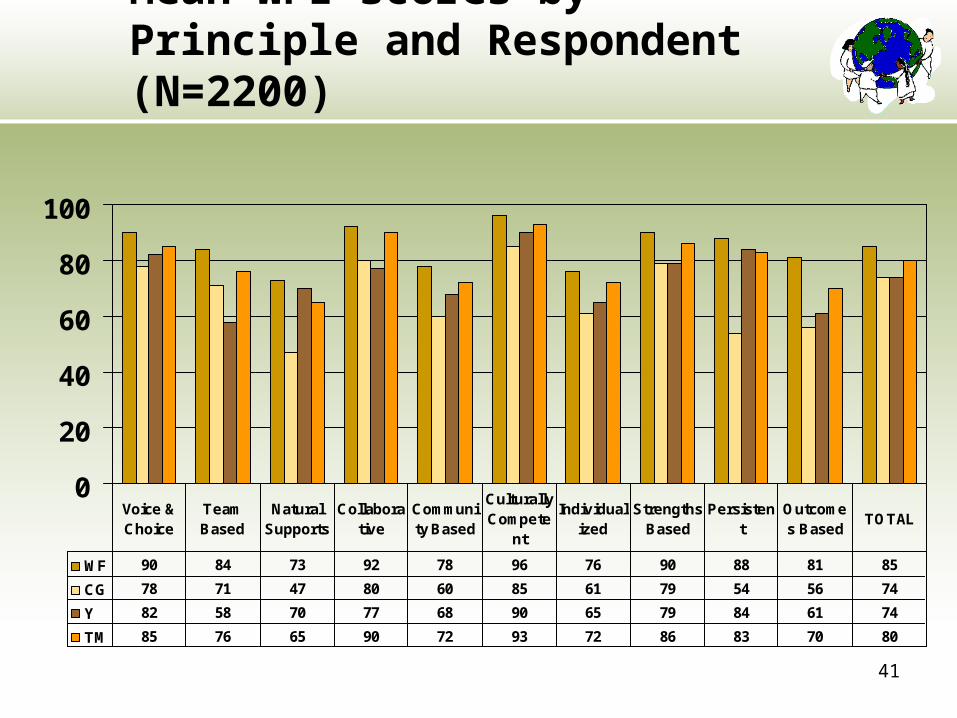
Mean WFI scores by Principle and Respondent (N=2200)
Principle WF
CG Y TM
1 Voice & Choice 90 78 82 85
2 Team Based 84 71 58 76
3 Natural Supports 73 47 70 65
4 Collaborative 92 80 77 90
5 Community Based 78 60 68 72
6 Culturally Competent
96 85 90 93
7 Individualized 76 61 65 72
8 Strengths Based 90 79 79 86
9 Persistent 88 54 84 83
10 Outcomes Based 81 56 61 70
TOTAL 85 74 74 80
41
Mean WFI scores by Principle and Respondent (N=2200)
0
20
40
60
80
100
WF 90 84 73 92 78 96 76 90 88 81 85
CG 78 71 47 80 60 85 61 79 54 56 74
Y 82 58 70 77 68 90 65 79 84 61 74
TM 85 76 65 90 72 93 72 86 83 70 80
Voice & Choice
Team Based
Natural Supports
Collaborative
Community Based
Culturally Compete
nt
Individualized
Strengths Based
Persistent
Outcomes Based
TOTAL

42
WFI Items with 5 Highest Scores(From National WFI-4 dataset)
Item Item means (CG form; range = 0-2)
3.11 Does your team create a positive atmosphere around successes and accomplishments at each team meeting?
1.79
2.4 Are there supports and services in your plan connected to the strengths and abilities of your child and family?
1.73
1.3 At the beginning of the wraparound process, did you have a chance to tell the WF what things have worked for you in the past?
1.68
3.15 Does your child have the opportunity to communicate their own ideas when it comes to decisions?
1.63
3.12 Does your team go out of its way to make sure all members present ideas and participate in decisions?
1.62
2.11During the planning process, did the team make enough time to understand your values, and is the plan in tune with those values?
1.62

43
WFI Items with Lowest Scores(From National WFI-4 dataset)
Item Item means (CG form; range = 0-2)
2.3 Does your plan include mostly professional services? .63
3.6 Is there a friend or advocate of your child or family who actively participates on the team?
.78
4.1 Has your team discussed a plan for how wraparound will end, and when?
.79
3.3 Does your team get your child involved with activities they like and do well?
.80
3.8 Are the services and supports in your plan difficult for you to access? .82
3.9 Does the team assign specific tasks to all members at the end of the meeting, and does the team review follow-through at the next meeting?
.83
3.7 Does your team come up with new ideas when something isn’t working?
.92
3.4 Does the team find ways to increase the support you get from friends & family?
.94