10-29-2013 snamp annual meeting...
TRANSCRIPT

1
Sierra Nevada Adaptive Management Project Annual Meeting Notes
October 29th, 2013; 10am to 3:30 pm Wildland Fire Training Center, 3237 Peacekeeper Way, McClellan, CA, 95652
In attendance: Michael Anderson – CA Dept. Water Res. John Battles – Univ. of California, Berkeley Roger Bales – Univ. of California Merced Vince Berigan – University of Wisconsin Tray Biasiolli – US Forest Service, PSW Steve Brink – California Forestry Association Sue Britting – Sierra Forest Legacy John Buckley – CSERC Esther Burkett – CA Dept. Fish & Wildlife Pete Cafferata – CalFire Mike Chapel – USFS (retired) Doug Cushman – Lahontan RWB Marie Davis – Placer County Water Agency Bob Dean – Calaveras County Water District Stefania Di Tommaso – Univ. of Cal., Berkeley Lorna Dobrovolony - CA Dept. Fish & Wildlife Tom Efird – USFS (retired) Don Errington – USFS, Eldorado NF Gary Estes – Cal. Extreme Precipitation Symp. Rebecca Ferkovich – CalFire Pat Ferrell – USFS, Eldorado NF Jacob Flanagan – Univ. of California, Merced Patricia Flebbe – USFS, Region 5 Pamela Flick – Defenders of Wildlife Danny Fry – Univ, of California, Berkeley Amy Golden – CalTrans Qinghua Guo – Univ. of California, Merced James Henke – CalTrans Russ Henly – CA Resources Agency Arthur Hinojosa – CA Dept. Water Resources Peter Hopkinson – Univ. of Cal., Berkeley Lynn Huntsinger – Univ. of Cal., Berkeley
Kim Ingram – Univ. of Cal. Coop. Extension Lowell Jarvis – Mountain Counties Water Jeremiah Karuzas – US Fish & Wildlife Service Chris Keithley – CalFire Maggi Kelly – Univ. of California, Berkeley Susie Kocher – Univ. of Cal. Coop. Extension Patti Krueger – USFS, Region 5 Shufei Lei – Univ. of California, Berkeley Dawn Lipton - USFS Anne Lombardo – Univ. of Cal. Coop. Ext. Lynn Lorenson – Nevada County RCD Vic Lyon – USFS, Tahoe National Forest Diane Macfarlane – USFS, PSW Research Pat Manley – USFS, PSW Research Dave Martin – USFS, Sierra National Forest Tiffany Meyer - CalFire Frank Mosbacher – USFS, El Dorado NF Chris Nota – USFS, Region 5 Larry Peabody – USFS, Tahoe National Forest Zach Perry – University of Wisconsin Sophie Preckler-Quisquater – Univ. of Cal., Berkeley Carlos Ramirez – USFS, Region 5 Temoc Rios – USFS, Tahoe National Forest Kevin Roberts – Sierra Pacific Industries Kim Rodrigues – Univ. of Cal. Coop. Extension Vance Russell – National Forest Foundation Phil Saksa – Univ. of California, Merced Sarah Sawyer - USFS Y. Su – Univ. of California, Merced Adriana Sulak – Univ. of California, Berkeley Dan Teater – USFS

2
Craig Thomas – Sierra Forest Legacy Craig Thompson – USFS PSW Research Tony Valdes – USFS Dana Walsh – USFS, Eldorado NF
Angela White – USFS PSW Research Deb Whitman – USFS Region 5 Sheila Whitmore – University of Wisconsin
I. Welcome and Overview:
Dr. Kim Rodrigues, from the Public Participation Team, welcomed everyone, reviewed the ground rules for the meeting as well as desired outcomes. The desired outcomes were: to promote shared understanding of the current status of the SNAMP project, present the plan for integration, final report, and IT meetings to stakeholders, and encourage public interaction and involvement with the project and facilitate discussion of next steps for SNAMP. All power point presentations from the meeting are posted on the SNAMP website at http://snamp.cnr.berkeley.edu/events/.
Dr. John Battles briefly reviewed SNAMP and the University of California Science Team’s (UCST) third party role within the Forest Service’s adaptive management study of the effects of SPLATS (strategically placed landscape area treatments). SPLATs are forest treatments that cover about 30% of a landscape and they are designed to have about a 30-year life span. It is hoped that SPLATs will reduce the rate of fire spread and intensity, and will decrease tree density to improve forest health. SNAMP’s goal is to provide relevant research at the fireshed scale that can be used to adapt management in the future. The project will have lasted 8 years and cost over $15 million by the end of 2014. Top funders are the US Forest Service and the state of California through resources agencies and the University of California.
The project is on schedule for completion by December 31st 2014 when the final report will be completed. The public participation team will continue on until April 2015 (See figure 2). John also said he wanted to especially thank the National Forest Districts that have hosted the research teams throughout these years. The District Rangers and staff have put in tremendous efforts to help scientists with information, coordination, housing and assistance.
Figure 1. SNAMP funding by funder over the life of the project.

3
Figure 2. Timeline for SNAMP project.
II. Implementation updates from the Forest Service: Last Chance Project – Victor Lyon, District Ranger on the American River District, and Larry Peabody, Fuels Management Officer, gave a quick update on Last Chance project and how it was affected by the American Fire. Half of the Last Chance Project was burned in the American Fire, most with low intensity. Commercial harvest was completed this summer 2013. Post-harvest surface fuel treatment (pile burning, 300 acres) was completed in January 2013. Active fuel treatment (pile burning and biomass utilization) is ongoing. A few landing piles remain. Some piles slated for biomass utilization were “lost” in the American Fire. The remaining landing piles will be conditionally burned, or utilized for biomass. Approximately 475 of 575 acres of prescribed burning are completed. The remaining portion is “on hold” pending a more detailed evaluation of the American Fire. Effects of the American Fire on treated areas will undoubtedly influence future fuels management decisions for the remainder of the project area. The American Fire started on August 10, 2013 and burned 27,440 acres. The fire was declared controlled on October 8. The fire will not be declared out until significant precipitation occurs over the area. Entry into the burned area is currently restricted. The initial Burn Area Emergency Rehabilitation (BAER) assessment identified overall soil burn severity as 38% low severity, 43% moderate severity and 14% high severity. Roughly half (1100 of 2380 acres) of the Last Chance Project, including completed thinning and prescribed burning units, were burned in the American Fire. Some of this area was intentionally backfired, some of it burned in the wildfire. The vast majority of the treated area burned with low intensity. The decision to backfire through the middle of the Last Chance Project was a

4
direct result of the project’s location and post treatment fuel profile. The final determination of how the vegetation survived the fire will probably not be known for another year since significant mortality can happen much later. Question: What is the definition of low, medium, severe? Answer: This is different for vegetation and soil severity. The soil severity is determined using solar reflectance. Solar reflectance map resolution was 30meters. Other maps used half meter resolution so the maps provided are showing different things. Vegetation severity is totally different and doesn’t necessarily correlate with soil severity. Both soil and vegetation severity measures are important for different resources and it’s useful to collect both. Question: How did the cable logged area burn? It seemed to have different fuels from the lop and scatter treatment. Answer: Larry said that the cable thinning area was moderately burned by both the wildfire and the backfire, even with all the lop and scatter debris still on the ground. The trees appear to have survived so far but a final determination would need to wait until next summer.
Sugar Pine Project Update – Dave Martin, District Ranger from the Bass Lake Ranger District gave a report on the Sugar Pine project. Though fires burned all around the district, they did not actually host a fire this summer. Part of the Sugar Pine project area is still being logged. Some areas were excluded due to a goshawk PAC, streamside protection areas, lack of access due to slopes and cultural sites. In other areas, there were problems with chip vans fitting on old railway grades. Off Highway 41, there are 3 units that still need to be treated. There were chip van access problems so they had to pile biomass and will burn large piles. The biomass that was removed was being sent to a plant in the Central Valley near Madera. Julie Roberts will post updated treated maps to website when ready. John Battles clarified that SNAMP considers the post-treatment period to have begun Nov. 2012.
Question: What percentage of the project was completed? When will you burn? Did the rain this week stop logging? Answer: Dave said about 90% of the project is done. Logging continues despite the rain. Burning will probably occur this winter when there is 6-8 inches of snow before burning. There
Figure 3. Sugar Pine project implementation update map

5
is a lot of backlog for burning on the district. When burning is allowed, all agencies want to burn. III. UC Science Team Integration Plan and metrics, timeline, final report, and IT meetings Dr. Peter Hopkinson reviewed the integration plan for SNAMP. Each team is doing their individual research and reporting it. On top of that they have developed integration metrics to be used to compare the immediate and long-term effects of SPLATS on resources within the same framework (see figure 4).
Figure 4. Integration framework for SNAMP
Spatial • Vegetation polygon map
Fire • Landscape forest structure
maps for fire behavior modeling
Water - Quality • Sediment
Water - Quantity • Water yield • Discharge timing • Subsurface storage
Forest Ecosystem Health Tree growth Tree mortality Fisher (proposed)
• Reproductive habitat quality
• Occupancy • Probability of use
Owl - Demographic • Reproduction • Survival • Occupancy
Owl – Habitat • Area of forest stands in
different CWHR vegetation classes
• Area of forest stands containing large trees
• Area of forest stands having adequate canopy cover
Public Participation • Divergence or
convergence over time of
people’s interests and ideas about forest health, SPLATs, fire
• Perceptions of fuel treatment impacts, ground fire, and severe/crown fire on studied resources; relations with major narratives of people’s views of forests/forest health
• Frequency of topics over time in meeting notes, narratives from comments; web hits, attendance, networking by topic
6
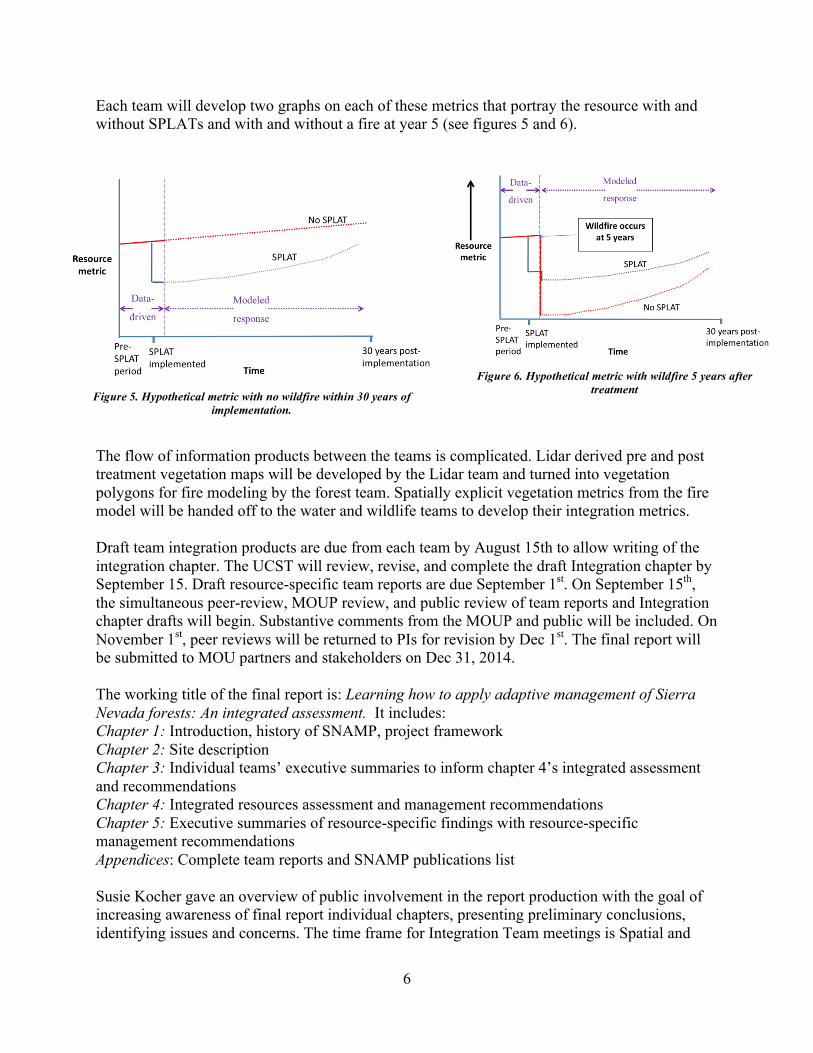
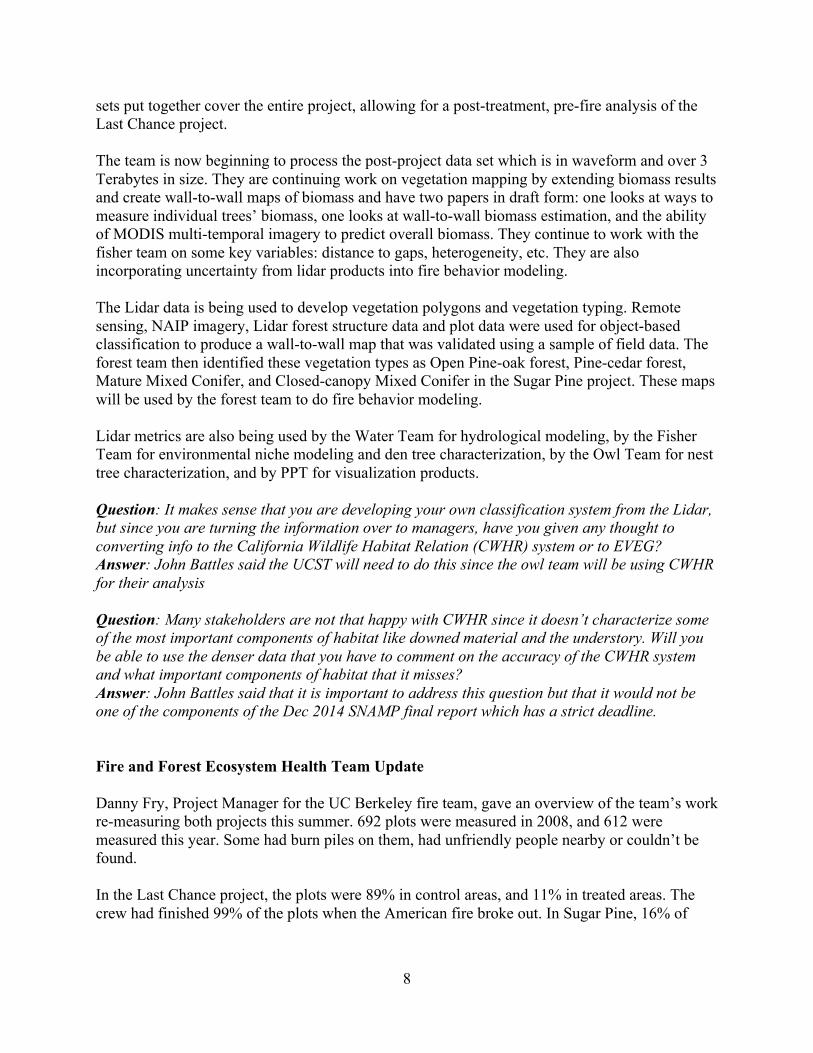
Each team will develop two graphs on each of these metrics that portray the resource with and without SPLATs and with and without a fire at year 5 (see figures 5 and 6).
The flow of information products between the teams is complicated. Lidar derived pre and post treatment vegetation maps will be developed by the Lidar team and turned into vegetation polygons for fire modeling by the forest team. Spatially explicit vegetation metrics from the fire model will be handed off to the water and wildlife teams to develop their integration metrics. Draft team integration products are due from each team by August 15th to allow writing of the integration chapter. The UCST will review, revise, and complete the draft Integration chapter by September 15. Draft resource-specific team reports are due September 1st. On September 15th, the simultaneous peer-review, MOUP review, and public review of team reports and Integration chapter drafts will begin. Substantive comments from the MOUP and public will be included. On November 1st, peer reviews will be returned to PIs for revision by Dec 1st. The final report will be submitted to MOU partners and stakeholders on Dec 31, 2014. The working title of the final report is: Learning how to apply adaptive management of Sierra Nevada forests: An integrated assessment. It includes: Chapter 1: Introduction, history of SNAMP, project framework Chapter 2: Site description Chapter 3: Individual teams’ executive summaries to inform chapter 4’s integrated assessment and recommendations Chapter 4: Integrated resources assessment and management recommendations Chapter 5: Executive summaries of resource-specific findings with resource-specific management recommendations Appendices: Complete team reports and SNAMP publications list Susie Kocher gave an overview of public involvement in the report production with the goal of increasing awareness of final report individual chapters, presenting preliminary conclusions, identifying issues and concerns. The time frame for Integration Team meetings is Spatial and
Figure 5. Hypothetical metric with no wildfire within 30 years of implementation.
Figure 6. Hypothetical metric with wildfire 5 years after treatment

7
Forest/Fire in April/May, Owl in June, Fisher in July, and Water in August 2014. Public airing of the integration chapter will be done at the final SNAMP annual meeting in October 2014. Question: Will the report include confidence intervals on resource values established? Answer: Yes, of some sort. These may be more like sensitivity analyses. Question: Will you have thresholds determined for the graphs that describe whether the value is good or bad or neutral? Answer: Yes, we are definitely thinking about the thresholds and will have them on the graphs, though we are not quite sure yet how we will go about it. Question: Will the teams recommend any additional monitoring? Answer: Some of the PIs probably will, this is usually part of a future work section in the management recommendations. We should probably have PIs talk about incorporating that. III. UC Science Team Updates Next, individual science team leads gave an overview of the science findings for the previous year, their integration metrics and plans for the final year.
Figure 7. The structure of the University of California Science Team
Spatial Team Update Dr. Maggi Kelly described recent activities of the Spatial Team. All of Sugar Pine was captured with Lidar in 2012, but the Last Chance flight was stopped by snow. That area was reflown in 2013 but then that flight was stopped by the American fire. The good news is that the two data
8
sets put together cover the entire project, allowing for a post-treatment, pre-fire analysis of the Last Chance project. The team is now beginning to process the post-project data set which is in waveform and over 3 Terabytes in size. They are continuing work on vegetation mapping by extending biomass results and create wall-to-wall maps of biomass and have two papers in draft form: one looks at ways to measure individual trees’ biomass, one looks at wall-to-wall biomass estimation, and the ability of MODIS multi-temporal imagery to predict overall biomass. They continue to work with the fisher team on some key variables: distance to gaps, heterogeneity, etc. They are also incorporating uncertainty from lidar products into fire behavior modeling. The Lidar data is being used to develop vegetation polygons and vegetation typing. Remote sensing, NAIP imagery, Lidar forest structure data and plot data were used for object-based classification to produce a wall-to-wall map that was validated using a sample of field data. The forest team then identified these vegetation types as Open Pine-oak forest, Pine-cedar forest, Mature Mixed Conifer, and Closed-canopy Mixed Conifer in the Sugar Pine project. These maps will be used by the forest team to do fire behavior modeling. Lidar metrics are also being used by the Water Team for hydrological modeling, by the Fisher Team for environmental niche modeling and den tree characterization, by the Owl Team for nest tree characterization, and by PPT for visualization products. Question: It makes sense that you are developing your own classification system from the Lidar, but since you are turning the information over to managers, have you given any thought to converting info to the California Wildlife Habitat Relation (CWHR) system or to EVEG? Answer: John Battles said the UCST will need to do this since the owl team will be using CWHR for their analysis Question: Many stakeholders are not that happy with CWHR since it doesn’t characterize some of the most important components of habitat like downed material and the understory. Will you be able to use the denser data that you have to comment on the accuracy of the CWHR system and what important components of habitat that it misses? Answer: John Battles said that it is important to address this question but that it would not be one of the components of the Dec 2014 SNAMP final report which has a strict deadline. Fire and Forest Ecosystem Health Team Update Danny Fry, Project Manager for the UC Berkeley fire team, gave an overview of the team’s work re-measuring both projects this summer. 692 plots were measured in 2008, and 612 were measured this year. Some had burn piles on them, had unfriendly people nearby or couldn’t be found. In the Last Chance project, the plots were 89% in control areas, and 11% in treated areas. The crew had finished 99% of the plots when the American fire broke out. In Sugar Pine, 16% of
9
plots were treated and 84% were considered control. They adjusted surface fuels for the masticated plots and added ground cover measurements for the water team. The team’s priorities for 2013-14 are to summarize the post-treatment plot inventory data and supply plot it to the Spatial Team for calibration of landscape vegetation maps. They will also do fire behavior modeling using Lidar, determine post-treatment Burn Probabilities and compare with pre-treatment values. This will also grow the plot areas using Forest Vegetation Simulator (FVS) to provide a baseline for the post-treatment modeling of other teams. Question: Why are you using both NAIP and Lidar imagery, in addition to plot data? Answer: The UCST is working to build a system for others in the future. There are currently six classification systems in use and a more consistent method in the future would be beneficial. Question: There are challenges to the time scale of research on fuel treatments. The UCST needed them completed in 2 years while managers are used to the planning and implementation process taking up to 6 years. How will the timing of the SPLATs affect modeling? Answer: We will model the treatments as completed by the summer of 2012. Question: Will you be clear about the effects of the backfiring in the Last Chance fire area as opposed that were actually affected by wildfire? Answer: John Battles said that the team would need to work with the district to provide the details of the suppression effort as effects may be more like a prescribed fire in areas as a result and should be considered in the evaluation. However, this is work for the future as the effects of the American fire are beyond the scope of SNAMP. Water Team Update Dr. Roger Bales gave an overview of the water team activities, methods and results thru 2013. The team’s products will be water quality/sediment, catchment water balance in headwaters and firesheds, scenario modeling and soil-moisture response. The weather patterns in the last four years have included two fairly wet/normal years (2010 and 2011) and two dry years (2012 and 2013). For a normal water year, turbidity data shows the headwater streams appear to go through fine sediment accumulation and depletion cycles. The sediment accumulates during summer low flow and is depleted throughout the fall rain events. A similar pattern occurs with the mid-winter low flows and high flows associated with snow melt. Data from the scour pans supports the episodic movement of the larger bedload material during large sediment events with cycles of immediate disturbance (event) and slow recovery (background flow). Roger is working towards being able to show the change in stream flow due to decreased vegetation. He estimates at Frazier, a 10% increase in streamflow with a 50% reduction in biomass. The gain in runoff w/ different levels of vegetation management, is a critical research question. The Team is still working on calibrating the model as the assumptions within it were not correct. Instead of showing decreased thermal heat from trees when trees are removed, the model keeps

10
the thermal heat constant. Phil Saksa should have the model performing within acceptable limits within the next two months. To calibrate the six fireshed watersheds, they are using a variety of annual hydrologic characteristics, e.g. flow duration curve, center of mass, runoff ratio and using satellite snowcover-depletion curves to constrain the model. They will be able to estimate discharge using regional, headwater, and downstream locations to develop relationships between basin characteristics and discharge. They are using MODIS satellite snow covered area data to identify snow melt. They are in progress at modeling the four scenarios: SPLATs, no SPLATs, unburned, burned. The variables that change in the hydrologic model are Leaf Area Index (LAI) and canopy cover. Their priorities for the year are to process and analyze post-treatment sediment and water balance data; develop a full energy balance for modeling snowpack; upscale headwater modeling to firesheds and finish, manuscripts and dissertations. Question: Have you been able to instrument any part of the Rim Fire? Answer: Roger said he has been in contact with PSW and with Sierra Pacific Industries to talk about instrumentation on their land that was burned. Question: Will you be connecting soil moisture with weather conditions? Won’t the increased wind with thinning dry out the soil? Answer: Yes, it will be part of the energy balance model. Evaporation from soil is only 10% of evaporation. Most of the water is leaving the soil through stream flow or being taken up by trees. Question: Water yield is a dynamic thing - biomass will grow back. Will you track the loss of that increased water yield over time? Answer: Roger said one of the ways to maintain the water yield gained was to control the understory LAI. Keeping a litter layer on the forest floor reduces evaporation as well. Question: Who takes responsibility to continue taking measurements after SNAMP is done? Answer: The UCST and DWR are looking for partnerships to keep the work going. There is interest in the SNAMP modeling effort to scale up to the fireshed scale to learn more about how landscape changes affect the water cycle Question: Do we know the different evapotranspiration rates of different veg. types? Answer: No. LAI is the main attribute of focus as of now. This is a question the scientific world needs to focus on in the future. There are differences in overstory versus understory evapotranspiration rates. There is some evidence that shrubs use the top layer of soil moisture while trees use the bottom layer. This leads to more resilience to soil moisture deficits than might be expected. Relative humidity is the main controller of evapotranspiration. There is new instrumentation – a distributed sensor network to include snow, temperature and relative humidity being put into the Sierra. Also, meteorological stations in clearings may get different results than if they were in denser forest.

11
Public Participation Team Update Dr. Lynn Huntsinger said that PPT has a lot of data to work with including project notes, attendance, interviews and on-line surveys to produce information on the divergence or convergence of people’s interests and ideas about forest health, SPLATs, fire, adaptive management, and the UC role. They will talk about the change in comprehension/mutual learning, the impact of third party participation, and change in ideas about adaptive management. Susie Kocher described the activities of the outreach team. They continued to facilitate annual and MOUP meetings, gave 12 outreach presentations to 210 people most of whom are not involved in SNAMP in other ways, helped with a SNAMP museum exhibit at UC Merced in July, led two field trips, wrote blogs and newsletters. Instead of Integration Team meetings this year, the PPT hosted Collaborative Adaptive Management (CAM) Workshops. The goal was to improve communication and facilitation skills between natural resource managers and stakeholders, and to increase the effectiveness and efficiency of the collaboration process. The team developed training modules to facilitate community CAM efforts in the future. Ten workshops were held for managers and stakeholders in Auburn, Oakhurst and Jackson. Workshops included about 12 hours of instruction on definition and purpose of CAM, facilitation objectives, understanding constraints, distinguishing content versus process issues, listening as an ally, understanding the stages of discussion, decision making, logistics, learning styles and group dynamics, dealing with difficult behaviors and reducing conflict. Participants include staff from federal agencies, state agencies, universities, local government/Districts, local organizations and non-profits. An on-line collaborative tools website was developed to host the curriculum and allow online discussion for mutual support. Participants report that the workshops are timely and relevant to issues they are currently dealing with.
Maggi Kelly explained that the web team has a new paper out on how websites can help to facilitate participation and adaptive management. Shufei Lei is working on his dissertation Networks of Information, People, and Space in Adaptive Management: the Sierra Nevada Adaptive Management Project. It will include chapters on information tracking and adaptive management: the production, use, and impact of mutual learning; social networks of people and places, and insights into adaptive
management in terms of geography, social cohesion, and resilience. He is developing Self-Organizing Maps to analyze meeting notes. Social network analysis has shown a clear North/South split, and core and peripheral participants. The centralization (%) of the network and average attendance increased from 2005-2010, but fell after that. This suggests that overall the project has been successful in building up the network until 2010 (funding issues?). Core
Figure 8. Social networks in SNAMP

12
participants from both the MOUP and the Public group stayed on despite the fluctuation of the cohesiveness at the network level. Priorities for 2014 include hosting Integration Team meetings with all teams using post treatment data, working with agencies who may want to offer manager feedback on report format, field trips to Last Chance post American fire, and additional CAM workshops if feasible. The website will continue but transition to archive mode in spring 2015. They will do a retrospective of what worked and what didn’t as part of the final report. Final interviews need to be finished in time for the report draft due in August. California Spotted Owl Team Update - Dr. Zach Peery of the University of Wisconsin gave an overview of the work of the Owl Team. The study design was modified first because there were insufficient treatment territories in Last Chance. This led to the expansion of the study site to Eldorado Study Area. With the delays in treatments, statistical analysis showed that there would be low power to answer the SPLAT effect question. The approach now is a retrospective analysis using information from 1993 to 2012 using 74 owl territories. The Team has completed the vegetation maps using aerial photographs from that time period. They classified vegetation into 9 classes based on the California Wildlife Habitat Relationships system. Treatments were categorized as Heavy (including clear cut, overstory removal, seed tree removal, seed tree cut, shelterwood removal/commercial thin, shelterwood seed step), Medium (with and without understory removal) commercial thin, selection, single-tree selection, group selection, thinning for hazardous fuels removal, fuel break, SPLATS, and Light including pre-commercial thin, and sanitation salvage.
Dependent variables are reproductive output, survival, and occupancy (extinction and colonization). They developed a priori models using stages [Stage 1: owl habitat variables Stage 2: secondary habitat variables, and Stage 3: timber harvest, fire] and calculated them using 3-, 6-, and 9-year “moving windows”. They have completed the habitat-demography and sensitivity analyses and written up methods, results, and conclusions for submission to Ecological Applications by November 1. Results will be shared with partners and stakeholders if/when the paper is in press.
They are currently working on fire-owl habitat/demography modeling using an
approach developed by Ager et al 2007. Owl habitat metrics include area of suitable owl nesting habitat with threshold levels of “large” trees and “high” canopy cover, number of PACs and total area within PACs affected by fire. Owl demography metrics are reproduction, survival,
Figure 9. Occupied Owl Territories 2007-2011

13
extinction, and colonization rates. They are integrating closely with the forest team to develop the modeling and are currently conducting a “dry run” to refine their conceptual model and work flow as needed. Question: Regarding the Ager model – how will you determine owl fitness and owl habitat threshold? The Chips fire information can help inform threshholds. Answer: We will look at nesting and foraging habitat data including the area of habitat above or below a threshold. Fitness relates to reproductive success. Question: What are the owl habitat secondary variables? Are those understory conditions? Answer: No, the variables are not understory conditions, since the understory is not categorized by CWHR and could not be read off of aerial photos. The secondary variables refer to the spatial configuration of habitat. “Medium” treatments were broken into habitat with and without an understory but not enough sites had an understory to allow comparison.
Pacific Fisher Team Update Dr. Craig Thompson gave an update on research findings in 2013. The basic goals of the research are to assess responses of fishers to fuel treatments, develop integration metrics, estimate population parameters, identify limiting factors, and describe habitat use, occupancy, and population viability. The research is done through capture and radio telemetry, monitoring survival and reproduction and remote camera surveys. The sixth year of camera surveys was completed at the end of August. 27 new dens trees were identified, 26% were reused. There have been 61 mortalities recovered to date. For the first time, a male dispersed from the KREW research area and was found at a SNAMP site, this was more than 37 kilometers. A female was found to disperse over 22 kilometers. 130 grids were monitored, 69 had detections (53%) which was the lowest of any of the study years. 80% of females reproduced averaging 1.25 kits each. Male survival was .72 and female survival was .81. Priorities for 2014 are to complete the SNAMP report and habitat models, transition into the USFS PSW Sugar Pine project, expand research into rodenticide and pesticide impacts, and expand the research into carnivore community response to fuel treatments. Proposed SNAMP integration metrics are occupancy based on annual camera surveys in the core watershed area (using SNAMP data only) and intensity of use based on telemetry locations (aerial and ground) and combined SNAMP and Kings River data. These can be compared to vegetation structure data. Reproductive habitat quality will be developed based on a variety of datasets using combined SNAMP and Kings River data and in collaboration with Conservation Biology Institute. Integration metric models should be completed by April 2014. The Kings River Fisher Project will be extended for another 5 years.

14
Figure 10. SNAMP/Sugar Pine Fisher research timeline
Question: You are exploring use of GNNN fire data, why? Answer: The area included in the analysis is larger than the SNAMP Lidar data coverage. GNNN appears to be the best data set found so far that covers both areas, SNAMP and the Kings River.
V. Wrap Up and Next Steps: Kim Rodrigues wrapped up the meeting by summarizing that there will be Integration Team meetings with each team in spring 2014 to share progress on the final report. She asked the group what went well with the meeting. Participants said they appreciated the focused presentations that were short and on target, the small number of break out sessions, so fewer choices had to be made. Also notable were the cookies and the post fire analysis. To improve future meetings they suggested that the small group lunch session have facilitation and the meeting have a better microphone system. A total of 44 participants also filled out evaluation forms about the meeting. 98% agreed that information on the final year of SNAMP was useful, 95% agreed that constructive discussion was encouraged by facilitators, and 91% agreed they learned something new. 80% agreed that there is a clear plan of action for the future, but only 56% agreed that the dialogue breakout sessions were a practical way to address questions and concerns to various teams. Participants were also asked to answer the question - What is the most interesting or useful thing that you learned today? They mentioned learning more about the integration plan and all the various teams’work, the treatment and American Fire updates, the details of the wildlife research, how owl data will be integrated and how the fisher research will continue. Others mentioned the updates by the water and PPT teams. Suggestions were to include: • More concrete discussions about integration. • A bit more 'down' time - a break every 90 minutes to interact with other participants. • Break outs with in the time frame may not be as effective as large group discussions. • Would appreciate printed agendas and nametags that stay on.

15
PPT also asked for input on having webinars as public involvement events. Comments included: • Webinars are useful but tend to be less productive and hard to follow. In person meetings
are preferred with web access if travel is not feasible. • Recorded webinars are very useful when I do not have the time to attend a meeting in
person. • Webinars are great but not for a key meeting like today. Need the 'relationship/network'
part. • Webinars won't work so well for discussion. • Webinars work well for most purposes. • In face meetings would be better for this final year.

16