10 july 2018 the walt disney company - credit suisse
TRANSCRIPT

DISCLOSURE APPENDIX AT THE BACK OF THIS REPORT CONTAINS IMPORTANT DISCLOSURES, ANALYST CERTIFICATIONS, LEGAL ENTITY DISCLOSURE AND THE STATUS OF NON-US ANALYSTS. US Disclosure: Credit Suisse does and seeks to do business with companies covered in its research reports. As a result, investors should be aware that the Firm may have a conflict of interest that could affect the objectivity of this report. Investors should consider this report as only a single factor in making their investment decision.
10 July 2018Americas/United States
Equity ResearchEntertainment
The Walt Disney Company (DIS)
INITIATION Rating NEUTRALPrice (06-Jul-18, US$) 104.78Target price (US$) 114.0052-week price range (US$) 112.47 - 96.93Market cap(US$ m) 155,782Enterprise value (US$ m) 176,606Target price is for 12 months.
Research AnalystsDouglas Mitchelson
212 325 [email protected]
Meghan Durkin212 325-7742
Brian Russo212 325 7539
Grant Joslin212 325 2789
Investing in the Future (but How Much?)■ Initiating with a Neutral rating and $114 target price, 9% upside potential
■ Our Thesis: Disney is the best positioned traditional media company with its leading brands, global presence, scale, upcoming ESPN affiliate renewal cycle, and terrific Theme Park growth prospects. Still, we believe the Street has not fully accommodated the costs of Disney’s aggressive push into direct-to-consumer streaming services (DTC) – we are ~$0.50 (6%) below the Street’s FY19 EPS estimate. Note: FY19 is also challenged by tough film comps and major park project launches, while major ESPN affiliate renewals do not begin until late FY19. Further, major M&A, like Fox, tend to be disruptive for the buyers, including limiting Disney’s capital flexibility. Valuation is not compelling enough to embrace any DTC optimism this early.
■ Key Debates: Fox acquisition impact and strategy (if Disney wins it); the costs and subscriber prospects for its ESPN and Disney DTC services; ESPN impact from its late FY19-23 affiliate renewal cycle, pace of cord shaving, and 2022+ sports renewals; and Peak Content concerns (i.e., the sustainability of its crucial Marvel and Star Wars franchises).
■ Key Catalysts: FOXA shareholder vote (July 27); NFL ratings (starts August); F4Q18 earnings (early November, likely to disclose FY19 swing factors including DTC spending); and Verizon renewal (CYE18).
■ Valuation/Risks: DIS is trading at 9.6x CY19e EV/EBITDA and 15x P/E, well above the media sector but reflective of its scale, brands, high return on total assets, and very attractive Theme Parks business soon being the largest segment. Our CYE18 target price is derived via DCF, using an 8.7% cost of equity, 3.25% pre-tax cost of debt, and 2% terminal growth. Risks to our rating: economic cyclicality, level of DTC spending and success, long-term programming costs (esp. NFL), popularity of content, and cord-cutting pace.
Share price performance
D IS.N S& P 5 0 0 IN D EX
Ju l - 1 7 O ct - 1 7 Jan - 1 8 A p r - 1 8 Ju l - 1 89 0
1 0 0
1 1 0
1 2 0
1 3 0
On 06-Jul-2018 the S&P 500 INDEX closed at 2759.82Daily Jul07, 2017 - Jul06, 2018, 07/07/17 = US$103.32
Quarterly EPS Q1 Q2 Q3 Q42017A 1.55 1.50 1.58 1.072018E 1.89 1.84 1.95 1.362019E 1.74 1.78 2.12 1.50
Financial and valuation metricsYear 9/17A 9/18E 9/19E 9/20EEPS (CS adj.) (US$) 5.70 7.07 7.14 7.83Prev. EPS (US$) - - - -P/E rel. (%) 85.7 84.5 91.8 92.3Revenue (US$ m) 55,137.0 59,204.1 60,595.4 65,031.4EBITDA (US$ m) 16,655.0 17,784.9 17,282.4 18,303.8EV/EBITDA (current) 10.6 9.9 10.2 9.6Net debt (US$ m) 21,274 20,825 21,109 19,900ROIC (%) 14.12 18.48 15.20 15.58
Number of shares (m) 1,486.75 IC (current, US$ m) 66,278.00BV/share (Next Qtr., US$) 31.6 EV/IC (x) 2.5Net debt (Next Qtr., US$ m) 21,053.4 Dividend (current, US$) -Net debt/tot eq (Next Qtr.,%) 41.9Source: Company data, Thomson Reuters, Credit Suisse estimates

10 July 2018
The Walt Disney Company (DIS) 2
The Walt Disney Company (DIS)Price (06 Jul 2018): US$104.78; Rating: NEUTRAL; Target Price: 114.00; Analyst: Douglas MitchelsonIncome Statement 9/17A 9/18E 9/19E 9/20ERevenue (US$ m) 55,137.0 59,204.1 60,595.4 65,031.4EBITDA (US$ m) 16,655 17,785 17,282 18,304Depr. & amort. (2,782) (2,961) (3,118) (3,263)EBIT (US$) 13,775 14,837 14,164 15,040Net interest exp (385) (519) (492) (510)PBT (US$) 13,788 14,492 13,778 14,667Income taxes (4,422) (1,756) (2,893) (3,153)Profit after tax 9,366 12,737 10,885 11,514Minorities (386) (461) (536) (519)Reported net income (US$) 8,980 12,276 10,349 10,995Other NPAT adjustments (17) 1,702 0 0Adjusted net income 8,997 10,574 10,349 10,995Cash Flow 9/17A 9/18E 9/19E 9/20ECash flow from operations 12,343 13,238 13,453 13,831CAPEX (3,623) (4,626) (5,317) (4,161)Free cashflow to the firm 8,720 8,612 8,136 9,670Cash flow from investments (4,111) (6,387) (5,317) (4,161)Net share issue(/repurchase) (9,368) (5,608) (6,000) (6,000)Dividends paid (2,445) (2,479) (2,514) (2,557)Cashflow from financing activities (8,959) (7,595) (10,170) (9,461)Change in cash (727) (744) (2,034) 209Balance Sheet (US$) 9/17A 9/18E 9/19E 9/20ECash & cash equivalents 4,017 3,359 1,325 1,534Account receivables 8,633 9,277 9,845 10,690Other current assets 1,866 2,060 2,186 2,211Total fixed assets 28,406 30,423 32,894 34,076Investment securities - - - -Total assets 95,789 98,592 100,046 103,067Total current liabilities 19,595 13,897 14,799 15,887Shareholder equity 41,315 46,247 49,031 52,404Total liabilities and equity 95,789 98,592 100,046 103,067Net debt 21,274 20,825 21,109 19,900Per share 9/17A 9/18E 9/19E 9/20ENo. of shares (wtd avg) 1,578 1,496 1,449 1,404CS adj. EPS 5.70 7.07 7.14 7.83Prev. EPS (US$)Dividend (US$) 1.55 1.66 1.74 1.82Free cash flow per share 5.53 5.76 5.62 6.89Earnings 9/17A 9/18E 9/19E 9/20ESales growth (%) (0.9) 7.4 2.4 7.3EBIT growth (%) (3.0) 7.7 (4.5) 6.2Net profit growth (%) (4.1) 17.5 (2.1) 6.2EPS growth (%) (0.3) 24.0 1.1 9.7EBITDA margin (%) 30.2 30.0 28.5 28.1EBIT margin (%) 25.0 25.1 23.4 23.1Pretax margin (%) 25.0 24.5 22.7 22.6Net margin (%) 16.3 17.9 17.1 16.9Valuation 9/17A 9/18E 9/19E 9/20EEV/EBITDA (x) 10.6 9.9 10.2 9.6P/E (x) 18.4 14.8 14.7 13.4Returns 9/17A 9/18E 9/19E 9/20EROIC (%) 14.1 18.5 15.2 15.6Gearing 9/17A 9/18E 9/19E 9/20ENet debt/equity (%) 47.3 41.9 40.2 35.6Quarterly EPS Q1 Q2 Q3 Q42017A 1.55 1.50 1.58 1.072018E 1.89 1.84 1.95 1.362019E 1.74 1.78 2.12 1.50
Company BackgroundDisney is a US media and entertainment company. The company's core assets include its broadcast and cable networks (ABC, ESPN), theme parks, retail stores, and film studio.
Blue/Grey Sky Scenario
Our Blue Sky Scenario (US$) 129.00In this scenario, the shift to V-MVPDs accelerates and rate growth and affiliate revenues exceed base case estimates.Consolidated revenue improves to +9% vs our forecast of +7%. EBITDA growth improves to +10.6% Y/Y (CSe +7%) on the revenue and lower marketing spend to attract viewers at the Media Networks. As a result, we would expect to see DIS shares trade at 11x FY19E EV/EBITDA and 16.5x P/E vs base case 10x and 15x, resp. A $129 TP results.
Our Grey Sky Scenario (US$) 87.00Cord cutting accelerates as subscriber declines worsen, and affiliate and advertising revenue both miss our base case estimates. Parks growth also slows; Consolidated revenue is +5% vs our forecast of +7%, and EBITDA suffers. As a result, we would likely see DIS shares trade at a lower multiple - 8x EV/EBITDA and 13x P/E vs respective base case 10x and 15x multiples. This results in an $87 target price.
Share price performance
D IS.N S& P 5 0 0 IN D EX
Ju l - 1 7 O ct - 1 7 Jan - 1 8 A p r - 1 8 Ju l - 1 89 0
1 0 0
1 1 0
1 2 0
1 3 0
On 06-Jul-2018 the S&P 500 INDEX closed at 2759.82Daily Jul07, 2017 - Jul06, 2018, 07/07/17 = US$103.32
Source: Company data, Thomson Reuters, Credit Suisse estimates

10 July 2018
The Walt Disney Company (DIS) 3
Table of ContentsExecutive Summary 4
Investment Thesis in Charts 6
Valuation 12
Forecast Summary 17
PEERs 19
Financial Statements 20
Appendix 23
Investment Risks 30

10 July 2018
The Walt Disney Company (DIS) 4
Executive SummaryWalt Disney shares have underperformed over the past three years, even as both Parks and Film profitability grew ~50% (FY15-18e), the company repurchased $23b of stock, and overall returns remained relatively stable at very high levels. Parks cyclicality/investment levels and Peak Content concerns for Film suggest that growth in those divisions have not fully flowed through to Disney’s valuation. The primary culprit is the company’s Media Networks businesses, in particular ESPN, for which audiences have begun shifting video usage to on-demand streaming platforms and EBIT has declined ~20% in the past few years.
The shift to streaming has led consumers to cut the cord (although at a much slower pace than virtually anyone expected, with pay TV subscribers down only ~0.5% Y/Y currently) and to shift to skinnier pay TV bundles (a larger issue than many had expected, hampering ESPN subscribers by ~3%/yr in the past few years). Meanwhile, TV advertising has been affected by advertisers shifting money to digital platforms and audiences moving to platforms with no ads (such as Netflix) or with low ad loads (like VOD and many TV Everywhere apps). ESPN in particular has seen advertising affected by plummeting Sports Center viewership since audiences can get their sports news on mobile apps at their convenience and customized to their interests. With increased competition for audiences, media companies that are long-term focused are increasing their investments in content and marketing, hampering near-term margins.
At the same time, media companies have not been investing aggressively enough in streaming to the point where investors can begin to gauge the future of the network business model. While the parallel is far from perfect, when the music sector was approaching 50% of its revenue from digital sales (vs. physical goods such as CDs), investors had greater confidence as to where sector revenue and margins were going to settle out. For the U.S. media sector, online/on-demand advertising revenue is under 10% of total, and direct-to-consumer streaming platforms are nascent. Although Disney is investing in new digital platforms like Hulu ($500m of FY18e losses) and BamTech ($330m of FY18e losses), losses have been only rising for both, neither has achieved sufficient scale relative to the challenges at Disney’s linear networks (which have $24b of revenue and 26% EBIT margins, FY18e), and the company discloses very little information about either service.
Into this vacuum, Disney has pivoted to aggressively embrace DTC with ESPN+ launched (early 2018), younger-focused Disney DTC launching in the United States (late CY19) and overseas (CY19 and on), and potentially expanding a more adult-focused Hulu to overseas markets in conjunction with partners or on its own under a different brand. Management’s strategy for Disney DTC includes original TV shows and movies; the appropriate TV shows and films from throughout the company’s library; and the pay 1 rights for its Marvel, Star Wars, animation, and Disney movies.
No other company in media has outlined such an aggressive strategy, perhaps because the cost to do so is very high. Rather than sell all of that content to third parties and make an easy and quick margin, Disney is hoping it can build up a global subscriber base of streaming customers that will ultimately deliver as much or more revenue, following Netflix’s playbook. If Disney is successful, we believe the company will be in a unique position among media stocks as the only company for which investors will have confidence in future earnings, much less repositioning part of the model as a Netflix-like growth opportunity.
In the meantime, Disney’s management has been unwilling to detail how much it plans to invest in these DTC services, especially the shift away from licensing some content to third parties. For perspective as to materiality, Disney currently garners ~$6.5b of third-party licensing revenue (FY18e) across its Film and Media Networks businesses. Based on our analysis (see appendix), we see almost no earnings growth in FY19 owing to DTC costs,

10 July 2018
The Walt Disney Company (DIS) 5
tough film comps, and ESPN’s renewal cycle not kicking in until late in the fiscal year. In fact, we are ~6% below consensus estimates for Disney for FY19e, indicating to us that the Street has not yet taken all of these factors into account. Of note, Disney management tends to give forward fiscal year earnings visibility by detailing key swing factors for the new fiscal year on its earnings call in November.
With little earnings growth, this suggests the only way for Disney’s stock to rise is via multiple expansion. While many investors are optimistic that Disney DTC has terrific potential given its content lineup, strong brands, and ability to leverage Disney’s global marketing and distribution, there will be little visibility as to how successful it might be until it launches in the United States, which is not for another 12-18 months; it is not a recipe for multiple expansion anytime soon.
Another complicating factor is, of course, Disney’s pursuit of the $82b acquisition of the majority of 21st Century Fox and perhaps Sky as well. If successful, Disney will be adding significantly more scale to its entertainment content library and production in both TV and film, becoming by far the largest owner and creator of content in the world. This would also bring Disney’s ownership stake in Hulu from 30% to 60% and would add leading distribution and content operations in Europe and India, both of which have direct-to-consumer streaming platforms already built and scaled. This should put Disney in an even better position to go after the global streaming opportunity and suggests that management might approach its pivot to DTC much more aggressively than it has been on a stand-alone basis. It is also worth noting that major M&A deals can often hold back stocks, as shares issued have to be absorbed, changes in risk profiles have to be accommodated given higher debt leverage levels, and there is execution and strategy uncertainty. Disney has already noted that its share repurchases will be halted until the balance sheet is refreshed.
Overall, Disney is the best positioned traditional media company with:
■ leading brands;■ a global presence;■ scale;■ an upcoming ESPN affiliate renewal cycle;■ terrific Theme Park growth prospects;■ an intriguing longer-term streaming opportunity, and;■ a very high level of returns being generated per our HOLT® analysis, especially relative
to its low cost of capital.
Still, we believe negative catalysts (Street estimates need to come down, in our view), lack of FY19 earnings growth, and incremental DTC investment uncertainty if it wins Fox suggest only modest upside to shares this year, and with 9% upside potential to our target price, we are initiating coverage with a Neutral rating.

10 July 2018
The Walt Disney Company (DIS) 6
Investment Thesis in ChartsFigure 1: At Its Theme Parks, Disney Is Aggressively Ramping Investment (See Appendix for Details)…
1.5
2.7 2.9
2.1
2.7
3.6
4.2
3.2
4.1
4.8
3.6
4.95.3
5.6
FY10 FY12 FY14 FY16 FY18E FY20E FY22E
Walt Disney - Parks Capex Projects ($B)
California Adventure
Cruise Ship 3 ,FantasylandExpansion
Begins; Cars Land DCA
Ongoing Fantasyland Expansion,
Cruise Ship 4& MyMagic+
Shanghai Disneyland
Pandora: World of
Avatar WDW;
Iron Man Ride & New
Hotel in Hong Kong
Toy Story Lands WDW & Shanghai; Hong Kong Expansion
begins
Cruise Ships 6 & 7;
Ongoing Paris Expansion; Hong Kong Expansion
Completes
Star Wars Lands CA & FL; Marvel Land CA; Ongoing
Hong Kong Expansion
WDW & Epcot Makeovers;
Cruise Ship 5New Luxury
Hotel CA,Paris
Expansion Begins
Source: Credit Suisse, Company Reports.
Figure 2: …Making the Parks, Experience, and Consumer Segment a Major Growth Driver (Note: This Anticipates Disney’s New Segment Reporting)
6,244 6,671 7,525 7,953
8,970 9,896
13.2%
6.8%
12.8%
5.7%
12.8%
10.3%
FY18E FY19E FY20E FY21E FY22E FY23E
Parks, Experience & Consumer EBIT
Parks, Experiences & Consumer Products % Y/Y
Source: Credit Suisse, Company Reports.

10 July 2018
The Walt Disney Company (DIS) 7
Figure 3: At Cable Networks, After Years of Deterioration, Subscriber Losses Have Begun to Moderate (Virtual MVPDs Are Helping to Partially Offset Traditional Subscriber Losses)…
-3%
-1%
0%
-1% -1%
-2%
-1%
-2%
-3%
-2%
-3%
-4%-3%
-3%-3%
3Q14 1Q15 3Q15 1Q16 3Q16 1Q17 3Q17 1Q18
Disney Cable Nets Subscriber Growth
Source: Company data, Credit Suisse estimates.
Figure 4: …and Disney’s U.S. Affiliate Renewal Cycle Is Approaching – After a 3.5-Year Period with Virtually No Deals, ESPN/ABC/Disney/Freeform Will Renew 95% of Its Carriage Deals from Late in FY19 Through FY23…
17%
5%
23%
16%18%
22%
0% 0%2%
22%
28%
0%
23% 22%
FY10 FY12 FY14 FY16 FY18 FY20 FY22
Walt Disney - U.S. Media Networks Affiliate Cycle Timeline
% of Distribution Renewing by Fiscal Year
Prior Deal Cycle
New Deal Cycle
Source: Credit Suisse, Company Reports; Note: Deals shown when executed.

10 July 2018
The Walt Disney Company (DIS) 8
Figure 5: …Suggesting the New Media Networks Segment Profitability (Which Is Ex-Digital and International) Should Stabilize by FY20
6,834 6,533 6,816 6,869 6,696 6,794 6,238
-2.3%
-4.4%
4.3%
0.8%
-2.5%
1.5%
-8.2%
FY18E FY19E FY20E FY21E FY22E FY23E FY24E
U.S. Media Networks EBITU.S. Media Networks % Y/Y
Source: Credit Suisse, Company Reports.
Figure 6: For Film, FY18 Record Successes Leave Tough Comps for FY19, While FY20 Looks Promising. Given Little Visibility Thereafter, We Assume What Is Still a High Level of Success
$5,025 $4,584
$7,453
$5,708
$8,513 $7,850
FY14 FY15 FY16 FY17 FY18E FY19E
Walt Disney Film Studio - Annual WW Box Office
3,046 2,590 2,792
2,326 2,293 2,276 2,274
29.3%
-15.0%
7.8%
-16.7%
-1.4% -0.7% -0.1%
FY18E FY19E FY20E FY21E FY22E FY23E FY24E
Studio Entertainment EBITStudio Entertainment % Y/Y
Source: Credit Suisse, Company Reports, Box Office Mojo (http://www.boxofficemojo.com). Source: Credit Suisse, Company Reports.

10 July 2018
The Walt Disney Company (DIS) 9
Figure 7: Significant Investments in Content for the Disney-Branded DTC Service Will Begin Hitting Its Income Statement in FY20 Post-Launch
Figure 8: We Expect the New Direct-to-Consumer and International Segment to Produce Significant Losses over the Coming Few Years
178
1,072
1,478
1,904
2,373
FY19E FY20E FY21E FY22E FY23E
Disney's Direct to Consumer Programming Expense
(508)
(832)
(1,243)
FY18E FY19E FY20E
Direct to Consumer and International EBIT
Direct-to-Consumer & Int'l
Source: Credit Suisse, Company Reports. Source: Credit Suisse, Company Reports.
Figure 9: Interestingly, the New Reporting Structure That Begins 10/1/18 Will Isolate the DTC Losses, Improve the Appearance of Media Networks, and, Perhaps Most Importantly, Leave Parks as the Largest Division of the Company, by Our EstimatesOld Reporting Structure FY19E New Reporting Structure FY19E Change
Revenue Revenue ($)Media Networks 25,005 U.S. Media Networks 23,162 (1,843)Parks and Resorts 21,550 Parks, Experiences & Consumer Products 26,395 4,845Studio Entertainment 9,196 Studio Entertainment 9,196 -Consumer Products & Interactive Media 4,845 Direct-to-Consumer & International 1,843 N/A
Consolidated Walt Disney 60,595 Consolidated Walt Disney 60,595 -
EBIT pre Corporate EBIT pre CorporateMedia Networks 5,822 U.S. Media Networks 6,635 813Parks and Resorts 4,950 Parks, Experiences & Consumer Products 6,671 1,721Studio Entertainment 2,590 Studio Entertainment 2,590 -Consumer Products & Interactive Media 1,721 Direct-to-Consumer & International (813) N/A
Consolidated Walt Disney 15,082 Consolidated Walt Disney 15,082 -
EBIT Margin pre Corporate EBIT Margin pre Corporate (bp)Media Networks 23% U.S. Media Networks 29% 54Parks and Resorts 23% Parks, Experiences & Consumer Products 25% 23Studio Entertainment 28% Studio Entertainment 28% -Consumer Products & Interactive Media 36% Direct-to-Consumer & International -44% (796)
Consolidated Walt Disney 25% Consolidated Walt Disney 25% 0
Source: Credit Suisse, Company Reports.

10 July 2018
The Walt Disney Company (DIS) 10
Figure 10: Overall, We Are Well Below the Consensus After Flowing Direct-to-Consumer Service Losses Through Our Forecast (See Analysis in Appendix)
FY18E FY19E FY20E FY21E FY22ECredit Suisse EPS 7.07$ 7.18$ 7.90$ 8.24$ 9.16$ Consensus EPS 7.10$ 7.66$ 8.22$ 8.60$ 10.02$
Difference -0.4% -6.3% -3.9% -4.1% -8.6%
Source: Credit Suisse, Company Reports; Note: In FY20, our model incorporates the 53rd week in Disney’s fiscal calendar, but many Street estimates likely do not.
Figure 11: Pursuit of the Fox/Sky Acquisitions Halts Capital Returns…
1.4x
3.4x
4.0x
Current Post Post
Fox Fox + Sky
Walt Disney Gross Leverage Currently and After Proposed Deals
Source: Credit Suisse, Company Reports.
Figure 12: …And a Successful Fox Acquisition Could Spark a Much More Dramatic Investment in Disney’s Direct-to-Consumer Services (and Understandably So)
$1.2 $1.3$2.3 $2.7 $3.0
$4.2
$5.4$5.9
$6.7
$7.9 $8.0
$9.5
$11.9
$13.1
$15.7
A&E AMCX LGF DISCA Hulu Amazon VIAb CBS Sony FOXA Netflix DIS TWX NBCU DIS + FOX (1)
$ in Billions
U.S. Media - Entertainment Content Spending, 2018
Source: Credit Suisse, Company Reports; (1) Revenue eliminations will reduce the DIS+FOX reported revenue (i.e., Modern Family, X-Men, and Pandora license fees, among others).
A

10 July 2018
The Walt Disney Company (DIS) 11
Figure 13: According to HOLT, Disney’s stock is discounting meaningfully deteriorating returns over the coming five years. While we see the potential for Disney to maintain its already very strong return profile, we would like to see investors fully incorporating the near-term cost of Disney’s shift to global direct-to-consumer streaming before recommending shares.
0
5
10
15
20
1997 2000 2003 2006 2009 2012 2015 2018 2021 2024 2027
CFR
OI
%
Source: Company data, Credit Suisse estimates.
10 July 2018
The Walt Disney Company (DIS) 12
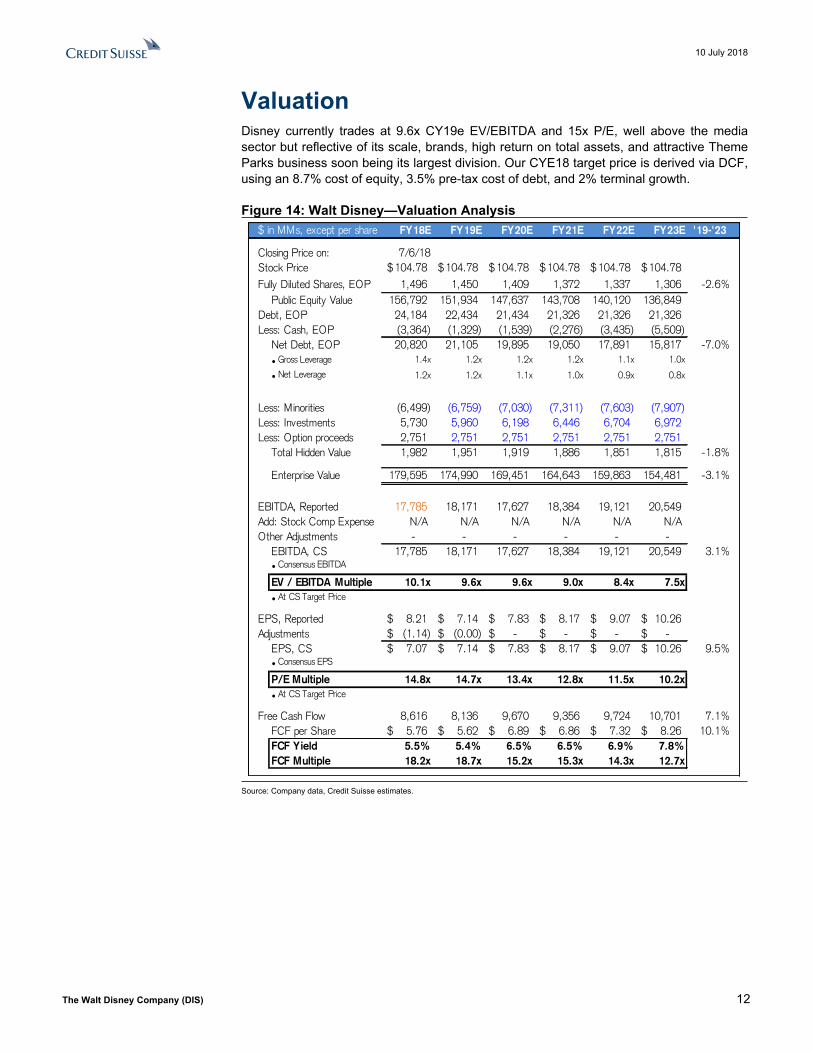
ValuationDisney currently trades at 9.6x CY19e EV/EBITDA and 15x P/E, well above the media sector but reflective of its scale, brands, high return on total assets, and attractive Theme Parks business soon being its largest division. Our CYE18 target price is derived via DCF, using an 8.7% cost of equity, 3.5% pre-tax cost of debt, and 2% terminal growth.
Figure 14: Walt Disney—Valuation Analysis$ in MMs, except per share FY18E FY19E FY20E FY21E FY22E FY23E '19-'23
Closing Price on: 7/6/18Stock Price 104.78$ 104.78$ 104.78$ 104.78$ 104.78$ 104.78$Fully Diluted Shares, EOP 1,496 1,450 1,409 1,372 1,337 1,306 -2.6%
Public Equity Value 156,792 151,934 147,637 143,708 140,120 136,849Debt, EOP 24,184 22,434 21,434 21,326 21,326 21,326Less: Cash, EOP (3,364) (1,329) (1,539) (2,276) (3,435) (5,509)
Net Debt, EOP 20,820 21,105 19,895 19,050 17,891 15,817 -7.0%• Gross Leverage 1.4x 1.2x 1.2x 1.2x 1.1x 1.0x
• Net Leverage 1.2x 1.2x 1.1x 1.0x 0.9x 0.8x
Less: Minorities (6,499) (6,759) (7,030) (7,311) (7,603) (7,907)Less: Investments 5,730 5,960 6,198 6,446 6,704 6,972Less: Option proceeds 2,751 2,751 2,751 2,751 2,751 2,751
Total Hidden Value 1,982 1,951 1,919 1,886 1,851 1,815 -1.8%
Enterprise Value 179,595 174,990 169,451 164,643 159,863 154,481 -3.1%
EBITDA, Reported 17,785 18,171 17,627 18,384 19,121 20,549Add: Stock Comp Expense N/A N/A N/A N/A N/A N/AOther Adjustments - - - - - -
EBITDA, CS 17,785 18,171 17,627 18,384 19,121 20,549 3.1%• Consensus EBITDA
EV / EBITDA Multiple 10.1x 9.6x 9.6x 9.0x 8.4x 7.5x• At CS Target Price
EPS, Reported 8.21$ 7.14$ 7.83$ 8.17$ 9.07$ 10.26$ Adjustments (1.14)$ (0.00)$ -$ -$ -$ -$
EPS, CS 7.07$ 7.14$ 7.83$ 8.17$ 9.07$ 10.26$ 9.5%• Consensus EPS
P/E Multiple 14.8x 14.7x 13.4x 12.8x 11.5x 10.2x• At CS Target Price
Free Cash Flow 8,616 8,136 9,670 9,356 9,724 10,701 7.1%FCF per Share 5.76$ 5.62$ 6.89$ 6.86$ 7.32$ 8.26$ 10.1%FCF Yield 5.5% 5.4% 6.5% 6.5% 6.9% 7.8%FCF Multiple 18.2x 18.7x 15.2x 15.3x 14.3x 12.7x
Source: Company data, Credit Suisse estimates.

10 July 2018
The Walt D
isney Com
pany (DIS)
13
Figure 15: Walt Disney—Valuation Perspectives
$4.00
$4.50
$5.00
$5.50
$6.00
$6.50
$7.00
$7.50
$8.00
$70
$80
$90
$100
$110
$120
$130
$140
Jun '14 Dec '14 Jun '15 Dec '15 Jun '16 Dec '16 Jun '17 Dec '17
Pro
ject
ed E
PS
Sha
re P
rice
Walt Disney Share Price and Earnings Revisions
Stock Price F2016e EPS F2017e EPS F2018e EPS F2019e EPS5x
7x
9x
11x
13x
15x
17x
19x
21x
Jun '08 Jun '09 Jun '10 Jun '11 Jun '12 Jun '13 Jun '14 Jun '15 Jun '16 Jun '17
Walt Disney 1-Yr Forward P/E
10-Yr Avg 15.5x
±1 Std Dev
Media P/E ex-DIS
0.0%
1.0%
2.0%
3.0%
4.0%
5.0%
6.0%
7.0%
8.0%
9.0%
10.0%
1988 1991 1994 1997 2000 2003 2006 2009 2012 2015 2018
Walt Disney Dividend Yield
DIS Dividend Yield
10Y Treasury Yield
VIAB
VZ
FOXA*
DIS
T
CMCSACBS
DISCA
GOOGLFB
SIRI
AMCX*
TMUS*
ATVI
EA
0x
5x
10x
15x
20x
25x
30x
-5% 0% 5% 10% 15% 20% 25% 30%
Forw
ard
P/E
3-YR EPS CAGR '18e-'21e
Media and Telecom PEGPEG=1
*Consensus EPS and Growth
Source: Company data, Credit Suisse estimates, Thomson Reuters.

10 July 2018
The Walt Disney Company (DIS) 14
Figure 16: Walt Disney—DCF$MMs, except per share
Equity Cost of Equity Sum of Free Cash Flow at PV $40,407 Price Target Sensitivity AnalysisTarget Price $114 Risk Free Rate 3.50% Terminal Value (9.1% discount rate) $148,576Fully Diluted Shares 1,496 Equity Risk Premium 6.00% Enterprise Value $188,983 2018 Equity Value Per ShareEquity Value $170,985 Beta 0.9 Enterprise Value / '18E EBITDA Equity Weight 88% Cost of Equity 8.72% 1.0% 2.0% 3.0%
Debt, Year End '18E ($24,184) 6.9% $119 $141 $174Debt Cost of Debt Cash, Year End '18E $3,364 7.9% $99 $114 $136Debt (Year End '18E) $24,184 Wtd Avg Interest Rate 3.25% Other 8.9% $84 $95 $110Preferred Stock $0 Cost of Debt after tax 2.44% Net Asset Value $168,163Debt Value $24,184 Terminal Value EBTIDA Multiple Debt Weight 12% WACC 7.9% Minority Stakes in Consolidated Entities ($6,499)
Investments / JVs $5,730 1.0% 2.0% 3.0%Options / Warrant Proceeds $2,751 6.9% 10.5x 12.7x 16.1x
Calendar Year 2019E 2020E 2021E 2022E 2023E Other $0 7.9% 9.0x 10.6x 12.9xEBITDA $18,171 $17,627 $18,384 $19,121 $20,549 Total Asset Value $170,145 8.9% 7.8x 9.1x 10.7xLess: CapEx ($5,317) ($4,161) ($5,524) ($5,876) ($3,639)Less: Cash Taxes ($3,376) ($3,593) ($3,669) ($3,968) ($4,227) Shares Outstanding (Year End '18E) 1,456 Terminal Value FCF MultipleLess: Working Capital Chg 208 87 49 69 - Option Shares 33Free Cash Flow $9,687 $9,960 $9,239 $9,346 $12,682 Fully Diluted Shares Out 1,489 1.0% 2.0% 3.0%
6.9% 17.0x 20.6x 26.1x$8,974 $8,548 $7,346 $6,884 $8,655 Market Value per Share $114.26 7.9% 14.6x 17.2x 20.8x
Target Price per Share $114 8.9% 12.7x 14.7x 17.3xSum of discounted FCF $40,407Terminal value @ 2023 $217,717 Closing Price on 11/22/17 $104.78
Difference vs. Target 8.8%
Terminal Growth
Terminal Growth
Terminal Growth
2018 PV of FCF discounted at 9.1%
WACC
WACC
WACC
Source: Company data, Credit Suisse estimates.
Figure 17: Walt Disney—Sum-of-the-Parts AnalysisWalt Disney Sum-of-the-Parts Analysis$MMs, except per share data EBITDA EBITDA Per DIS % of
Revenue EBITDA Margin CAGR Mult Value Share Total Valuation Methodology
Walt Disney Sum-of-the-Parts AnalysisESPN 12,963 4,062Hearst 20% Minority (2,593) (812)ESPN - 80% Owned 10,371 3,250 31% -3% 8.0x 25,997 17$ 12% Fox pre-deal U.S. EBITDA multiple (leverage over MVPDs)Disney Channels 2,741 986 36% 7% 10.0x 9,855 7$ 5% Premium EBITDA multiple -- No U.S. ads, Int'l growthFreeform 1,129 430 38% 2% 8.0x 3,440 2$ 2% Fox pre-deal EBITDA multiple (leverage over MVPDs)BamTech 405 (273) -67% N/A 3,750 3$ 2% Purchase price ($1.58b for 42% and $1b for 33%)
Cable Networks Total 14,646 4,392 30% 1% 9.8x 43,042 29$ 21%ABC Network 3,611 614 17%ABC TV Stations 1,309 288 22%TV Production 2,239 358 16%
Broadcasting Total 7,159 1,260 18% 5% 9.4x 11,844 8$ 6% CBS EBITDA multipleHulu (500) 1,800 1$ 1% 30%-owned x TWX $6b purchase price implied A&E 655 6.0x 3,930 3$ 2% Viacom U.S. Nets multiple (adjusted for taxes)
Minorities Total 155 5,730 4$ 3%Media Networks Total 21,804 5,807 27% 2% 10.4x 60,616 41$ 29%
Domestic Parks 11,963 3,945 33% 10.5x 41,572 28$ 20% Price to 10% return on total assets (vs. Disney 8% WACC)Cruise Ships 4,159 1,456 35% 12.0x 17,468 12$ 8% Premium to publicly-traded cruise ship companies (10x)
Total Domestic Parks 16,122 5,400 33% 9% 10.9x 59,040 39$ 28%Int'l Parks 4,165 1,281 31% 14% 16.6x 21,302 14$ 10% Priced at domestic PEG
Worldwide Parks 20,287 6,681 33% 12% 12.0x 80,342 54$ 38%
Disney Animation 1,527 500 33% 25.0x 12,500 8$ 6% Incredible brands, library cash flow, recent hot streakPixar Animation 1,527 500 33% 20.0x 10,000 7$ 5% Purchased for $8b, library growing, hit rate very highMarvel 3,054 1,000 33% 15.0x 15,000 10$ 7% Purchased for $4.2b, record film franchise developedLucas / Star Wars 2,290 750 33% 10.0x 7,500 5$ 4% Purchased for $4b, slate well above expectationsWalt Disney Pictures 1,252 410 33% 10.0x 4,100 3$ 2% Library value, revitalizing brands with live action
Studio Entertainment Total 9,649 3,160 33% -5% 15.5x 49,100 33$ 23%
Consumer Products 4,870 1,932 40% 1% 12.0x 23,186 15$ 11% CP multiple
Corporate (453) 4% 8.0x (3,622) (2)$ -2% Multiple related to growthTotal Disney Asset Value 56,611 17,128 30% 4% 12.2x 209,622 140$
Net Debt 20,505 14$ Disney Equity Value 189,117 126$
FY18
Source: Company data, Credit Suisse estimates.

10 July 2018
The Walt Disney Company (DIS) 15
HOLT Valuation AnalysisFigure 18: DIS HOLT Valuation AnalysisRelative Wealth Chart, Asset Growth & TSR
0
5
10
15
20
1997 2000 2003 2006 2009 2012 2015 2018 2021 2024 2027
CFR
OI
%
Operating Drivers
-5
0
5
10
15
20
25
1997 1999 2001 2003 2005 2007 2009 2011 2013 2015 2017
Sal
es G
row
th-5
0
5
10
15
20
25
1997 2000 2003 2006 2009 2012 2015 2018 2021 2024 2027
Ass
et G
row
th (
%)
0
10
20
30
40
1997 1999 2001 2003 2005 2007 2009 2011 2013 2015 2017H
OLT
Ope
ratin
g M
argi
n
0
50
100
150
1997 2000 2003 2006 2009 2012 2015 2018 2021 2024 2027
Tota
l Sha
reho
lder
Ret
urn
0
0.2
0.4
0.6
0.8
1
1997 1999 2001 2003 2005 2007 2009 2011 2013 2015 2017
Ass
et T
urns
HOLT Economic PE (10-year)
0
5
10
15
20
25
30
35
2008 2009 2010 2011 2012 2013 2014 2015 2016 2017 2018
HO
LT E
cono
mic
PE
DIS Media U.S. Market
Cash Deployed (10-year)
0
2,000
4,000
6,000
8,000
10,000
12,000
14,000
16,000
18,000
2007 2008 2009 2010 2011 2012 2013 2014 2015 2016 2017
Cas
h D
eplo
yed
($M
)
Dividends Net Share Repurchase Capex R&D Exp Int Exp M&A
Spread between DIS & U.S. Market (10-year)
-4
-2
0
2
4
6
8
10
2008 2009 2010 2011 2012 2013 2014 2015 2016 2017 2018
Spr
ead
Spread (Premium / Discount)
CFROI® Revisions by Quarter (5-year)
-1.0
-0.5
0.0
0.5
1.0
1.5
Jun-13 Jun-14 Jun-15 Jun-16 Jun-17 Jun-18
CFR
OI R
evis
ions
(bp
s)
3 Month CFROI Revisions
Source: HOLT

10 July 2018
The Walt Disney Company (DIS) 16
Scenario Analysis■ Blue Sky ($129 Target Price): In this scenario, the shift to Virtual MVPDs accelerates,
resulting in FY18E U.S. cable network subscriber losses and rate growth coming in ahead of our forecast of -2.7% and +6.5%, respectively. Media Networks Affiliate revenue comes in ahead of our forecast of +5.0% Y/Y, and Advertising revenue (CSe -3%) also improves with more viewers tuning into the networks. Attendance and spending at the U.S. Theme Parks also beats our expectations of +4.2% and +5.3%, respectively. Consolidated revenue improves to +9% vs our forecast of +7%. EBITDA growth improves to +10.6% Y/Y (CSe +7%) on the revenue and lower marketing spend to attract viewers at the Media Networks. As a result, we would expect to see DIS shares trade at 11x FY19E EV/EBITDA and 16.5x P/E vs our base case of 10x EV/EBITDA and 15x P/E, respectively. Our blue sky scenario results in a $129 target price.
■ Grey Sky ($87 Target Price): In this scenario, cord cutting accelerates, resulting in FY18E U.S. subscriber declines worse than our forecast of -2.7%. Revenue at the Media Networks segment suffers as Affiliate revenue comes in below our forecast of +5% Y/Y and Advertising revenue misses our estimate of -3%. Theme Parks growth is also less robust than our expectations for U.S. attendance growth of +4.2% and spending +5.3%. Consolidated revenue is +5% vs our forecast of +7%, and EBITDA suffers as lower revenue combines with increased marketing and promotion to attract viewers to the networks and attendees to the parks. As a result, we would likely see DIS shares trade at a lower multiple - 8x EV/EBITDA and 13x P/E vs our base case of 10x and 15x P/E, respectively. Our grey sky scenario results in an $87 target price.

10 July 2018
The Walt Disney Company (DIS) 17
Forecast SummaryFigure 19: Our Forecast Is Slightly More Bearish than the Street in the Short TermCS FORECAST VS. STREET
MMs, except EPS F3Q18E F4Q18E FY18E FY19E FY20E CAGRRevenue CS 15,389 13,916 59,204 60,595 65,031 4.8%
Consensus 15,357 13,877 59,068 60,474 63,086 3.3% Difference +0.2% +0.3% +0.2% +0.2% +3.1%
Adj. EBITDA CS 4,785 3,697 17,785 17,282 18,304 1.4%Consensus 4,869 3,725 17,910 18,045 18,638 2.0% Difference -1.7% -0.8% -0.7% -4.2% -1.8%
EPS CS 1.95$ 1.36$ 7.07$ 7.14$ 7.83$ 5.3%Consensus 1.97$ 1.41$ 7.09$ 7.65$ 8.16$ 7.2% Difference -$0.02 -$0.04 -$0.02 -$0.50 -$0.32
FCF CS 2,062 1,836 8,616 8,136 9,670 5.9%Consensus 3,517 2,356 10,654 10,933 10,903 1.2% Difference -41.4% -22.1% -19.1% -25.6% -11.3%
Source: Company data, Credit Suisse estimates, Thomson Reuters.

10 July 2018
The Walt Disney Company (DIS) 18
Figure 20: Disney Forecast Summary$ MMs, except EPS F1Q17 F2Q17 F3Q17 F4Q17 F1Q18 F2Q18 F3Q18E F4Q18E FY15 FY16 FY17 FY18E FY19E FY20E FY21E FY22E FY23E '14-'18 '18-'23
CONSOLIDATED DISNEYRevenue 14,784 13,336 14,238 12,779 15,351 14,548 15,389 13,916 52,465 55,632 55,137 59,204 60,595 65,031 66,436 70,240 74,367 4.9% 4.7%
% Y/Y -3.0% 2.8% -0.3% -2.8% 3.8% 9.1% 8.1% 8.9% 7.5% 6.0% -0.9% 7.4% 2.4% 7.3% 2.2% 5.7% 5.9%
Expenses 10,391 8,910 9,739 9,442 10,816 9,780 10,605 10,219 36,887 38,618 38,482 41,419 43,313 46,728 47,700 50,145 52,484 4.3% 4.8%% Y/Y -2.4% 0.6% 2.4% -1.7% 4.1% 9.8% 8.9% 8.2% 5.4% 4.7% -0.4% 7.6% 4.6% 7.9% 2.1% 5.1% 4.7%
EBITDA pre-Equity 4,393 4,426 4,499 3,337 4,535 4,768 4,785 3,697 15,578 17,014 16,655 17,785 17,282 18,304 18,736 20,095 21,883 6.5% 4.2%% Y/Y -4.4% 7.5% -5.7% -5.5% 3.2% 7.7% 6.3% 10.8% 12.7% 9.2% -2.1% 6.8% -2.8% 5.9% 2.4% 7.3% 8.9%% Margin 29.7% 33.2% 31.6% 26.1% 29.5% 32.8% 31.1% 26.6% 29.7% 30.6% 30.2% 30.0% 28.5% 28.1% 28.2% 28.6% 29.4%
Pre-Corp. EBIT 3,956 3,996 4,011 2,812 3,986 4,237 4,233 3,160 14,681 15,721 14,775 15,617 14,962 15,890 16,215 17,481 19,175 4.7% 4.2%% Y/Y -7.4% 4.8% -9.0% -12.4% 0.3% 5.4% 5.2% 12.6% 13.3% 7.4% -5.9% 5.3% -4.5% 6.4% 2.0% 8.0% 10.0%% Margin 25.9% 28.8% 27.5% 20.5% 25.0% 27.8% 26.7% 21.2% 26.8% 27.1% 25.7% 25.2% 23.5% 23.3% 23.3% 23.8% 24.7%
EPS 1.55$ 1.50$ 1.58$ 1.07$ 1.89$ 1.84$ 1.95$ 1.36$ 5.16$ 5.72$ 5.70$ 7.07$ 7.14$ 7.83$ 8.17$ 9.07$ 10.26$ 13.0% 7.7%% Y/Y -5.2% 10.2% -2.6% -3.1% 22.2% 22.8% 23.5% 27.7% 19.0% 10.9% -0.3% 24.0% 1.1% 9.7% 4.3% 11.1% 13.0%
CapEx 1,040 883 805 895 981 1,063 1,169 1,412 4,265 4,773 3,623 4,626 5,317 4,161 5,524 5,876 6,228 8.7% 6.1%
FCF 220 2,555 3,328 2,617 1,256 3,463 952 2,941 6,644 8,363 8,720 8,612 8,136 9,670 9,356 9,724 10,700 7.4% 4.4%% Y/Y -79.0% 7.4% 33.4% 7.3% 470.9% 35.5% -71.4% 12.4% 2.7% 25.9% 4.3% -1.2% -5.5% 18.8% -3.2% 3.9% 10.0%
Dividends 0 1,237 0 1,208 0 1,266 0 1,213 3,063 2,313 2,445 2,479 2,514 2,557 2,610 2,668 2,732Buybacks 1,465 2,035 2,444 3,424 1,313 1,295 1,500 1,500 6,095 7,499 9,368 5,608 6,000 6,000 6,000 6,000 6,000
Total Capital Return 1,465 3,272 2,444 4,632 1,313 2,561 1,500 2,713 9,158 9,812 11,813 8,087 8,514 8,557 8,610 8,668 8,732 0.2% 1.5%% of FCF NM 128.1% 73.4% 177.0% 104.5% 74.0% 157.6% 92.2% 137.8% 117.3% 135.5% 93.9% 104.6% 88.5% 92.0% 89.1% 81.6%
Net Debt 16,754 17,853 17,851 21,274 21,414 20,505 21,053 20,825 13,067 15,560 21,274 20,825 21,109 19,900 19,054 17,895 15,821 16.2% -5.3%Net Leverage 3.8x 4.0x 4.0x 6.4x 4.7x 4.3x 4.4x 5.6x 0.8x 0.9x 1.3x 1.2x 1.2x 1.1x 1.0x 0.9x 0.7x
SEGMENTSAdvertising-Broadcast 1,122 1,000 965 779 1,037 980 957 776 4,027 4,058 3,866 3,750 3,699 3,727 3,538 3,442 3,386 -1.0% -2.0%
% Y/Y -0.8% -3.3% -5.2% -11.0% -7.6% -2.0% -0.8% -0.4% 3.2% 0.8% -4.7% -3.0% -1.4% 0.8% -5.1% -2.7% -1.6%
Advertising-Cable Nets 1,407 931 1,041 884 1,283 937 1,055 876 4,334 4,451 4,263 4,152 4,126 4,176 4,069 4,007 3,920 0.1% -1.1%% Y/Y -5.4% 2.0% -7.2% -4.7% -8.8% 0.6% 1.4% -0.9% 5.0% 2.7% -4.2% -2.6% -0.6% 1.2% -2.6% -1.5% -2.2%
Affiliate-Broadcast 228 262 261 260 270 300 300 300 632 870 1,012 1,170 1,275 1,441 1,603 1,759 1,983 25.9% 11.1%% Y/Y Rpt'd 26.7% 14.0% 13.6% 13.2% 18.4% 14.4% 14.8% 15.3% 35.9% 37.7% 16.3% 15.6% 9.0% 13.1% 11.2% 9.8% 12.7%
Affiliate-Cable Nets 2,847 2,966 2,915 2,920 2,935 3,097 3,039 3,049 11,397 11,389 11,647 12,119 12,711 14,038 14,966 16,525 18,344 4.5% 8.6%% Y/Y Rpt'd 2.4% 2.8% 1.1% 2.7% 3.1% 4.4% 4.3% 4.4% 12.1% -0.1% 2.3% 4.1% 4.9% 10.4% 6.6% 10.4% 11.0%Cable Subscriber Growth -2.4% -2.8% -3.5% -3.3% -3.0% -2.7% -2.6% -2.5% -0.7% -2.0% -3.0% -2.7% -2.5% -2.5% -2.5% -3.0% -3.5% -1.9% -2.8%Cable Rate Growth 5.8% 6.4% 5.5% 5.8% 6.1% 6.6% 6.7% 6.7% 7.7% 3.7% 5.9% 6.5% 6.8% 11.7% 5.7% 8.0% 8.0% 6.1% 8.0%
TV/SVOD - Broadcast 174 165 130 147 275 218 228 246 850 792 617 967 955 1,329 1,410 1,483 1,549 4.4% 9.9%
TV/SVOD - Cable 455 622 554 475 443 606 620 570 2,024 2,129 2,105 2,239 2,239 2,239 2,239 2,239 2,239 7.5% 0.0%
Media Nets Revs 6,233 5,946 5,866 5,465 6,243 6,138 6,199 5,817 23,264 23,689 23,510 24,397 25,005 26,952 27,825 29,455 31,421 3.6% 5.2%% Y/Y -1.6% 2.6% -0.7% -3.4% 0.2% 3.2% 5.7% 6.4% 10.0% 1.8% -0.8% 3.8% 2.5% 7.8% 3.2% 5.9% 6.7%
Park attendance Growth 7.0% 0.0% 2.0% -1.2% 7.0% 6.0% 4.0% 4.0% 4.0% 7.0% 2.0% 5.3% 4.5% 5.0% 4.0% 4.0% 4.0% 5.0% 4.3%Park guest spending growth 7.0% 0.0% 2.0% -1.2% 7.0% 6.0% 4.0% 4.0% 4.0% 7.0% 2.0% 5.3% 4.5% 5.0% 4.0% 4.0% 4.0% 5.0% 4.3%Hotel Occupancy rate 91.0% 88.0% 88.0% 85.0% 91.0% 90.0% 88.0% 88.0% 87.0% 89.0% 88.0% 89.3% 89.7% 90.0% 90.0% 90.0% 90.0% 1.8% 0.2%
Domestic Parks 3,740 3,556 3,935 3,581 4,169 3,965 4,185 3,803 13,611 14,242 14,812 16,122 17,065 18,492 19,267 20,931 22,542 6.9% 6.9%% Y/Y 1.8% 3.9% 6.4% 3.8% 11.5% 11.5% 6.3% 6.2% 10.4% 4.6% 4.0% 8.8% 5.8% 8.4% 4.2% 8.6% 7.7%
International Parks 815 743 959 1,086 985 914 1,064 1,202 2,551 2,732 3,603 4,165 4,486 4,904 5,319 5,707 6,148 10.7% 8.1%% Y/Y 34.3% 46.5% 40.6% 16.0% 20.9% 23.0% 10.9% 10.7% -7.9% 7.1% 31.9% 15.6% 7.7% 9.3% 8.5% 7.3% 7.7%
Parks Total 4,555 4,299 4,894 4,667 5,154 4,879 5,249 5,006 16,162 16,974 18,415 20,287 21,550 23,396 24,586 26,638 28,689 7.7% 7.2%% Y/Y Rpt'd 6.4% 9.4% 11.8% 6.4% 13.2% 13.5% 7.2% 7.3% 7.0% 5.0% 8.5% 10.2% 6.2% 8.6% 5.1% 8.3% 7.7%Core % Y/Y 2.2% 7.2% 2.7% 6.2% 13.2% 12.4% 8.2% 7.3% 7.0% 3.1% 4.5% 10.2% 6.2% 8.6% 4.0% 6.4% 6.0%
Studio 2,520 2,034 2,393 1,432 2,504 2,454 2,848 1,843 7,366 9,441 8,379 9,649 9,196 9,675 9,013 9,062 9,130 7.3% -1.1%% Y/Y Rpt'd -7.4% -1.4% -15.9% -20.9% -0.6% 20.6% 19.0% 28.7% 1.2% 28.2% -11.2% 15.2% -4.7% 5.2% -6.8% 0.5% 0.8%
Consumer Pdcts 1,476 1,057 1,085 1,215 1,450 1,077 1,093 1,250 5,673 5,528 4,833 4,870 4,845 5,009 5,012 5,085 5,127 -2.0% 1.0%% Y/Y Rpt'd -22.7% -10.9% -5.2% -5.6% -1.8% 1.9% 0.8% 2.9% 7.4% -2.6% -12.6% 0.8% -0.5% 3.4% 0.1% 1.5% 0.8%
Programming Expense 4,011 2,839 3,203 2,869 4,058 2,984 3,429 3,103 11,977 12,363 12,922 13,574 14,634 16,531 17,002 18,299 19,405 6.4% 7.4%Y/Y % Chg -1.2% 8.6% 19.6% -4.7% 1.2% 5.1% 7.1% 8.2% 12.9% 3.2% 4.5% 5.0% 7.8% 13.0% 2.8% 7.6% 6.0%
Other Opexp 920 908 890 1,075 959 1,016 1,083 1,301 4,042 3,913 3,793 4,359 4,495 4,669 4,741 4,845 4,980 3.3% 2.7%Y/Y % Chg -2.1% -5.9% -5.8% 1.1% 4.2% 11.9% 21.7% 21.0% 5.6% -3.2% -3.1% 14.9% 3.1% 3.9% 1.5% 2.2% 2.8%
Media Nets Opexp 4,931 3,747 4,093 3,944 5,017 4,000 4,512 4,404 16,019 16,276 16,715 17,933 19,129 21,200 21,742 23,145 24,384 5.6% 6.3%% Y/Y -1.4% 4.7% 12.9% -3.2% 1.7% 6.8% 10.2% 11.7% 11.0% 1.6% 2.7% 7.3% 6.7% 10.8% 2.6% 6.5% 5.4%
Broadcasting EBIT 379 344 253 229 285 343 252 281 1,088 1,193 1,205 1,161 1,210 1,277 1,302 1,349 1,503 6.8% 5.3%% Y/Y 28.5% 13.9% -22.2% -15.5% -24.8% -0.3% -0.5% 22.8% 21.8% 9.7% 1.0% -3.7% 4.2% 5.5% 2.0% 3.6% 11.4%% Margin 24.9% 24.1% 18.7% 19.3% 18.0% 22.9% 17.0% 21.3% 19.7% 20.9% 21.9% 19.7% 20.4% 19.6% 19.9% 20.2% 21.7%
Cable Nets EBIT 864 1,791 1,462 1,236 858 1,726 1,365 1,061 5,891 5,965 5,353 5,010 4,352 4,126 4,408 4,565 5,113 -2.6% 0.4%% Y/Y -11.4% -3.0% -22.8% -1.2% -0.7% -3.6% -6.6% -14.2% 5.7% 1.3% -10.3% -6.4% -13.1% -5.2% 6.8% 3.6% 12.0%% Margin 18.3% 39.6% 32.4% 28.9% 18.4% 37.2% 29.0% 23.6% 33.2% 33.2% 29.7% 27.1% 22.8% 20.2% 20.7% 20.0% 20.9%
Domestic Parks 1,057 763 1,072 569 1,239 929 1,139 642 2,770 3,323 3,461 3,949 4,218 4,726 4,972 5,792 6,521 15.0% 10.6%% Y/Y 10.9% 6.1% -0.3% -1.2% 17.2% 21.8% 6.3% 12.9% 22.7% 20.0% 4.2% 14.1% 6.8% 12.0% 5.2% 16.5% 12.6%
International Parks 53 -13 96 177 108 25 167 229 261 -25 313 530 732 962 1,157 1,329 1,534 6.9% 23.7%% Y/Y 89.3% -86.3% NA 43.9% 103.8% NA 74.5% 29.6% -35.6% NA NA 69.3% 38.1% 31.5% 20.2% 14.9% 15.4%
Parks EBIT 1,110 750 1,168 746 1,347 954 1,307 872 3,031 3,298 3,774 4,479 4,950 5,688 6,129 7,121 8,055 13.9% 12.5%% Y/Y 13.1% 20.2% 17.5% 6.7% 21.4% 27.2% 11.9% 16.8% 13.8% 8.8% 14.4% 18.7% 10.5% 14.9% 7.7% 16.2% 13.1%% Margin 24.4% 17.4% 23.9% 16.0% 26.1% 19.6% 24.9% 17.4% 18.8% 19.4% 20.5% 22.1% 23.0% 24.3% 24.9% 26.7% 28.1%
Studio EBIT 842 656 639 218 829 847 866 504 1,973 2,703 2,355 3,046 2,590 2,792 2,326 2,293 2,276 18.4% -5.7%% Y/Y -17.0% 21.0% -16.6% -42.8% -1.5% 29.1% 35.6% 131.1% 27.4% 37.0% -12.9% 29.3% -15.0% 7.8% -16.7% -1.4% -0.7%% Margin 33.4% 32.3% 26.7% 15.2% 33.1% 34.5% 30.4% 27.3% 26.8% 28.6% 28.1% 31.6% 28.2% 28.9% 25.8% 25.3% 24.9%
Consumer EBIT 642 367 362 373 617 354 376 418 1,884 1,965 1,744 1,765 1,721 1,837 1,825 1,849 1,841 4.6% 0.8%% Y/Y -25.3% 2.8% 11.7% -12.0% -3.9% -3.5% 3.9% 12.0% 28.0% 4.3% -11.2% 1.2% -2.5% 6.7% -0.6% 1.4% -0.4%% Margin 43.5% 34.7% 33.4% 30.7% 42.6% 32.9% 34.4% 33.4% 33.2% 35.5% 36.1% 36.2% 35.5% 36.7% 36.4% 36.4% 35.9%
Source: Company data, Credit Suisse estimates.
10 July 2018
The Walt Disney Company (DIS) 19
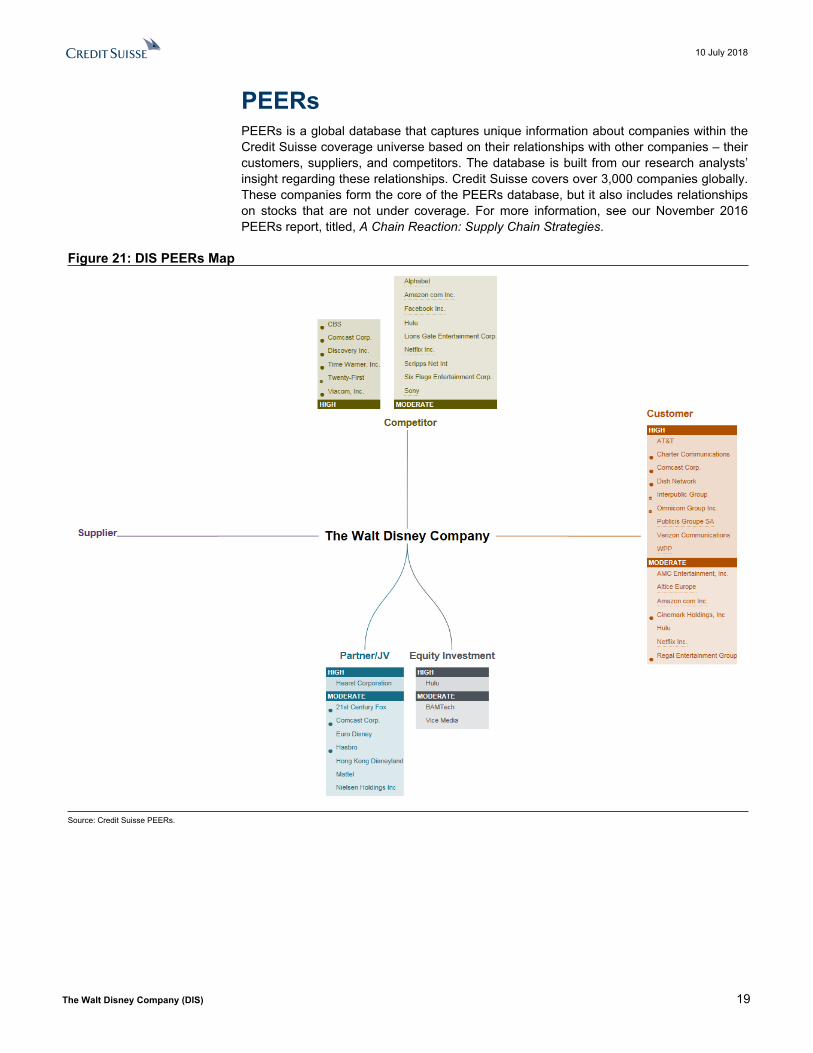
PEERsPEERs is a global database that captures unique information about companies within the Credit Suisse coverage universe based on their relationships with other companies – their customers, suppliers, and competitors. The database is built from our research analysts’ insight regarding these relationships. Credit Suisse covers over 3,000 companies globally. These companies form the core of the PEERs database, but it also includes relationships on stocks that are not under coverage. For more information, see our November 2016 PEERs report, titled, A Chain Reaction: Supply Chain Strategies.
Figure 21: DIS PEERs Map
Source: Credit Suisse PEERs.
10 July 2018
The Walt Disney Company (DIS) 20
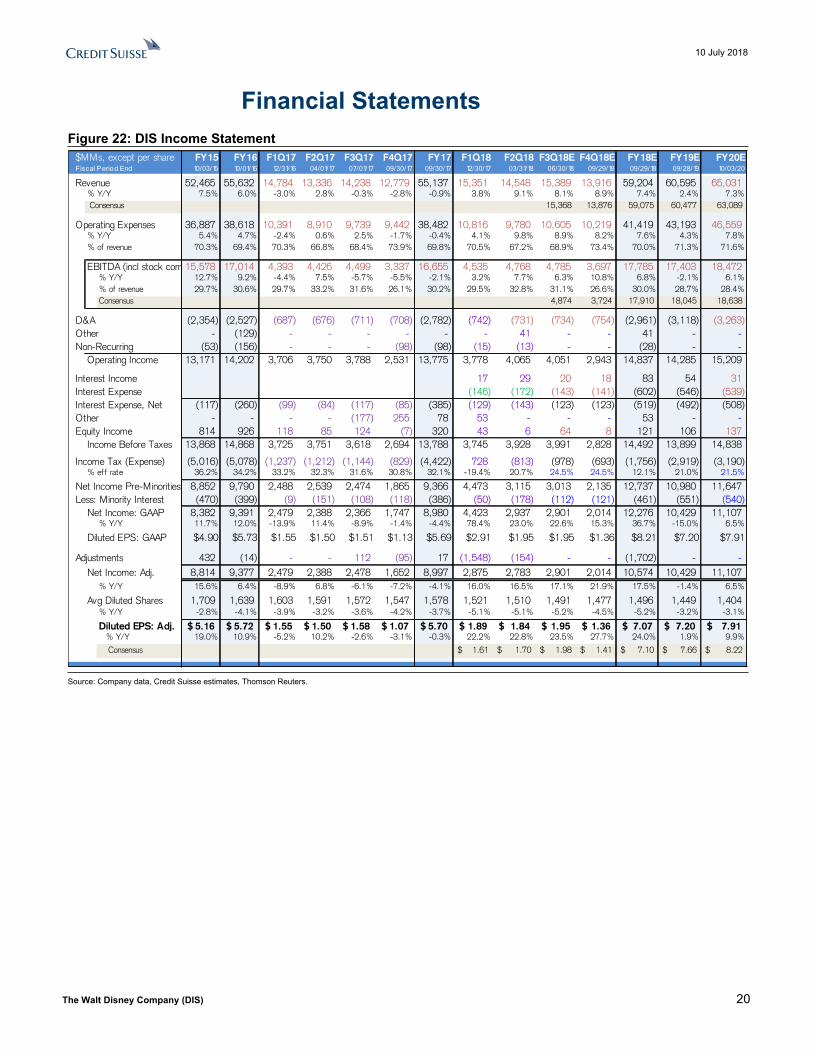
Financial StatementsFigure 22: DIS Income Statement
$MMs, except per share FY15 FY16 F1Q17 F2Q17 F3Q17 F4Q17 FY17 F1Q18 F2Q18 F3Q18E F4Q18E FY18E FY19E FY20EFiscal Period End 10/03/15 10/01/16 12/31/16 04/01/17 07/01/17 09/30/17 09/30/17 12/30/17 03/31/18 06/30/18 09/29/18 09/29/18 09/28/19 10/03/20
Revenue 52,465 55,632 14,784 13,336 14,238 12,779 55,137 15,351 14,548 15,389 13,916 59,204 60,595 65,031% Y/Y 7.5% 6.0% -3.0% 2.8% -0.3% -2.8% -0.9% 3.8% 9.1% 8.1% 8.9% 7.4% 2.4% 7.3%Consensus 15,368 13,876 59,075 60,477 63,089
Operating Expenses 36,887 38,618 10,391 8,910 9,739 9,442 38,482 10,816 9,780 10,605 10,219 41,419 43,193 46,559% Y/Y 5.4% 4.7% -2.4% 0.6% 2.5% -1.7% -0.4% 4.1% 9.8% 8.9% 8.2% 7.6% 4.3% 7.8%% of revenue 70.3% 69.4% 70.3% 66.8% 68.4% 73.9% 69.8% 70.5% 67.2% 68.9% 73.4% 70.0% 71.3% 71.6%
EBITDA (incl stock comp)15,578 17,014 4,393 4,426 4,499 3,337 16,655 4,535 4,768 4,785 3,697 17,785 17,403 18,472% Y/Y 12.7% 9.2% -4.4% 7.5% -5.7% -5.5% -2.1% 3.2% 7.7% 6.3% 10.8% 6.8% -2.1% 6.1%% of revenue 29.7% 30.6% 29.7% 33.2% 31.6% 26.1% 30.2% 29.5% 32.8% 31.1% 26.6% 30.0% 28.7% 28.4%Consensus 4,874 3,724 17,910 18,045 18,638
D&A (2,354) (2,527) (687) (676) (711) (708) (2,782) (742) (731) (734) (754) (2,961) (3,118) (3,263)Other - (129) - - - - - - 41 - - 41 - -Non-Recurring (53) (156) - - - (98) (98) (15) (13) - - (28) - -
Operating Income 13,171 14,202 3,706 3,750 3,788 2,531 13,775 3,778 4,065 4,051 2,943 14,837 14,285 15,209
Interest Income 17 29 20 18 83 54 31Interest Expense (146) (172) (143) (141) (602) (546) (539)Interest Expense, Net (117) (260) (99) (84) (117) (85) (385) (129) (143) (123) (123) (519) (492) (508)Other - - - - (177) 255 78 53 - - - 53 - -Equity Income 814 926 118 85 124 (7) 320 43 6 64 8 121 106 137
Income Before Taxes 13,868 14,868 3,725 3,751 3,618 2,694 13,788 3,745 3,928 3,991 2,828 14,492 13,899 14,838
Income Tax (Expense) (5,016) (5,078) (1,237) (1,212) (1,144) (829) (4,422) 728 (813) (978) (693) (1,756) (2,919) (3,190)% eff rate 36.2% 34.2% 33.2% 32.3% 31.6% 30.8% 32.1% -19.4% 20.7% 24.5% 24.5% 12.1% 21.0% 21.5%
Net Income Pre-Minorities 8,852 9,790 2,488 2,539 2,474 1,865 9,366 4,473 3,115 3,013 2,135 12,737 10,980 11,647Less: Minority Interest (470) (399) (9) (151) (108) (118) (386) (50) (178) (112) (121) (461) (551) (540)
Net Income: GAAP 8,382 9,391 2,479 2,388 2,366 1,747 8,980 4,423 2,937 2,901 2,014 12,276 10,429 11,107% Y/Y 11.7% 12.0% -13.9% 11.4% -8.9% -1.4% -4.4% 78.4% 23.0% 22.6% 15.3% 36.7% -15.0% 6.5%
Diluted EPS: GAAP $4.90 $5.73 $1.55 $1.50 $1.51 $1.13 $5.69 $2.91 $1.95 $1.95 $1.36 $8.21 $7.20 $7.91
Adjustments 432 (14) - - 112 (95) 17 (1,548) (154) - - (1,702) - -Net Income: Adj. 8,814 9,377 2,479 2,388 2,478 1,652 8,997 2,875 2,783 2,901 2,014 10,574 10,429 11,107
% Y/Y 15.6% 6.4% -8.9% 6.8% -6.1% -7.2% -4.1% 16.0% 16.5% 17.1% 21.9% 17.5% -1.4% 6.5%
Avg Diluted Shares 1,709 1,639 1,603 1,591 1,572 1,547 1,578 1,521 1,510 1,491 1,477 1,496 1,449 1,404% Y/Y -2.8% -4.1% -3.9% -3.2% -3.6% -4.2% -3.7% -5.1% -5.1% -5.2% -4.5% -5.2% -3.2% -3.1%
Diluted EPS: Adj. 5.16$ 5.72$ 1.55$ 1.50$ 1.58$ 1.07$ 5.70$ 1.89$ 1.84$ 1.95$ 1.36$ 7.07$ 7.20$ 7.91$ % Y/Y 19.0% 10.9% -5.2% 10.2% -2.6% -3.1% -0.3% 22.2% 22.8% 23.5% 27.7% 24.0% 1.9% 9.9%
Consensus 1.61$ 1.70$ 1.98$ 1.41$ 7.10$ 7.66$ 8.22$
Source: Company data, Credit Suisse estimates, Thomson Reuters.

10 July 2018
The Walt Disney Company (DIS) 21
Figure 23: DIS Balance Sheet$MMs FY15 FY16 F1Q17 F2Q17 F3Q17 F4Q17 FY17 F1Q18 F2Q18 F3Q18E F4Q18E FY18E FY19E FY20EFiscal Period Ending 10/03/15 10/01/16 12/31/16 04/01/17 07/01/17 09/30/17 09/30/17 12/30/17 03/31/18 06/30/18 09/29/18 09/29/18 09/28/19 10/03/20
Cash & Equivalents 4,269 4,610 3,736 3,800 4,336 4,017 4,017 4,677 4,179 4,741 3,364 3,364 1,329 1,539Receivables 8,019 9,065 9,878 9,293 9,636 8,633 8,633 9,886 9,678 10,259 9,277 9,277 9,845 10,690Inventory 1,571 1,390 1,299 1,304 1,300 1,373 1,373 1,307 1,301 1,231 1,392 1,392 1,477 1,626Television costs and advances 1,170 1,208 821 1,133 1,214 1,278 1,278 846 1,114 1,170 1,392 1,392 1,477 1,496Deferred income taxes 767 0 0 0 0 0 0 0 0.0 0.0 0.0 0 0 0Other Current Assets 962 693 931 740 665 588 588 558 536 616 668 668 709 715Current Assets 16,758 16,966 16,665 16,270 17,151 15,889 15,889 17,274 16,808 18,016 16,092 16,092 14,837 16,066
Film and television costs 6,183 6,339 6,572 6,974 6,798 7,481 7,481 7,937 8,074 8,618 8,350 8,350 8,860 9,755Investments 2,643 4,280 4,220 4,155 4,141 3,202 3,202 3,206 3,148 3,148 3,148 3,148 3,148 3,148PP&E 25,179 27,349 27,054 27,399 27,733 28,406 28,406 28,584 29,200 29,699 30,423 30,423 32,894 34,076Goodwill 27,826 27,810 27,793 27,831 27,835 31,426 31,426 31,430 31,350 31,350 31,350 31,350 31,350 31,350Intangible assets, net 7,172 6,949 6,892 6,845 6,797 6,995 6,995 6,930 6,962 6,898 6,832 6,832 6,561 6,276Other Assets 2,421 2,340 2,380 2,333 2,297 2,390 2,390 2,373 2,401 2,401 2,401 2,401 2,401 2,401Total Assets 88,182 92,033 91,576 91,807 92,752 95,789 95,789 97,734 97,943 100,131 98,596 98,596 100,050 103,072
Accounts payable & other 7,844 9,130 9,979 8,077 9,374 8,855 8,855 9,574 9,022 9,756 9,401 9,401 10,011 10,747Defered revenue 3,927 4,025 3,640 4,423 4,382 4,568 4,568 4,292 4,788 4,666 4,496 4,496 4,788 5,140Current portion of borrowings 4,563 3,687 5,698 4,865 3,338 6,172 6,172 6,009 5,918 - - - - -Current Liabilities 16,334 16,842 19,317 17,365 17,094 19,595 19,595 19,875 19,728 14,422 13,897 13,897 14,799 15,887
Borrowings 12,773 16,483 14,792 16,788 18,849 19,119 19,119 20,082 18,766 24,684 24,184 24,184 22,434 21,434Deferred Income Taxes 4,051 3,679 3,888 4,006 4,177 4,480 4,480 2,826 2,949 2,929 2,915 2,915 2,433 1,993Other Long-term Liabilities 6,369 7,706 6,402 6,381 6,581 6,443 6,443 6,726 6,699 6,699 6,699 6,699 6,699 6,699Redeemable noncontrollings 0 0 0 0 0 1,148 1,148 1,142 1,150 1,150 1,150 1,150 1,150 1,150
Common Stock 35,122 35,859 35,906 36,100 36,119 36,248 36,248 36,254 36,411 36,491 36,571 36,571 36,985 37,401Retained Earnings 59,028 66,088 67,327 69,708 70,863 72,606 72,606 75,763 78,704 81,720 82,644 82,644 91,015 99,971AOCI (2,421) (3,979) (3,855) (3,880) (3,864) (3,528) (3,528) (3,404) (3,345) (3,345) (3,345) (3,345) (3,345) (3,345)Treasury Stock (47,204) (54,703) (56,168) (58,144) (60,587) (64,011) (64,011) (65,324) (66,619) (68,119) (69,619) (69,619) (75,619) (81,619)Disney Shareholders' Equity 44,525 43,265 43,210 43,784 42,531 41,315 41,315 43,289 45,151 46,747 46,251 46,251 49,036 52,409Noncontrolling interests 4,130 4,058 3,967 3,483 3,520 3,689 3,689 3,794 3,500 3,500 3,500 3,500 3,500 3,500Total Equity 48,655 47,323 47,177 47,267 46,051 45,004 45,004 47,083 48,651 50,247 49,751 49,751 52,536 55,909
Total Liabilities & Equity 88,182 92,033 91,576 91,807 92,752 95,789 95,789 97,734 97,943 100,131 98,596 98,596 100,050 103,072
Source: Company data, Credit Suisse estimates.

10 July 2018
The Walt Disney Company (DIS) 22
Figure 24: DIS Cash Flow Statement$MMs, except per share FY15 FY16 F1Q17 F2Q17 F3Q17 F4Q17 FY17 F1Q18 F2Q18 F3Q18E F4Q18E FY18E FY19E FY20EFiscal Period Ending 10/03/15 10/01/16 12/31/16 04/01/17 07/01/17 09/30/17 09/30/17 12/30/17 03/31/18 06/30/18 09/29/18 09/29/18 09/28/19 10/03/20
Net Income 8,852 9,790 2,488 2,539 2,474 1,865 9,366 4,473 3,115 3,016 2,137 12,741 10,885 11,514D&A 2,354 2,527 687 676 711 708 2,782 742 731 734 754 2,961 3,118 3,263Gains on acquisitions and sales of investments(91) (26) 0 0 0 (289) (289) - - - - - - -Deferred Tax (102) 1,214 (76) 202 168 40 334 (1,726) 103 (20) (14) (1,657) (482) (440)Equity income / loss / cash distributions (62) (127) 85 109 63 211 468 127 213 - - 340 - -Net change in film and television costs and advances(922) (101) 440 (868) (317) (330) (1,075) 34 (524) (600) 46 (1,043) (596) (913)Equity-based compensation 410 393 97 92 89 86 364 94 100 80 80 354 320 320Other 341 674 187 74 112 130 503 139 16 - - 155 - -Working Capital 129 (1,208) (2,648) 614 833 1,091 (110) (1,646) 772 21 244 (609) 208 87Cash from Operations 10,909 13,136 1,260 3,438 4,133 3,512 12,343 2,237 4,526 3,231 3,248 13,242 13,453 13,831
CapEx (4,265) (4,773) (1,040) (883) (805) (895) (3,623) (981) (1,063) (1,169) (1,412) (4,626) (5,317) (4,161)M&A 166 (850) 0 (557) 0 140 (417) - (1,581) - - (1,581) - -Other (146) (135) 5 85 (95) (66) (71) (62) (118) - - (180) - -Cash from Investing (4,245) (5,758) (1,035) (1,355) (900) (821) (4,111) (1,043) (2,762) (1,169) (1,412) (6,387) (5,317) (4,161)
CapEx consensus 1,210 1,128 1,177 1,232 4,412 4,291 4,213
Debt Raise (Paydown) 2,705 2,940 580 1,154 471 1,498 3,703 835 235 0 (500) 570 (1,750) (1,000)Dividends (3,063) (2,313) - (1,237) 0 (1,208) (2,445) 0 (1,266) 0 (1,213) (2,479) (2,514) (2,557)Stock Buybacks (6,095) (7,499) (1,465) (2,035) (2,444) (3,424) (9,368) (1,313) (1,295) (1,500) (1,500) (5,608) (6,000) (6,000)Stock Option Proceeds 329 259 65 121 70 20 276 50 41 - - 91 94 97Contributions from noncontrolling interest holders1,012 0 0 0 0 17 17 - - - - - - -Other (402) (607) (167) (65) (840) (70) (1,142) (156) (13) - - (169) - -Cash from Financing (5,514) (7,220) (987) (2,062) (2,743) (3,167) (8,959) (584) (2,298) (1,500) (3,213) (7,595) (10,170) (9,461)
Impact of FX 154 (123) (112) 43 46 54 31 21 34 - - 55 - -
Cash, Begin 3,421 4,725 4,760 3,886 3,950 4,486 4,760 4,064 4,695 4,195 4,757 4,064 3,380 1,345
Change in Cash 1,304 35 (874) 64 536 (422) (696) 631 (500) 562 (1,377) (684) (2,034) 209
Cash, End 4,725 4,760 3,886 3,950 4,486 4,064 4,064 4,695 4,195 4,757 3,380 3,380 1,345 1,555
Restricted Cash (456) (150) (150) (150) (150) (47) (47) (18) (16) (16) (16) (16) (16) (16)
Cash on Balance Sheet 4,269 4,610 3,736 3,800 4,336 4,017 4,017 4,677 4,179 4,741 3,364 3,364 1,329 1,539
Free Cash FlowCash From Operations 10,909 13,136 1,260 3,438 4,133 3,512 12,343 2,237 4,526 3,231 3,248 13,242 13,453 13,831CapEx (4,265) (4,773) (1,040) (883) (805) (895) (3,623) (981) (1,063) (1,169) (1,412) (4,626) (5,317) (4,161)Free Cash Flow 6,644 8,363 220 2,555 3,328 2,617 8,720 1,256 3,463 2,062 1,836 8,616 8,136 9,670
% Y/Y 2.7% 25.9% -79.0% 7.4% 33.4% 7.3% 4.3% 470.9% 35.5% -38.0% -29.9% -1.2% -5.6% 18.8%
Consensus 1,929 2,894 3,517 2,356 10,654 10,933 10,903
FCF per shr $3.89 $5.10 $0.14 $1.61 $2.12 $1.69 $5.53 $0.83 $2.29 $1.38 $1.24 $5.76 $5.62 $6.89% Y/Y 5.7% 31.2% -78.2% 10.9% 38.4% 12.0% 8.3% 501.7% 42.8% -34.7% -26.6% 4.2% -2.5% 22.7%
Source: Company data, Credit Suisse estimates, Thomson Reuters.

10 July 2018
The Walt Disney Company (DIS) 23
AppendixFigure 25: Walt Disney—Direct-to-Consumer Programming Spend Analysis
53rd Wk 5-Year($MMs) FY16 FY17 FY18E FY19E FY20E FY21E FY22E FY23E CAGR
Disney DTC Programming ExpenseForgone Third Party Licensing Revenue
Broadcast Licensing - - - - - - -Cable Networks, Non-Sports (183) (282) (370) (466) (573) (660) (751)Film TV Licensing - - - (350) (550) (750) (950)
Disney Total (183) (282) (370) (816) (1,123) (1,410) (1,701)Y/Y $ Chg (183) (99) (88) (446) (307) (287) (292)
DTC Purchases of Internal ContentBroadcast Licensing - - - - - - -Cable Networks, Non-Sports - - - 466 573 660 751Film TV Licensing - - - 350 550 750 950
Disney DTC Total - - - 816 1,123 1,410 1,701Y/Y $ Chg - - - 816 307 287 292
Net Impact on Disney Segment TV RevenueBroadcast Licensing - - - - - - - -Cable Networks, Non-Sports - (183) (282) (370) - - - -Film TV Licensing - - - - - - - -Intercompany Eliminations - - - - (816) (1,123) (1,410) (1,701)
Disney Total - (183) (282) (370) (816) (1,123) (1,410) (1,701)
Disney DTC Original ProgrammingTV Shows 5 7 9 12 16Cost per Season 20 20 20 20 20
TV Show Production 98 137 176 234 312Films 4 6 9 13 18Cost per Film 20 20 20 20 20
Film Production 80 120 180 260 360Total Originals 178 257 356 494 672
Disney DTC Program Exp. - - - 178 1,072 1,478 1,904 2,373Y/Y $ Chg - - 178 895 406 426 470
Source: Company data, Credit Suisse estimates.

10 July 2018
The Walt Disney Company (DIS) 24
Figure 26: Walt Disney—Direct to Consumer Model Impact53rd Wk 5-Year
($MMs) FY16 FY17 FY18E FY19E FY20E FY21E FY22E FY23E CAGR
Walt Disney TV Licensing Revenue ImpactTV Licensing Revenue
Broadcast Licensing 2,129 2,105 2,239 2,239 2,239 2,239 2,239 2,239 0%Y/Y $ Chg (24) 134 - - - - -
Cable Networks, Non-Sports 729 567 522 454 772 795 811 819 9%Y/Y $ Chg (161) (45) (68) 318 23 16 8
Film TV Licensing 3,661 3,678 3,768 3,957 4,088 4,118 4,235 4,352 3%Y/Y $ Chg 17 90 189 131 30 117 117
Total Disney 6,519 6,351 6,530 6,650 7,099 7,152 7,285 7,410 2.6%Y/Y $ Chg (168) 179 121 449 53 133 125
Intercompany Licensing - - - - (816) (1,123) (1,410) (1,701)Consolidated Disney 6,519 6,351 6,530 6,650 6,284 6,030 5,875 5,709 -2.7%
Y/Y $ Chg (168) 179 121 (367) (254) (154) (166)
Total Walt Disney Programming Spending Broadcast 4,308 4,231 4,443 4,487 4,622 4,622 4,668 4,715 1%
Y/Y $ Chg (77) 212 44 135 - 46 47
% of Broadcast Revenue 61% 61% 62% 62% 62% 63% 63% 62%
Programming Exp Net of Licensing 2,179 2,126 2,204 2,248 2,383 2,383 2,429 2,476 2%
% of Non-Licensing Revenue 44% 44% 45% 45% 46% 46% 47% 46%
Cable Networks, Non-Sports 2,173 2,034 2,298 2,733 3,851 4,433 5,037 5,687 20%Y/Y $ Chg (139) 263 435 1,118 582 604 650
% of Cable non-ESPN Revenue 54% 53% 59% 70% 87% 99% 109% 120%
Programming Exp Net of Licensing 1,445 1,467 1,776 2,279 3,079 3,638 4,226 4,868 22%
% of Non-Licensing Revenue 44% 45% 53% 66% 85% 99% 111% 124%
Film 2,623 2,474 2,763 2,725 2,889 2,745 2,827 2,912 1%Y/Y $ Chg (149) 289 (38) 164 (144) 82 85
Programming Exp Net of Licensing (1,038) (1,204) (1,005) (1,232) (1,199) (1,373) (1,408) (1,440) 7%
Total Disney Entertainment 9,104 8,739 9,504 9,946 11,362 11,800 12,532 13,314 7.0%Y/Y $ Chg (365) 765 442 1,416 437 732 782
ESPN 5,882 6,657 6,833 7,413 8,058 7,947 8,594 9,003 5.7%Y/Y $ Chg 775 177 580 644 (111) 648 408
% of ESPN Revenue 47% 52% 53% 53% 58% 55% 60% 61%
Total Traditional 14,986 15,396 16,337 17,359 19,420 19,746 21,126 22,316 6.4%Y/Y $ Chg 410 941 1,022 2,061 326 1,380 1,190
Disney DTC - - - 178 1,072 1,478 1,904 2,373Y/Y $ Chg - - 178 895 406 426 470
Intercompany Eliminations - - - - (816) (1,123) (1,410) (1,701)Total Walt Disney 14,986 15,396 16,337 17,537 19,676 20,102 21,620 22,988 7.1%
Y/Y $ Chg 410 941 1,199 2,140 425 1,519 1,368
Source: Company data, Credit Suisse estimates.
10 July 2018
The Walt Disney Company (DIS) 25
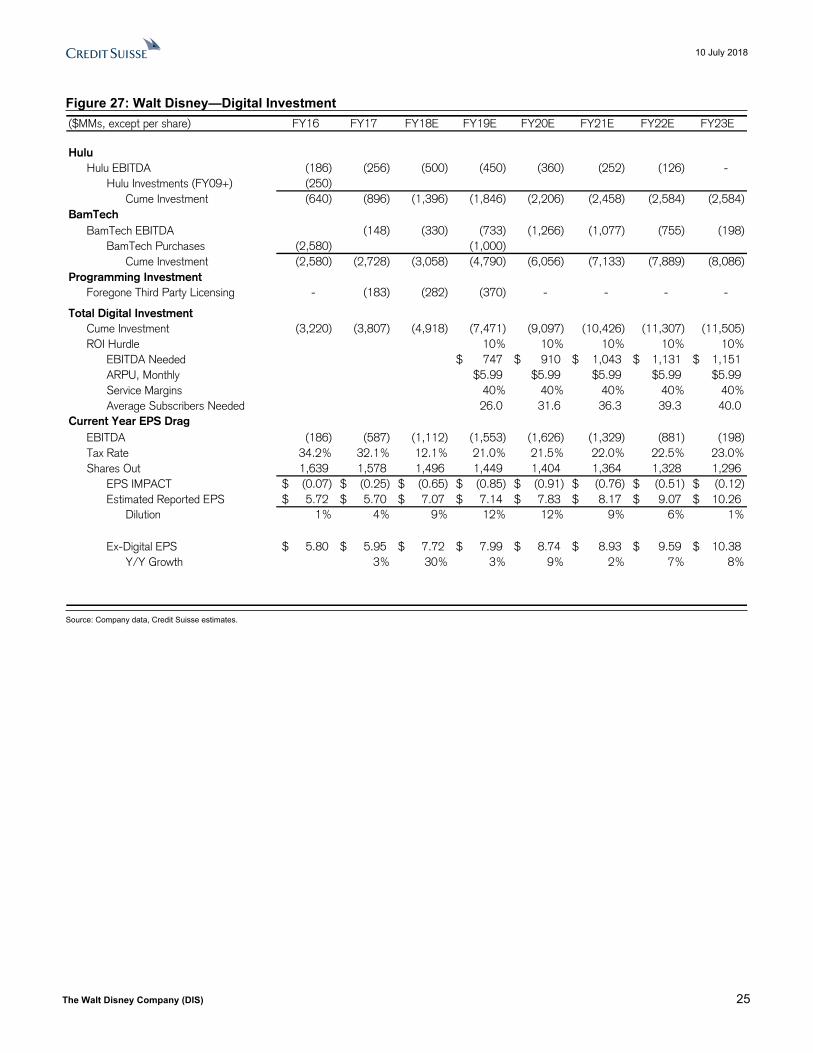
Figure 27: Walt Disney—Digital Investment($MMs, except per share) FY16 FY17 FY18E FY19E FY20E FY21E FY22E FY23E
Hulu Hulu EBITDA (186) (256) (500) (450) (360) (252) (126) -
Hulu Investments (FY09+) (250)Cume Investment (640) (896) (1,396) (1,846) (2,206) (2,458) (2,584) (2,584)
BamTechBamTech EBITDA (148) (330) (733) (1,266) (1,077) (755) (198)
BamTech Purchases (2,580) (1,000)Cume Investment (2,580) (2,728) (3,058) (4,790) (6,056) (7,133) (7,889) (8,086)
Programming InvestmentForegone Third Party Licensing - (183) (282) (370) - - - -
Total Digital InvestmentCume Investment (3,220) (3,807) (4,918) (7,471) (9,097) (10,426) (11,307) (11,505)ROI Hurdle 10% 10% 10% 10% 10%
EBITDA Needed 747$ 910$ 1,043$ 1,131$ 1,151$ ARPU, Monthly $5.99 $5.99 $5.99 $5.99 $5.99Service Margins 40% 40% 40% 40% 40%Average Subscribers Needed 26.0 31.6 36.3 39.3 40.0
Current Year EPS DragEBITDA (186) (587) (1,112) (1,553) (1,626) (1,329) (881) (198)Tax Rate 34.2% 32.1% 12.1% 21.0% 21.5% 22.0% 22.5% 23.0%Shares Out 1,639 1,578 1,496 1,449 1,404 1,364 1,328 1,296
EPS IMPACT (0.07)$ (0.25)$ (0.65)$ (0.85)$ (0.91)$ (0.76)$ (0.51)$ (0.12)$ Estimated Reported EPS 5.72$ 5.70$ 7.07$ 7.14$ 7.83$ 8.17$ 9.07$ 10.26$
Dilution 1% 4% 9% 12% 12% 9% 6% 1%
Ex-Digital EPS 5.80$ 5.95$ 7.72$ 7.99$ 8.74$ 8.93$ 9.59$ 10.38$ Y/Y Growth 3% 30% 3% 9% 2% 7% 8%
Source: Company data, Credit Suisse estimates.

10 July 2018
The Walt D
isney Com
pany (DIS)
26
Figure 28: Disney’s Film Studio Is Having Unprecedented Success at the Box Office in FY18
FY18 Title WW Box
Est. FY19 Title WW Box
Est. FY20 WW Box
Est.
11/03/17 Thor: Ragnarok 854$ 11/02/18 Mulan (Live Action) 600$ 11/08/19 Noelle 150$ 11/22/17 Coco 806$ 11/02/18 The Nutcracker and the Four Realms 150$ 11/27/19 Frozen 2 950$ 12/15/17 Star Wars: The Last Jedi 1,333$ 11/21/18 Ralph Breaks the Internet: Wreck-It Ralph 2 500$ 12/20/19 Star Wars: Episode IX 1,200$ 02/16/18 Black Panther 1,346$ 12/25/18 Mary Poppins Returns 550$ 03/13/20 Untitled Pixar Animation (March 2020) 600$ 03/09/18 A Wrinkle in Time 133$ 03/08/19 Captain Marvel 900$ 04/03/20 Untitled Disney Live Action (2020) 600$ 05/04/18 Avengers: Infinity War 2,032$ 03/29/19 Dumbo (2019) 800$ 05/01/20 Untitled Marvel Movie (May 2020) 800$ 05/25/18 Solo: A Star Wars Story (3D) 360$ 04/12/19 Untitled Disneytoon Movie (2019) 100$ 06/19/20 Untitled Pixar Animation (June 2020) 600$ 06/15/18 The Incredibles 2 825$ 05/03/19 Untitled Avengers 1,800$ 07/10/20 Untitled Indiana Jones (2019) 650$ 07/06/18 Ant-Man and the Wasp 700$ 05/24/19 Aladdin (2019) 500$ 08/07/20 Untitled Marvel Movie (July 2020) 800$ 08/03/18 Untitled Christopher Robin Project 125$ 06/21/19 Toy Story 4 1,000$ 6,350$
8,513$ 07/19/19 The Lion King (Live Action) 800$ 08/09/19 Artemis Fowl 150$
7,850$
Source: Credit Suisse, Company Reports, Box Office Mojo (http://www.boxofficemojo.com).

10 July 2018
The Walt D
isney Com
pany (DIS)
27
Figure 29: Disney Is Investing over $12b to Aggressively Build Out Its Global Theme Parks over the Coming Five YearsLaunch US or Years to Cost
Date Type Capex Project Int'l Resort Park Complete Acres $MM Details
2008-2012 Park Expansion Disney California Adventure Expansion US DL DCA 1-5 1,10006/17/08 DCA Expansion Phase 1 1 125 Toy Story Midway Mania05/04/09 DCA Expansion Phase 2 2 25 Mickeys Fun Wheel06/11/10 DCA Expansion Phase 3 3 75 World of Color06/03/11 DCA Expansion Phase 4 4 175 Ariels Undersea Adventure & Goofy's Sky School06/15/12 DCA Expansion Phase 5 5 12 700 Buena Vista Street & Cars Land11/21/09 Attraction Update Space Mountain Rehab US WDW MK 1 N/A 12 update to space mountain: replacement track, ceiling treatment, interactive queue01/26/11 Cruise Ship Disney Dream Cruise Ship 3 US DCL N/A 4 N/A 1,000 130k gross tons, 4k passenger capacity08/29/11 Hotel Aulani Hawaii Resort US DVC 2 80003/31/12 Cruise Ship Disney Fantasy Cruise Ship 4 US DCL N/A 5 N/A 1,000 130k gross tons, 4k passenger capacity05/31/12 Hotel Art of Animation Hotel US WDW 2 700 1984 new rooms - 1120 family suites and 864 themed rooms
2012-2014 Park Expansion New Fantasyland US WDW MK 3-5 26 600 Expansion opened in 3 phases 2012-201403/12/12 Fantasyland Expansion Phase 1 2 175 Barnstormer, Train Station, Dumbo ride, Storybook Circus queue, Soak n Splash station12/06/12 Fantasyland Expansion Phase 2 3 175 Be Our Guest Restaurant, Little Mermaid ride, Tangled rest area03/28/14 Fantasyland Expansion Phase 3 5 250 Princess Fairytale Hall, 7 Dwarfs Mine Train, Peter Pan interactive queue06/30/13 Technology Update MyMagic+ US WDW N/A 114 1,000 customizable wristbands for tickets, room key and payment07/10/14 Attraction Ratatouille Ride Int'l Paris 1 27006/21/16 Attraction Frozen Ever After US WDW Epcot 2 200 renovated the maelstrom boat ride in Norway06/26/16 Theme Park & Resort Shanghai Disneyland Int'l Shanghai 117 963 6,00005/27/17 Themed Land Pandora: World of Avatar US WDW AK 6 12 50005/27/17 Attraction Guardians of the Galaxy: Mission Breakout US DL DCA 1 N/A 150 renovated the tower of terror ride04/28/18 Themed Land Toy Story Land Int'l ShanghaiSDL 2 8 70006/23/18 Themed Land Pixar Pier US DL DCA 1 N/A 500 Incredicoaster, other Pixar themed updates to Paradise Pier06/30/18 Themed Land Toy Story Land US WDW HS 3 11 850 opened in stages, final stage in 2018
Summer 2019 Themed Land Star Wars: Galaxy Edge US DL DCA 4 14 1,000 largest themed land expansions ever at 14 acres eachLate Fall 2019 Themed Land Star Wars: Galaxy Edge US WDW HS 4 14 1,000 two major attractions and dining and immersive areas
Fall 2019 Hotel Disney Riviera Resort US WDW N/A 2 250 300 room DVC resort on new gondola system2020 Themed Land Super Hero-themed Land US DL DCA 6
by 2021 Park Expansion Epcot Makeover US WDW Epcot 3-4 2,000 Guardians of the Galaxy ride, update to Mission Space, Ratatouille ride, restaurantby 2021 Park Expansion Magic Kingdom Update US WDW 3-4 1,000 Tron ride, Star Wars Hotelby 2021 Attraction Mickey and Minnie's Runaway Railway US WDW HS 3-4 200 Replaces The Great Movie Ride, first Mickey themed rideby 2021 Attraction Skyliner Gondola System US WDW N/A 3-4 200 Connects WDW resorts with Epcot and Hollywood Studios
2021 Hotel New Luxury Hotel US DL 6 4 diamond luxury resort; 700 roomsFY21 Cruise Ship Cruise Ship 5 US DCL N/A 5 N/A 1,405 140k gross tonsFY22 Cruise Ship Cruise Ship 6 US DCL N/A 6 N/A 1,405 140k gross tonsFY23 Cruise Ship Cruise Ship 7 US DCL N/A 6 N/A 1,405 140k gross tons
2021-2023 Park Expansion Paris Expansion Int'l Paris WDS 3-5 TBD 2,500 Star Wars Land, Marvel Land and Frozen Land and Lake to connect the landsPhase 1 -Phase 2 -Phase 3 -
TOTAL 27,748
Source: Credit Suisse, Company Reports.

10 July 2018
The Walt D
isney Com
pany (DIS)
28
Figure 30: Credit Suisse Cable Networks Ratings Dashboard—DisneyDisney Cable Nets
Demo 2015 2016 2017 1Q17 2Q17 3Q17 4Q17 1Q18 2Q QTD Jan'18 Feb '18 Mar '18 Apr '18 May '18 Apr 1 Apr 8 Apr 15 Apr 22 Apr 29 May 6 May 13 May 20 May 27 Jun 3
Average Commercial Audience (000s), Target DemoESPN P18-49 409 365 338 341 282 281 439 351 329 507 285 280 300 371 269 266 310 298 374 330 197 363 570 253FREEFORM P18-34 142 119 106 98 91 93 141 75 61 91 73 66 66 66 72 58 65 64 51 50 62 45 69 76ESPN2 P18-49 120 109 79 82 70 83 81 75 62 93 66 69 61 52 85 65 57 59 74 55 50 57 61 75DISNEY XD P12-17 43 40 27 32 27 27 22 20 21 23 20 19 18 18 25 22 16 18 17 17 17 18 21 31DISNEY CHANNEL P2-11 - - - - - - - - 268 - - - - - - - - - - - - - - 270DISNEY JUNIOR P2-11 - - - - - - - - 243 - - - - - - - - - - - - - - 246ESPNU P18-49 21 19 17 16 11 20 18 15 10 19 12 14 7 10 11 8 7 5 7 8 11 11 11 20
Average Commercial Audience (000s), Target Demo -- % Change Y/YESPN P18-49 -10% -11% -7% -7% -15% 0% -8% 3% 3% -12% 0% -3% -7% 19% -14% -6% 1% -7% -2% -9% -32% 9% 123% 19%FREEFORM P18-34 -15% -16% -11% -19% -15% -11% -1% -23% -26% -28% -23% -24% -20% -29% 1% -17% -19% -29% -52% -46% -17% -51% -38% -16%ESPN2 P18-49 3% -9% -28% -28% -40% -19% -22% -9% -19% -6% -12% -9% -22% -20% -6% -16% -10% -11% -24% -18% -19% -2% -13% 3%DISNEY XD P12-17 -17% -7% -33% -29% -36% -31% -37% -38% -19% -32% -41% -34% -25% -28% -7% -4% -27% -28% -23% -23% -26% -36% -25% -11%DISNEY CHANNEL P2-11 NM NM NM NM NM NM NM NM -24% NM NM NM NM NM NM NM NM NM NM NM NM NM NM NMDISNEY JUNIOR P2-11 NM NM NM NM NM NM NM NM 4% NM NM NM NM NM NM NM NM NM NM NM NM NM NM NMESPNU P18-49 -13% -10% -11% -6% -21% 0% -25% -6% -17% 6% -20% -13% -30% -9% -15% -20% -13% -38% -42% -11% 0% -27% 10% 0%
Average Commercial Audience (000s), Target Demo -- Δ CHANGEESPN P18-49 (47) (44) (27) (25) (48) 1 (38) 10 10 (71) - (8) (21) 60 (43) (16) 2 (22) (6) (32) (93) 29 314 40FREEFORM P18-34 (25) (23) (13) (23) (16) (12) (1) (23) (21) (36) (22) (21) (17) (27) 1 (12) (15) (26) (56) (43) (13) (46) (43) (15)ESPN2 P18-49 4 (11) (30) (32) (47) (19) (23) (7) (15) (6) (9) (7) (17) (13) (5) (12) (6) (7) (24) (12) (12) (1) (9) 2DISNEY XD P12-17 (9) (3) (13) (13) (15) (12) (13) (12) (5) (11) (14) (10) (6) (7) (2) (1) (6) (7) (5) (5) (6) (10) (7) (4)DISNEY CHANNEL P2-11 - - - - - - - - (86) - - - - - - - - - - - - - - 270DISNEY JUNIOR P2-11 - - - - - - - - 9 - - - - - - - - - - - - - - 246ESPNU P18-49 (3) (2) (2) (1) (3) - (6) (1) (2) 1 (3) (2) (3) (1) (2) (2) (1) (3) (5) (1) - (4) 1 -
Commercial Duration -- % Change Y/YESPN P18-49 5% 8% 0% 0% 1% -2% 1% 1% 1% -19% 2% 26% -19% 1% -1% -2% 2% 4% 2% -1% -2% 3% 4% 1%FREEFORM P18-34 4% 6% 1% 1% -2% 2% 3% 3% 3% -18% 4% 28% -17% 3% 0% 1% 2% 3% 10% 8% -3% 1% 7% 4%ESPN2 P18-49 3% 6% 1% -1% 0% 1% 2% 3% 10% -23% 3% 31% -11% 12% 9% 3% 9% 12% 9% 14% 17% 11% 7% 3%DISNEY XD P12-17 -1% -5% -8% -6% -7% -12% -9% -1% -5% -12% -6% 16% -26% -2% -6% -15% -8% -4% -6% -2% -3% -3% 0% -8%DISNEY CHANNEL P2-11 NM NM NM NM NM NM NM NM NM NM NM NM NM NM NM NM NM NM NM NM NM NM NM NMDISNEY JUNIOR P2-11 NM NM NM NM NM NM NM NM NM NM NM NM NM NM NM NM NM NM NM NM NM NM NM NMESPNU P18-49 3% 12% 4% 15% 10% -3% -3% -1% -16% -20% 1% 22% -36% -15% -8% -15% -26% -25% -14% -12% -20% -23% -4% 11%
Total 3% 5% 0% 1% 0% -2% -1% 1% -1% -19% 1% 25% -21% 1% -1% -5% -3% -1% 1% 2% -1% -1% 3% 2%
Viewing Time (Minutes in Billions)ESPN P18-49 39.7 38.3 35.5 9.0 7.3 7.1 12.1 9.4 6.2 4.2 2.4 2.9 2.5 3.1 0.5 0.5 0.6 0.6 0.8 0.7 0.4 0.8 1.2 0.5FREEFORM P18-34 12.4 11.0 9.9 2.2 2.1 2.3 3.4 1.7 1.0 0.6 0.5 0.6 0.5 0.5 0.1 0.1 0.1 0.1 0.1 0.1 0.1 0.1 0.1 0.1ESPN2 P18-49 9.8 9.5 6.9 1.7 1.5 1.8 1.9 1.6 1.0 0.6 0.5 0.6 0.5 0.4 0.1 0.1 0.1 0.1 0.1 0.1 0.1 0.1 0.1 0.1DISNEY XD P12-17 3.5 3.1 1.9 0.6 0.5 0.5 0.4 0.4 0.3 0.1 0.1 0.1 0.1 0.1 0.0 0.0 0.0 0.0 0.0 0.0 0.0 0.0 0.0 0.0DISNEY CHANNEL P2-11 0.0 0.0 0.0 0.0 0.0 0.0 0.0 0.0 0.0 0.0 0.0 0.0 0.0 0.0 0.0 0.0 0.0 0.0 0.0 0.0 0.0 0.0 0.0 0.0DISNEY JUNIOR P2-11 0.0 0.0 0.0 0.0 0.0 0.0 0.0 0.0 0.0 0.0 0.0 0.0 0.0 0.0 0.0 0.0 0.0 0.0 0.0 0.0 0.0 0.0 0.0 0.0ESPNU P18-49 1.4 1.5 1.4 0.3 0.2 0.4 0.4 0.3 0.1 0.1 0.1 0.1 0.0 0.0 0.0 0.0 0.0 0.0 0.0 0.0 0.0 0.0 0.0 0.0
Viewing Time (Minutes in Billions) -- % Change Y/YESPN P18-49 -5% -4% -7% -7% -13% -1% -7% 4% 4% -29% 2% 23% -24% 21% -15% -8% 2% -3% 0% -10% -33% 12% 132% 20%FREEFORM P18-34 -11% -11% -10% -18% -17% -10% 3% -21% -23% -41% -20% -3% -34% -27% 1% -16% -17% -26% -47% -42% -20% -50% -34% -13%ESPN2 P18-49 7% -3% -27% -29% -40% -18% -20% -6% -12% -28% -9% 19% -30% -10% 3% -13% -1% 0% -18% -7% -6% 9% -6% 6%DISNEY XD P12-17 -18% -11% -38% -33% -40% -39% -43% -38% -24% -40% -45% -24% -45% -30% -13% -19% -33% -31% -28% -25% -28% -38% -25% -18%DISNEY CHANNEL P2-11 NM NM NM NM NM NM NM NM NM NM NM NM NM NM NM NM NM NM NM NM NM NM NM NMDISNEY JUNIOR P2-11 NM NM NM NM NM NM NM NM NM NM NM NM NM NM NM NM NM NM NM NM NM NM NM NMESPNU P18-49 -10% 1% -7% 8% -13% -3% -27% -8% -30% -15% -20% 6% -56% -23% -22% -32% -36% -53% -50% -21% -20% -44% 6% 11%
REVENUE-WEIGHTED CHANGE -6% -5% -10% -11% -16% -5% -7% -1% -2% -31% -3% 17% -27% 9% -11% -10% -2% -8% -10% -15% -29% 0% 90% 12%
Nielsen Calendar Months Nielsen Calendar Weeks (M-Su 6a-6a)Standard Calendar Years Standard Calendar Quarters
Source: Nielsen NNTVn, SMI, Credit Suisse, 2Q QTD based on 4/1/18-6/3/18 vs 4/1/17-6/3/17; QTD and most recent two weeks are set to Live+SD ratings and as commercial ratings are reported on a two-week deal basis. Revenue-weighted change uses SMI revenue data; calculated as sum of Y/Y change * contribution to total advertising revenue for each network.

10 July 2018
The Walt Disney Company (DIS) 29
Figure 31: Credit Suisse Broadcast Ratings Dashboard
Demo 2015 2016 2017 1Q17 2Q17 3Q17 4Q17 1Q18 2Q QTD 1-Apr 8-Apr 15-Apr 22-Apr 29-Apr 6-May ##### ##### ##### 3-Jun
Average Commercial Audience (000s)ABC P18-49 983 924 803 878 859 663 816 816 823 859 768 887 799 824 840 768 702 634 1,177CBS P18-49 1,061 1,031 858 1,008 678 656 1,070 897 612 656 825 687 603 580 575 641 603 525 485FOX P18-49 2,057 1,920 1,864 2,766 829 1,106 2,509 1,441 714 743 654 803 717 818 762 786 742 795 417NBC P18-49 1,086 1,130 862 899 719 778 1,044 1,147 655 660 636 660 664 612 697 660 745 550 648CW P18-49 430 390 332 409 308 223 400 354 300 309 264 320 344 311 321 328 335 267 210
ION P18-49 241 269 244 264 241 237 235 276 270 272 272 260 257 263 249 267 278 263 305TEL P18-49 293 280 271 305 238 283 264 235 227 215 236 225 236 240 212 226 236 221 208UNI P18-49 472 394 359 412 348 346 334 348 294 284 309 295 298 314 293 287 312 268 286
Average Commercial Audience (000s) -- % Change Y/YABC P18-49 -7% -6% -13% -10% -16% -11% -14% -7% 1% 17% 0% 8% -2% 2% -1% -3% -7% -6% -3%CBS P18-49 -4% -3% -17% -25% -12% -17% -10% -11% -16% -41% -21% 0% -11% -14% -19% -11% -8% -13% -8%FOX P18-49 -17% -7% -3% 25% -18% -6% -15% -48% -9% -23% -27% -3% -12% -2% -21% -11% -23% -18% -51%NBC P18-49 -10% 4% -24% -12% -12% -44% -18% 28% -9% -10% -15% -3% -9% -17% -12% -15% 3% -18% -8%CW P18-49 -7% -9% -15% -15% -23% -16% -2% -13% -4% -30% -20% 14% 67% -24% -20% -20% -16% -28% -13%ION P18-49 0% 12% -9% -10% -12% -6% -9% 5% 10% 18% 14% 13% 10% 6% -2% 11% 15% -3% 22%TEL P18-49 3% -4% -3% 16% -9% 1% -17% -23% -2% -21% -12% -10% -12% -4% 4% 14% 9% 8% 1%UNI P18-49 -12% -17% -9% -5% -14% -4% -13% -16% -6% -21% -12% -13% -15% -13% -24% -20% -9% -29% -15%
Average Commercial Audience (000s) -- Δ CHANGEABC P18-49 (72) (59) (121) (98) (159) (86) (137) (62) 9 123 (2) 62 (13) 16 (5) (25) (50) (38) (32)CBS P18-49 (40) (30) (173) (331) (95) (132) (121) (111) (119) (465) (217) 3 (74) (93) (136) (79) (51) (81) (45)FOX P18-49 (415) (137) (56) 557 (185) (65) (433) (1,325) (74) (223) (247) (21) (101) (13) (205) (98) (218) (180) (427)NBC P18-49 (127) 44 (268) (127) (97) (613) (231) 248 (61) (77) (115) (21) (64) (124) (96) (118) 21 (123) (58)CW P18-49 (31) (40) (58) (74) (94) (41) (10) (55) (14) (135) (67) 40 138 (96) (78) (82) (65) (104) (32)ION P18-49 - 28 (25) (29) (33) (16) (22) 12 25 41 34 30 24 14 (4) 27 36 (8) 56TEL P18-49 9 (13) (9) 41 (24) 4 (55) (70) (5) (56) (33) (26) (33) (9) 8 27 20 17 2UNI P18-49 (62) (78) (35) (21) (56) (13) (49) (64) (20) (76) (43) (45) (52) (45) (92) (74) (30) (108) (52)
Commercial Duration (in Minutes) -- % Change Y/YABC 2% 1% 0% 0% -2% 2% 1% 0% 3% -6% 5% 2% 2% 5% 2% 1% 2% 1% 0%CBS 0% 2% 2% 1% 3% 2% 1% 0% 0% -7% -1% 0% -1% -1% 0% -1% 1% 2% 0%FOX 1% 4% 6% 5% 2% 8% 9% -2% -4% 5% -14% 14% 41% 5% -35% 2% 5% -17% -13%NBC 3% 3% 3% 2% 3% 3% 5% 7% 4% 5% 6% 3% 2% 5% 4% 7% 2% 4% 6%CW 11% 3% -4% -4% 0% 1% -15% -10% -15% -17% -13% -12% -13% -13% -13% -12% -12% -13% -12%ION 9% -2% 1% 5% 5% -2% -3% 3% 0% 3% 0% 0% 0% 1% 2% 1% -1% 2% 0%TEL 3% 5% 0% -5% -3% 6% 4% 12% -1% 9% 2% 2% 2% 4% 6% 2% -6% -5% -10%UNI 2% 9% 5% 3% 7% 9% 1% 16% 12% 16% 14% 15% 15% 13% 16% 11% 12% 16% -4%
Big 4 2% 2% 2% 1% 2% 3% 3% 2% 2% -2% 2% 2% 3% 3% -1% 2% 2% 1% 1%Other English Bcast 35% 52% 45% 82% 79% 24% 23% 25% 5% 3% 4% 5% 6% 6% 8% 5% 6% 4% 4%Spanish Bcast 10% 15% 3% 5% 3% 4% 0% 7% 6% 7% 6% 6% 6% 7% 7% 7% 4% 8% 2%
Commercial Viewing Time (Billions of Minutes)ABC P18-49 52.2 49.5 43.1 11.5 11.3 8.9 11.3 10.6 7.9 0.8 0.8 0.9 0.9 0.9 0.9 0.8 0.7 0.7 1.2CBS P18-49 64.3 64.0 54.2 16.2 10.4 10.1 17.4 14.4 6.6 0.7 1.0 0.8 0.7 0.7 0.7 0.7 0.7 0.6 0.6FOX P18-49 27.0 26.2 27.0 9.0 2.6 3.9 11.6 4.6 1.5 0.1 0.1 0.2 0.2 0.3 0.1 0.1 0.2 0.2 0.1NBC P18-49 60.8 65.2 51.5 13.0 10.5 11.7 16.2 17.8 7.0 0.8 0.8 0.8 0.8 0.7 0.8 0.8 0.9 0.7 0.8CW P18-49 5.4 5.1 4.1 1.3 1.0 0.7 1.1 1.0 0.6 0.1 0.1 0.1 0.1 0.1 0.1 0.1 0.1 0.1 0.0ION P18-49 23.3 25.4 23.4 6.2 6.0 5.7 5.5 6.8 4.7 0.5 0.5 0.5 0.5 0.5 0.5 0.5 0.5 0.5 0.6ESTRELLA P18-49 2.7 2.9 3.3 0.9 0.9 0.8 0.8 0.8 0.6 0.1 0.1 0.1 0.1 0.1 0.1 0.1 0.1 0.1 0.0TEL P18-49 14.4 14.4 14.0 3.6 3.2 4.0 3.3 3.1 2.1 0.2 0.2 0.2 0.2 0.2 0.2 0.2 0.2 0.2 0.2UNI P18-49 24.7 22.3 21.3 5.7 5.1 5.2 5.3 5.6 3.4 0.4 0.4 0.4 0.4 0.4 0.4 0.4 0.4 0.4 0.3
Big 4 204.3 204.9 175.7 49.8 34.8 34.6 56.5 47.4 23.0 2.5 2.6 2.7 2.5 2.6 2.5 2.4 2.5 2.1 2.6Other English Bcast 39.0 49.1 53.4 13.5 13.3 13.0 13.7 14.9 10.5 1.2 1.2 1.1 1.1 1.1 1.1 1.1 1.2 1.1 1.2Spanish Bcast 42.7 40.6 39.6 10.4 9.4 10.2 9.6 9.7 6.1 0.7 0.7 0.7 0.7 0.7 0.7 0.7 0.7 0.7 0.6Broadcast Nets 286.0 294.6 268.8 73.6 57.6 57.9 79.8 72.1 39.6 4.4 4.5 4.5 4.4 4.4 4.3 4.2 4.4 3.9 4.4
Commercial Viewing Time (Billions of Minutes) -- % Change Y/YABC -5% -5% -13% -10% -17% -10% -14% -7% 4% 10% 5% 9% 1% 7% 2% -2% -5% -5% -3%CBS -3% 0% -15% -24% -10% -15% -9% -11% -17% -46% -21% 1% -12% -15% -19% -12% -7% -12% -8%FOX -16% -3% 3% 31% -17% 2% -7% -49% -13% -19% -38% 11% 24% 3% -49% -9% -18% -32% -57%NBC -8% 7% -21% -10% -9% -42% -14% 37% -5% -6% -10% 0% -7% -13% -8% -9% 5% -15% -3%CW 4% -7% -19% -18% -23% -14% -17% -22% -19% -43% -31% 0% 45% -34% -30% -30% -26% -37% -23%ION 9% 9% -8% -5% -8% -8% -11% 8% 11% 21% 15% 13% 10% 7% 0% 12% 14% -1% 22%TEL 6% 1% -3% 10% -12% 7% -14% -14% -3% -14% -10% -9% -11% 0% 10% 15% 2% 3% -9%UNI -10% -9% -5% -2% -8% 5% -12% -2% 5% -9% 0% 0% -2% -1% -12% -11% 2% -17% -19%
Big 4 -7% 0% -14% -10% -13% -25% -11% -5% -7% -20% -13% 4% -4% -6% -12% -8% -3% -13% -7%Other English Bcast 8% 26% 9% 18% 18% 3% -1% 11% 11% 14% 15% 16% 18% 4% 4% 5% 11% -1% 16%Spanish Bcast -2% -5% -3% 4% -7% 7% -13% -7% -1% -12% -6% -4% -6% -2% -6% -4% 2% -11% -15%Broadcast Nets -4% 3% -9% -4% -6% -15% -10% -2% -2% -12% -6% 5% 0% -3% -8% -4% 1% -10% -3%
Standard Calendar Years Standard Calendar Quarters Nielsen Calendar Weeks (M-Su 6a-6a) Ending
Source: Nielsen NNTV, Company data, Credit Suisse estimate; QTD based on Program Level results 4/1/18-6/3/18 vs 4/1/17-6/3/17; QTD and most recent two weeks are set to Live+SD ratings and as commercial ratings are reported on a two week delay

10 July 2018
The Walt Disney Company (DIS) 30
Investment RisksRisks to our rating and target price include the following factors specific to Disney:
■ Economic Cyclicality: Disney's operating results are sensitive to consumer spending and thus the state of the wider economy. To the extent the economy and consumer spending are unexpectedly weak or strong, our forecasts for the media networks and theme parks would be affected, along with valuation.
■ Direct-to-Consumer Strategy: Our thesis contemplates management transferring a significant volume of content from third-party streaming services to new proprietary platforms. To the extent that this shift is slower or faster than expected, revenue in the near term could exceed or fall below our forecast. In addition, if subscriber and revenue growth on these new platforms exceeds or falls short of the consensus, we anticipate operating results and valuation multiples may be affected.
■ Long-Term Programming Costs: Television network programming costs constitute a significant portion of Disney’s operating expenditures. Disney has the highest exposure to sports rights costs than industry peers due to ESPN. If sports rights (particularly the NFL contract that will expire in CY21) or other programming costs grow above or below our projections, the profitability of the company would be affected.
■ Popularity of Content: Disney’s competitive position in its industry is dependent on consumer tastes. Shifts in the popularity of content produced by the company may affect operating performance and profitability.
■ Cord Cutting: While Disney content is available through alternative services, the bulk of the company’s media revenues still derive from traditional Pay TV. If cord-cutting and cord-shaving trends accelerate, the company’s revenue growth could slow; similarly, if cord cutting and cord shaving decelerates, the company’s media revenues may exceed our forecasts and support a higher valuation.

10 July 2018
The Walt Disney Company (DIS) 31
Companies Mentioned (Price as of 06-Jul-2018)21st Century Fox (FOXA.OQ, $48.93)AMC Networks (AMCX.OQ, $62.85)AT&T (T.N, $32.68)Alphabet (GOOGL.OQ, $1155.08)Altice Europe (ATCA.AS, €3.284)Amazon com Inc. (AMZN.OQ, $1710.63)CBS (CBS.N, $58.15)Charter Communications (CHTR.OQ, $304.43)Cinemark Holdings, Inc (CNK.N, $37.44)Comcast Corp. (CMCSA.OQ, $33.58)Discovery Inc. (DISCA.OQ, $27.87)Dish Network (DISH.OQ, $34.99)Facebook Inc. (FB.OQ, $203.23)Hasbro (HAS.OQ, $96.05)Interpublic Group (IPG.N, $22.86)Lions Gate Entertainment Corp. (LGFa.N, $25.69)Mattel (MAT.OQ, $17.27)Netflix Inc. (NFLX.OQ, $408.25)Omnicom Group Inc. (OMC.N, $77.08)Publicis Groupe SA (PUBP.PA, €59.56)The Walt Disney Company (DIS.N, $104.78, NEUTRAL, TP $114.0)Verizon Communications (VZ.N, $51.48)Viacom, Inc. (VIAB.OQ, $30.0)WPP (WPP.L, 1190.0p)
Disclosure AppendixAnalyst Certification I, Douglas Mitchelson, certify that (1) the views expressed in this report accurately reflect my personal views about all of the subject companies and securities and (2) no part of my compensation was, is or will be directly or indirectly related to the specific recommendations or views expressed in this report.
3-Year Price and Rating History for The Walt Disney Company (DIS.N)
DIS.N Closing Price Target Price Date (US$) (US$) Rating 10-Aug-15 111.00 120.00 O 10-Nov-15 117.42 130.00 11-May-16 102.29 128.00 27-Oct-16 94.02 125.00 08-Aug-17 106.98 120.00 07-Nov-17 101.61 NC * Asterisk signifies initiation or assumption of coverage.Effective July 3, 2016, NC denotes termination of coverage.
Target Price Closing Price DIS.N
01- Jan- 2016 01- Jan- 2017 01- Jan- 201880
90
100
110
120
130
O U T PERFO RMN O T C O V ERED
As of December 10, 2012 Analysts’ stock rating are defined as follows:Outperform (O) : The stock’s total return is expected to outperform the relevant benchmark* over the next 12 months.Neutral (N) : The stock’s total return is expected to be in line with the relevant benchmark* over the next 12 months.Underperform (U) : The stock’s total return is expected to underperform the relevant benchmark* over the next 12 months. *Relevant benchmark by region: As of 10th December 2012, Japanese ratings are based on a stock’s total return relative to the analyst's coverage universe which consists of all companies covered by the analyst within the relevant sector, with Outperforms representing the most attractive, Neutrals the less attractive, and Underperforms the least attractive investment opportunities. As of 2nd October 2012, U.S. and Canadian as well as European ratings are based on a stock’s total return relative to the analyst's coverage universe which consists of all companies covered by the analyst within the relevant sector, with Outperforms representing the most attractive, Neutrals the less attractive, and Underperforms the least attractive investment opportunities. For Latin American and Asia stocks (excluding Japan and Australia), ratings are based on a stock’s total return relative to the average total return of the relevant country or regional benchmark (India - S&P BSE Sensex Index); prior to 2nd October 2012 U.S. and Canadian ratings were based on (1) a stock’s absolute total return potential to its current share price and (2) the relative attractiveness of a stock’s total return potential within an analyst’s coverage universe. For Australian and New Zealand stocks, the expected total return (ETR) calculation includes 12-month rolling dividend yield. An Outperform rating is assigned where an ETR is greater than or equal to 7.5%; Underperform where an ETR less than or equal to 5%. A Neutral may be assigned where the ETR is between -5% and 15%. The overlapping rating range allows analysts to assign a rating that puts ETR in the context of associated risks. Prior to 18 May 2015, ETR ranges for Outperform and Underperform ratings did not overlap with Neutral thresholds between 15% and 7.5%, which was in operation from 7 July 2011.Restricted (R) : In certain circumstances, Credit Suisse policy and/or applicable law and regulations preclude certain types of communications, including an investment recommendation, during the course of Credit Suisse's engagement in an investment banking transaction and in certain other circumstances.Not Rated (NR) : Credit Suisse Equity Research does not have an investment rating or view on the stock or any other securities related to the company at this time.Not Covered (NC) : Credit Suisse Equity Research does not provide ongoing coverage of the company or offer an investment rating or investment view on the equity security of the company or related products.
10 July 2018
The Walt Disney Company (DIS) 32
Volatility Indicator [V] : A stock is defined as volatile if the stock price has moved up or down by 20% or more in a month in at least 8 of the past 24 months or the analyst expects significant volatility going forward.Analysts’ sector weightings are distinct from analysts’ stock ratings and are based on the analyst’s expectations for the fundamentals and/or valuation of the sector* relative to the group’s historic fundamentals and/or valuation:Overweight : The analyst’s expectation for the sector’s fundamentals and/or valuation is favorable over the next 12 months.Market Weight : The analyst’s expectation for the sector’s fundamentals and/or valuation is neutral over the next 12 months.Underweight : The analyst’s expectation for the sector’s fundamentals and/or valuation is cautious over the next 12 months. *An analyst’s coverage sector consists of all companies covered by the analyst within the relevant sector. An analyst may cover multiple sectors.
Credit Suisse's distribution of stock ratings (and banking clients) is:
Global Ratings DistributionRating Versus universe (%) Of which banking clients (%)Outperform/Buy* 48% (62% banking clients)Neutral/Hold* 37% (57% banking clients)Underperform/Sell* 13% (51% banking clients)Restricted 2%*For purposes of the NYSE and FINRA ratings distribution disclosure requirements, our stock ratings of Outperform, Neutral, and Underperform most closely correspond to Buy, Hold, and Sell, respectively; however, the meanings are not the same, as our stock ratings are determined on a relative basis. (Please refer to definitions above.) An investor's decision to buy or sell a security should be based on investment objectives, current holdings, and other individual factors.
Important Global Disclosures Credit Suisse’s research reports are made available to clients through our proprietary research portal on CS PLUS. Credit Suisse research products may also be made available through third-party vendors or alternate electronic means as a convenience. Certain research products are only made available through CS PLUS. The services provided by Credit Suisse’s analysts to clients may depend on a specific client’s preferences regarding the frequency and manner of receiving communications, the client’s risk profile and investment, the size and scope of the overall client relationship with the Firm, as well as legal and regulatory constraints. To access all of Credit Suisse’s research that you are entitled to receive in the most timely manner, please contact your sales representative or go to https://plus.credit-suisse.com . Credit Suisse’s policy is to update research reports as it deems appropriate, based on developments with the subject company, the sector or the market that may have a material impact on the research views or opinions stated herein.Credit Suisse's policy is only to publish investment research that is impartial, independent, clear, fair and not misleading. For more detail please refer to Credit Suisse's Policies for Managing Conflicts of Interest in connection with Investment Research: https://www.credit-suisse.com/sites/disclaimers-ib/en/managing-conflicts.html . Credit Suisse does not provide any tax advice. Any statement herein regarding any US federal tax is not intended or written to be used, and cannot be used, by any taxpayer for the purposes of avoiding any penalties.Credit Suisse has decided not to enter into business relationships with companies that Credit Suisse has determined to be involved in the development, manufacture, or acquisition of anti-personnel mines and cluster munitions. For Credit Suisse's position on the issue, please see https://www.credit-suisse.com/media/assets/corporate/docs/about-us/responsibility/banking/policy-summaries-en.pdf . The analyst(s) responsible for preparing this research report received compensation that is based upon various factors including Credit Suisse's total revenues, a portion of which are generated by Credit Suisse's investment banking activities
Target Price and RatingValuation Methodology and Risks: (12 months) for The Walt Disney Company (DIS.N)
Method: DIS is trading at 9.6x CY19e EV/EBITDA and 15x P/E, well above the media sector but reflective of its scale, brands, high return on total assets, and very attractive Theme Parks business soon being the largest segment. Our $114 target price and Neutral rating are derived via DCF, using an 8.7% cost of equity, 3.25% pre-tax cost of debt, and 2% terminal growth.
Risk: Risks to our Neutral rating and $114 target price include economic cyclicality, level of DTC spending and success, long-term programming costs (esp. NFL), popularity of content, and cord-cutting pace.
Please refer to the firm's disclosure website at https://rave.credit-suisse.com/disclosures/view/selectArchive for the definitions of abbreviations typically used in the target price method and risk sections. See the Companies Mentioned section for full company names Credit Suisse currently has, or had within the past 12 months, the following as investment banking client(s): DIS.NCredit Suisse provided investment banking services to the subject company (DIS.N) within the past 12 months.Credit Suisse currently has, or had within the past 12 months, the following issuer(s) as client(s), and the services provided were non-investment-banking, securities-related: DIS.NCredit Suisse has managed or co-managed a public offering of securities for the subject company (DIS.N) within the past 12 months.Within the past 12 months, Credit Suisse has received compensation for investment banking services from the following issuer(s): DIS.NCredit Suisse expects to receive or intends to seek investment banking related compensation from the subject company (DIS.N) within the next 3 months.Within the last 12 months, Credit Suisse has received compensation for non-investment banking services or products from the following issuer(s): DIS.NCredit Suisse or a member of the Credit Suisse Group is a market maker or liquidity provider in the securities of the following subject issuer(s): DIS.N

10 July 2018
The Walt Disney Company (DIS) 33
A member of the Credit Suisse Group is party to an agreement with, or may have provided services set out in sections A and B of Annex I of Directive 2014/65/EU of the European Parliament and Council ("MiFID Services") to, the subject issuer (DIS.N) within the past 12 months.For date and time of production, dissemination and history of recommendation for the subject company(ies) featured in this report, disseminated within the past 12 months, please refer to the link: https://rave.credit-suisse.com/disclosures/view/report?i=368046&v=-19op61nn3c70ksjhn1wlpghjt . Important Regional Disclosures Singapore recipients should contact Credit Suisse AG, Singapore Branch for any matters arising from this research report.The analyst(s) involved in the preparation of this report may participate in events hosted by the subject company, including site visits. Credit Suisse does not accept or permit analysts to accept payment or reimbursement for travel expenses associated with these events.Restrictions on certain Canadian securities are indicated by the following abbreviations: NVS--Non-Voting shares; RVS--Restricted Voting Shares; SVS--Subordinate Voting Shares.Individuals receiving this report from a Canadian investment dealer that is not affiliated with Credit Suisse should be advised that this report may not contain regulatory disclosures the non-affiliated Canadian investment dealer would be required to make if this were its own report.For Credit Suisse Securities (Canada), Inc.'s policies and procedures regarding the dissemination of equity research, please visit https://www.credit-suisse.com/sites/disclaimers-ib/en/canada-research-policy.html.Principal is not guaranteed in the case of equities because equity prices are variable.Commission is the commission rate or the amount agreed with a customer when setting up an account or at any time after that.This research report is authored by:Credit Suisse Securities (USA) LLC...................................................................Douglas Mitchelson ; Meghan Durkin ; Brian Russo ; Grant JoslinImportant Credit Suisse HOLT Disclosures The HOLT methodology does not assign ratings or a target price to a security. It is an analytical tool that involves use of a set of proprietary quantitative algorithms and warranted value calculations, collectively called the HOLT valuation model, that are consistently applied to all the companies included in its database. Third-party data (including consensus earnings estimates) are systematically translated into a number of default variables and incorporated into the algorithms available in the HOLT valuation model. The source financial statement, pricing, and earnings data provided by outside data vendors are subject to quality control and may also be adjusted to more closely measure the underlying economics of firm performance. These adjustments provide consistency when analyzing a single company across time, or analyzing multiple companies across industries or national borders. The default scenario that is produced by the HOLT valuation model establishes a warranted price for a security, and as the third-party data are updated, the warranted price may also change. The default variables may also be adjusted to produce alternative warranted prices, any of which could occur. The warranted price is an algorithmic output applied systematically across all companies based on historical levels and volatility of returns. Additional information about the HOLT methodology is available on request.CFROI, CFROE, HOLT, HOLT Lens, HOLTfolio, "Clarity is Confidence" and "Powered by HOLT" are trademarks or registered trademarks of Credit Suisse Group AG or its affiliates in the United States and other countries.HOLT is a corporate performance and valuation advisory service of Credit Suisse.© 2018 Credit Suisse Group AG and its subsidiaries and affiliates. All rights reserved.Important disclosures regarding companies that are the subject of this report are available by calling +1 (877) 291-2683. The same important disclosures, with the exception of valuation methodology and risk discussions, are also available on Credit Suisse’s disclosure website at https://rave.credit-suisse.com/disclosures . For valuation methodology and risks associated with any recommendation, price target, or rating referenced in this report, please refer to the disclosures section of the most recent report regarding the subject company.

10 July 2018
The Walt Disney Company (DIS) 34
This report is produced by subsidiaries and affiliates of Credit Suisse operating under its Global Markets Division. For more information on our structure, please use the following link: https://www.credit-suisse.com/who-we-are This report may contain material that is not directed to, or intended for distribution to or use by, any person or entity who is a citizen or resident of or located in any locality, state, country or other jurisdiction where such distribution, publication, availability or use would be contrary to law or regulation or which would subject Credit Suisse or its affiliates ("CS") to any registration or licensing requirement within such jurisdiction. All material presented in this report, unless specifically indicated otherwise, is under copyright to CS. None of the material, nor its content, nor any copy of it, may be altered in any way, transmitted to, copied or distributed to any other party, without the prior express written permission of CS. All trademarks, service marks and logos used in this report are trademarks or service marks or registered trademarks or service marks of CS or its affiliates.The information, tools and material presented in this report are provided to you for information purposes only and are not to be used or considered as an offer or the solicitation of an offer to sell or to buy or subscribe for securities or other financial instruments. CS may not have taken any steps to ensure that the securities referred to in this report are suitable for any particular investor. CS will not treat recipients of this report as its customers by virtue of their receiving this report. The investments and services contained or referred to in this report may not be suitable for you and it is recommended that you consult an independent investment advisor if you are in doubt about such investments or investment services. Nothing in this report constitutes investment, legal, accounting or tax advice, or a representation that any investment or strategy is suitable or appropriate to your individual circumstances, or otherwise constitutes a personal recommendation to you. CS does not advise on the tax consequences of investments and you are advised to contact an independent tax adviser. Please note in particular that the bases and levels of taxation may change. Information and opinions presented in this report have been obtained or derived from sources believed by CS to be reliable, but CS makes no representation as to their accuracy or completeness. CS accepts no liability for loss arising from the use of the material presented in this report, except that this exclusion of liability does not apply to the extent that such liability arises under specific statutes or regulations applicable to CS. This report is not to be relied upon in substitution for the exercise of independent judgment. CS may have issued, and may in the future issue, other communications that are inconsistent with, and reach different conclusions from, the information presented in this report. Those communications reflect the different assumptions, views and analytical methods of the analysts who prepared them and CS is under no obligation to ensure that such other communications are brought to the attention of any recipient of this report. Some investments referred to in this report will be offered solely by a single entity and in the case of some investments solely by CS, or an associate of CS or CS may be the only market maker in such investments. Past performance should not be taken as an indication or guarantee of future performance, and no representation or warranty, express or implied, is made regarding future performance. Information, opinions and estimates contained in this report reflect a judgment at its original date of publication by CS and are subject to change without notice. The price, value of and income from any of the securities or financial instruments mentioned in this report can fall as well as rise. The value of securities and financial instruments is subject to exchange rate fluctuation that may have a positive or adverse effect on the price or income of such securities or financial instruments. Investors in securities such as ADR's, the values of which are influenced by currency volatility, effectively assume this risk. Structured securities are complex instruments, typically involve a high degree of risk and are intended for sale only to sophisticated investors who are capable of understanding and assuming the risks involved. The market value of any structured security may be affected by changes in economic, financial and political factors (including, but not limited to, spot and forward interest and exchange rates), time to maturity, market conditions and volatility, and the credit quality of any issuer or reference issuer. Any investor interested in purchasing a structured product should conduct their own investigation and analysis of the product and consult with their own professional advisers as to the risks involved in making such a purchase. Some investments discussed in this report may have a high level of volatility. High volatility investments may experience sudden and large falls in their value causing losses when that investment is realised. Those losses may equal your original investment. Indeed, in the case of some investments the potential losses may exceed the amount of initial investment and, in such circumstances, you may be required to pay more money to support those losses. Income yields from investments may fluctuate and, in consequence, initial capital paid to make the investment may be used as part of that income yield. Some investments may not be readily realisable and it may be difficult to sell or realise those investments, similarly it may prove difficult for you to obtain reliable information about the value, or risks, to which such an investment is exposed. This report may provide the addresses of, or contain hyperlinks to, websites. Except to the extent to which the report refers to website material of CS, CS has not reviewed any such site and takes no responsibility for the content contained therein. Such address or hyperlink (including addresses or hyperlinks to CS's own website material) is provided solely for your convenience and information and the content of any such website does not in any way form part of this document. Accessing such website or following such link through this report or CS's website shall be at your own risk.
This report is issued and distributed in European Union (except Switzerland): by Credit Suisse Securities (Europe) Limited, One Cabot Square, London E14 4QJ, England, which is authorised by the Prudential Regulation Authority and regulated by the Financial Conduct Authority and the Prudential Regulation Authority. Germany: Credit Suisse (Deutschland) Aktiengesellschaft regulated by the Bundesanstalt fuer Finanzdienstleistungsaufsicht ("BaFin"). United States and Canada: Credit Suisse Securities (USA) LLC; Switzerland: Credit Suisse AG; Brazil: Banco de Investimentos Credit Suisse (Brasil) S.A or its affiliates; Mexico: Banco Credit Suisse (México), S.A. (transactions related to the securities mentioned in this report will only be effected in compliance with applicable regulation); Japan: by Credit Suisse Securities (Japan) Limited, Financial Instruments Firm, Director-General of Kanto Local Finance Bureau ( Kinsho) No. 66, a member of Japan Securities Dealers Association, The Financial Futures Association of Japan, Japan Investment Advisers Association, Type II Financial Instruments Firms Association; Hong Kong: Credit Suisse (Hong Kong) Limited; Australia: Credit Suisse Equities (Australia) Limited; Thailand: Credit Suisse Securities (Thailand) Limited, regulated by the Office of the Securities and Exchange Commission, Thailand, having registered address at 990 Abdulrahim Place, 27th Floor, Unit 2701, Rama IV Road, Silom, Bangrak, Bangkok10500, Thailand, Tel. +66 2614 6000; Malaysia: Credit Suisse Securities (Malaysia) Sdn Bhd; Singapore: Credit Suisse AG, Singapore Branch; India: Credit Suisse Securities (India) Private Limited (CIN no.U67120MH1996PTC104392) regulated by the Securities and Exchange Board of India as Research Analyst (registration no. INH 000001030) and as Stock Broker (registration no. INB230970637; INF230970637; INB010970631; INF010970631), having registered address at 9th Floor, Ceejay House, Dr.A.B. Road, Worli, Mumbai - 18, India, T- +91-22 6777 3777; South Korea: Credit Suisse Securities (Europe) Limited, Seoul Branch; Taiwan: Credit Suisse AG Taipei Securities Branch; Indonesia: PT Credit Suisse Sekuritas Indonesia; Philippines:Credit Suisse Securities (Philippines ) Inc., and elsewhere in the world by the relevant authorised affiliate of the above.Additional Regional DisclaimersHong Kong: Credit Suisse (Hong Kong) Limited ("CSHK") is licensed and regulated by the Securities and Futures Commission of Hong Kong under the laws of Hong Kong, which differ from Australian laws. CSHKL does not hold an Australian financial services licence (AFSL) and is exempt from the requirement to hold an AFSL under the Corporations Act 2001 (the Act) under Class Order 03/1103 published by the ASIC in respect of financial services provided to Australian wholesale clients (within the meaning of section 761G of the Act). Research on Taiwanese securities produced by Credit Suisse AG, Taipei Securities Branch has been prepared by a registered Senior Business Person. Australia (to the extent services are offered in Australia): Credit Suisse Securities (Europe) Limited (“CSSEL”) and Credit Suisse International (“CSI”) are authorised by the Prudential Regulation Authority and regulated by the Financial Conduct Authority (“FCA”) and the Prudential Regulation Authority under UK laws, which differ from Australian Laws. CSSEL and CSI do not hold an Australian Financial Services Licence (“AFSL”) and are exempt from the requirement to hold an AFSL under the Corporations Act (Cth) 2001 (“Corporations Act”) under Class Order 03/1099 published by the Australian Securities and Investments Commission (“ASIC”), in respect of the financial services provided to Australian wholesale clients (within the meaning of section 761G of the Corporations Act). This material is not for distribution to retail clients and is directed exclusively at Credit Suisse's professional clients and eligible counterparties as defined by the FCA, and wholesale clients as defined under section 761G of the Corporations Act. Credit Suisse (Hong Kong) Limited (“CSHK”) is licensed and regulated by the Securities and Futures Commission of Hong Kong under the laws of Hong Kong, which differ from Australian laws. CSHKL does not hold an AFSL and is exempt from the requirement to hold an AFSL under the Corporations Act under Class Order 03/1103 published by the ASIC in respect of financial services provided to Australian wholesale clients (within the meaning of section 761G of the Corporations Act). Credit Suisse Securities (USA) LLC (CSSU) and Credit Suisse Asset Management LLC (CSAM LLC) are licensed and regulated by the Securities Exchange Commission of the United States under the laws of the United States, which differ from Australian laws. CSSU and CSAM LLC do not hold an AFSL and is exempt from the requirement to hold an AFSL under the Corporations Act under Class Order 03/1100 published by the ASIC in respect of financial services provided to Australian wholesale clients (within the meaning of section 761G of the Corporations Act). Malaysia: Research provided to residents of Malaysia is authorised by the Head of Research for Credit Suisse Securities (Malaysia) Sdn Bhd, to whom they should direct any queries on +603 2723 2020. Singapore: This report has been prepared and issued for distribution in Singapore to institutional investors, accredited investors and expert investors (each as defined under the Financial Advisers Regulations) only, and is also distributed by Credit Suisse AG, Singapore Branch to overseas investors (as defined under the Financial Advisers Regulations). Credit Suisse AG, Singapore Branch may distribute reports produced by its foreign entities or affiliates pursuant to an arrangement under Regulation 32C of the Financial Advisers Regulations. Singapore recipients should contact Credit Suisse AG, Singapore Branch at +65-6212-2000 for matters arising from, or in connection with, this report. By virtue of your status as an institutional investor, accredited investor, expert investor or overseas investor, Credit Suisse AG, Singapore Branch is exempted from complying with certain compliance requirements under the Financial Advisers Act, Chapter 110 of Singapore (the “FAA”), the Financial Advisers Regulations and the relevant Notices and Guidelines issued thereunder, in respect of any financial advisory service which Credit Suisse AG, Singapore Branch may provide to you. UAE: This information is being distributed by Credit Suisse AG (DIFC Branch), duly licensed and regulated by the Dubai Financial Services Authority (“DFSA”). Related financial services or products are only made available to Professional Clients or Market Counterparties, as defined by the DFSA, and are not intended for any other persons. Credit Suisse AG (DIFC Branch) is located on Level 9 East, The Gate Building, DIFC, Dubai, United Arab Emirates. EU: This report has been produced by subsidiaries and affiliates of Credit Suisse operating under its Global Markets Division In jurisdictions where CS is not already registered or licensed to trade in securities, transactions will only be effected in accordance with applicable securities legislation, which will vary from jurisdiction to jurisdiction and may require that the trade be made in accordance with applicable exemptions from registration or licensing requirements. This material is issued and distributed in the U.S. by CSSU, a member of NYSE, FINRA, SIPC and the NFA, and CSSU accepts responsibility for its contents. Clients should contact analysts and execute transactions through a Credit Suisse subsidiary or affiliate in their home jurisdiction unless governing law permits otherwise. Please note that this research was originally prepared and issued by CS for distribution to their market professional and institutional investor customers. Recipients who are not market professional or institutional investor customers of CS should seek the advice of their independent financial advisor prior to taking any investment decision based on this report or for any necessary explanation of its contents. This research may relate to investments or services of a person outside of the UK or to other matters which are not authorised by the Prudential Regulation Authority and regulated by the Financial Conduct Authority and the Prudential Regulation Authority or in respect of which the protections of the Prudential Regulation Authority and Financial Conduct Authority for private customers and/or the UK compensation scheme may not be available, and further details as to where this may be the case are available upon request in respect of this report. CS may provide various services to US municipal entities or obligated persons ("municipalities"), including suggesting individual transactions or trades and entering into such transactions. Any services CS provides to municipalities are not viewed as "advice" within the meaning of Section 975 of the Dodd-Frank Wall Street Reform and Consumer Protection Act. CS is providing any such services and related information solely on an arm's length basis and not as an advisor or fiduciary to the municipality. In connection with the provision of the any such services, there is no agreement, direct or indirect, between any municipality (including the officials,management, employees or agents thereof) and CS for CS to provide advice to the municipality. Municipalities should consult with their financial, accounting and legal advisors regarding any such services provided by CS. In addition, CS is not acting for direct or indirect compensation to solicit the municipality on behalf of an unaffiliated broker, dealer, municipal securities dealer, municipal advisor, or investment adviser for the purpose of obtaining or retaining an engagement by the municipality for or in connection with Municipal Financial Products, the issuance of municipal securities, or of an investment adviser to provide investment advisory services to or on behalf of the municipality. If this report is being distributed by a financial institution other than Credit Suisse AG, or its affiliates, that financial institution is solely responsible for distribution. Clients of that institution should contact that institution to effect a transaction in the securities mentioned in this report or require further information. This report does not constitute investment advice by Credit Suisse to the clients of the distributing financial institution, and neither Credit Suisse AG, its affiliates, and their respective officers, directors and employees accept any liability whatsoever for any direct or consequential loss arising from their use of this report or its content. Principal is not guaranteed. Commission is the commission rate or the amount agreed with a customer when setting up an account or at any time after that. No information or communication provided herein or otherwise is intended to be, or should be construed as, a recommendation within the meaning of the US Department of Labor’s final regulation defining "investment advice" for purposes of the Employee Retirement Income Security Act of 1974, as amended and Section 4975 of the Internal Revenue Code of 1986, as amended, and the information provided herein is intended to be general information, and should not be construed as, providing investment advice (impartial or otherwise). Copyright © 2018 CREDIT SUISSE AG and/or its affiliates. All rights reserved. Investment principal on bonds can be eroded depending on sale price or market price. In addition, there are bonds on which investment principal can be eroded due to changes in redemption amounts. Care is required when investing in such instruments.